Correction: Systematic Phenotyping and Molecular Analysis of the Woozy Mouse: A Preclinical Model of Cerebellar Ataxia
Fabio Bellia, Laura Amodei, Anna Giulia Ruggieri, Francesca Potenza, Marianna Viele, Manuela Bomba, Francesco Del Pizzo, Manuela Iezzi, Alberto Granzotto, Luca Federici, Michele Sallese

Abstract
Genes, proteins, chemicals, diseases, species, mutations and cell lines named across the full text — each resolved to its canonical identifier and authoritative record.
Click any figure to enlarge with its caption.
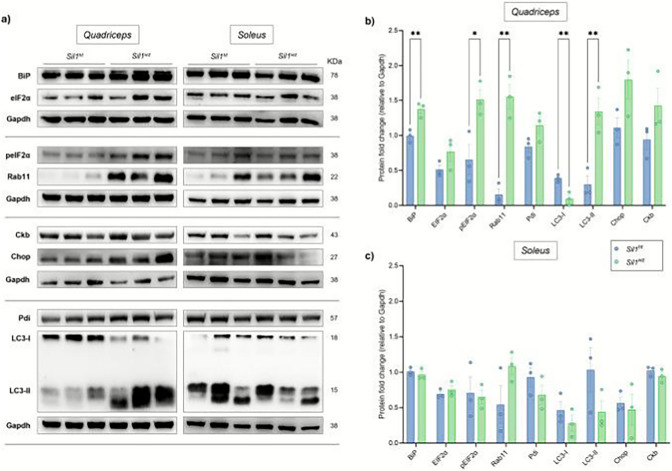 Figure 1
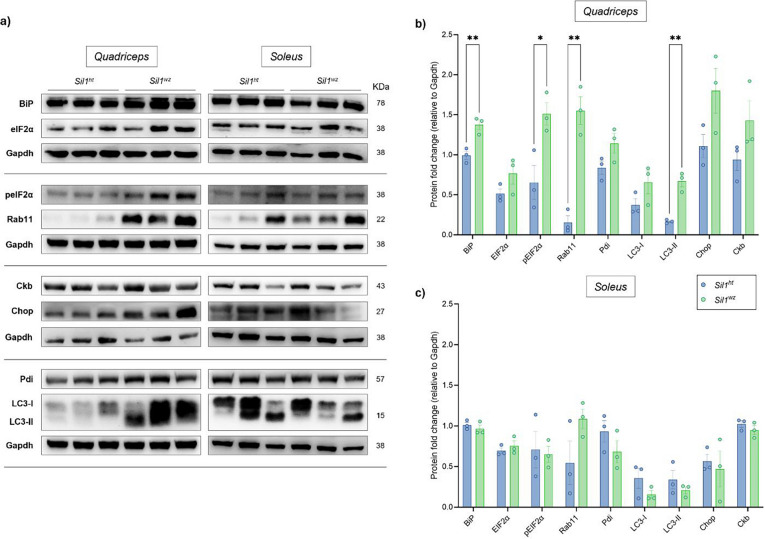 Figure 2
Peer Reviews
No public reviews on file for this paper yet. If you reviewed it on a platform where reviews are public (OpenReview, ICLR, NeurIPS, ICML), you can paste yours below so the community can read it here.
Videos
No videos yet. Explain this paper in a talk, walkthrough, or lecture? Add one.
Taxonomy
TopicsGenetic Neurodegenerative Diseases · Amyotrophic Lateral Sclerosis Research · Vestibular and auditory disorders
Correction: Molecular Neurobiology (2025) 63:258
10.1007/s12035-025-05577-y
In the originally published version of this article, Figure 8a was incorrectly labelled. As a consequence, the quantifications shown in Figure 8b and c, a paragraph in the Results section, and Supplementary Table 10 contained incorrect information derived from a nonspecific band.
The incorrect elements are reported below for transparency, followed by the corrected Figure 8, revised Results paragraph, and corrected Supplementary Table 10.
Incorrect Figure 8
Incorrect paragraph of the result
Western blot analysis in the quadriceps of 26-week-old Sil1^wz^ mice revealed increased protein levels of BiP (Sil1^wz^: 1.37 ± 0.06, Sil1^ht^: 0.99 ± 0.05; p = 0.0093), pEIF2α (Sil1^wz^: 1.51 ± 0.14, Sil1^ht^: 0.65 ± 0.21; p = 0.0279), Rab11 (Sil1^wz^: 1.55 ± 0.17, Sil1^ht^: 0.16 ± 0.08; p = 0.0019), and the lipidated form of LC3 (Sil1^wz^: 1.34 ± 0.19, Sil1^ht^: 0.30 ± 0.12; p = 0.0095), along with decreased levels of the non-lipidated form of LC3 (Sil1^wz^: 0.10 ± 0.05, Sil1^ht^: 0.39 ± 0.03; p = 0.0093) compared to Sil1^ht^ mice (Fig. 8a and b, and Supplementary Table 10). In the soleus of the same mice, we observed a tendency toward increased Rab11 levels (Sil1^wz^: 1.09 ± 0.12, Sil1^ht^: 0.55 ± 0.27), together with decreased Pdi (Sil1^wz^: 0.68 ± 0.14, Sil1^ht^: 0.93 ± 0.13) and the lipidated form of LC3 (Sil1^wz^: 0.44 ± 0.16, Sil1^ht^: 1.03 ± 0.31) levels (Fig. 8a and c, and Supplementary Table 10). However, no statistical significance was reached between the two experimental groups in the soleus (see Supplementary Table 10).
Incorrect Supplementary Table 10
Supplementary Table 10: ProteinQuadricepsMean ± SEMSoleusMean ± SEMSil1^ht^Sil1^wz^P valueSil1^ht^Sil1^wz^P valueBiP0.99 ± 0.051.37 ± 0.060.00931.01 ± 0.030.97 ± 0.050.4558EIF2α0.51 ± 0.060.78 ± 0.130.16050.69 ± 0.040.75 ± 0.060.4545pEIF2α0.65 ± 0.211.51 ± 0.140.02790.71 ± 0.230.65 ± 0.100.8204Rab110.16 ± 0.081.55 ± 0.170.00190.55 ± 0.271.09 ± 0.120.1384Pdi0.84 ± 0.081.14 ± 0.120.10900.93 ± 0.130.68 ± 0.140.2598LC3-I0.39 ± 0.030.10 ± 0.050.00930.46 ± 0.120.28 ± 0.110.3377LC3-II0.30 ± 0.121.34 ± 0.190.00951.03 ± 0.310.44 ± 0.160.1651Chop1.11 ± 0.141.80 ± 0.280.09390.57 ± 0.090.47 ± 0.220.7072Ckb0.94 ± 0.141.47 ± 0.250.15811.02 ± 0.040.95 ± 0.060.3270
Corrected Figure 8
Correct paragraph of the result
Western blot analysis in the quadriceps of 26-week-old Sil1^wz^ mice revealed increased protein levels of BiP (Sil1^wz^: 1.37 ± 0.06, Sil1^ht^: 0.99 ± 0.05; p = 0.0093), pEIF2α (Sil1^wz^: 1.51 ± 0.14, Sil1^ht^: 0.65 ± 0.21; p = 0.0279), Rab11 (Sil1^wz^: 1.55 ± 0.17, Sil1^ht^: 0.16 ± 0.08; p = 0.0019), and the lipidated (LC3-II) form of LC3 compared to Sil1^ht^ mice (LC3-II: Sil1^wz^: 0.67 ± 0.07, Sil1^ht^: 0.17 ± 0.01; p = 0.0022) (Fig. 8a and b, and Supplementary Table 10). In the soleus of the same mice, we observed a tendency toward increased Rab11 levels (Sil1^wz^: 1.09 ± 0.12, Sil1^ht^: 0.55 ± 0.27), together with decreased Pdi (Sil1^wz^: 0.68 ± 0.14, Sil1^ht^: 0.93 ± 0.13) and both forms of LC3 (LC3-I: Sil1^wz^: 0.16 ± 0.05, Sil1^ht^: 0.36 ± 0.12; LC3-II: Sil1^wz^: 0.21 ± 0.04, Sil1^ht^: 0.34 ± 0.11) levels (Fig. 8a and c, and Supplementary Table 10). However, no statistical significance was reached between the two experimental groups in the soleus (see Supplementary Table 10).
Corrected Supplementary Table 10
Supplementary Table 10: ProteinQuadricepsMean ± SEMSoleusMean ± SEMSil1^ht^Sil1^wz^P valueSil1^ht^Sil1^wz^P valueBiP0.99 ± 0.051.37 ± 0.060.00931.01 ± 0.030.97 ± 0.050.4558EIF2α0.51 ± 0.060.78 ± 0.130.16050.69 ± 0.040.75 ± 0.060.4545pEIF2α0.65 ± 0.211.51 ± 0.140.02790.71 ± 0.230.65 ± 0.100.8204Rab110.16 ± 0.081.55 ± 0.170.00190.55 ± 0.271.09 ± 0.120.1384Pdi0.84 ± 0.081.14 ± 0.120.10900.93 ± 0.130.68 ± 0.140.2598LC3-I0.37 ± 0.080.65 ± 0.140.16010.36 ± 0.120.16 ± 0.050.2060LC3-II0.17 ± 0.010.67 ± 0.070.00220.34 ± 0.110.21 ± 0.040.3545Chop1.11 ± 0.141.80 ± 0.280.09390.57 ± 0.090.47 ± 0.220.7072Ckb0.94 ± 0.141.47 ± 0.250.15811.02 ± 0.040.95 ± 0.060.3270
These corrections do not affect the interpretation of the results or the conclusions of the study. The authors apologize for the error and any inconvenience it may have caused.
The original article has been corrected.