Prognostic Impact of the Hevylite Assay in Patients With IgG or IgA Multiple Myeloma Treated Within the GMMG‐MM5 Trial
Tim Richardson, Elias Mai, Ekaterina Menis, Axel Benner, Diana Tichy, Kaya Miah, Mathias Hänel, Britta Besemer, Amelie Boquoi, Igor Wolfgang Blau, Christian S. Michel, Hans Walter Lindemann, Snjezana Janjetovic, Peter Brossart, Helga Bernhard, Peter Reimer, Hans Salwender

TL;DR
This study examines the Hevylite Assay's ability to predict survival outcomes in multiple myeloma patients, finding limited evidence for its general use but suggesting potential for response-adapted therapy.
Contribution
The study evaluates the prognostic value of Hevylite Assay normalization in multiple myeloma patients across different treatment phases.
Findings
Normalization of HLCr showed a trend toward prolonged progression-free survival but not overall survival.
Differential effects of HLCr normalization were observed depending on treatment adaptation strategies.
No strong evidence supports general use of HLCr normalization as a response parameter for predicting survival.
Abstract
Response assessment during treatment of multiple myeloma (MM) typically relies on immunofixation and serum electrophoresis. However, low levels of IgG and especially IgA paraprotein are difficult to quantify reliably. The Hevylite Assay quantifies the kappa and lambda fractions of IgG and IgA separately and is useful to determine response to therapy. Using serum samples of 360 evaluable patients from the prospective GMMG‐MM5 trial (EudraCT‐No. 2010–019173‐16) we assessed the normalization of the kappa/lambda ratio with the Hevylite Assay (HLCr) at baseline, after induction, mobilization, autologous blood stem cell transplantation, consolidation and every three months during maintenance or follow‐up within two years after the end of consolidation. We observed a steady increase in the proportion of patients with normalized HLCr over the course of therapyAchieving HLCr normalization any…
Genes, proteins, chemicals, diseases, species, mutations and cell lines named across the full text — each resolved to its canonical identifier and authoritative record.
Click any figure to enlarge with its caption.
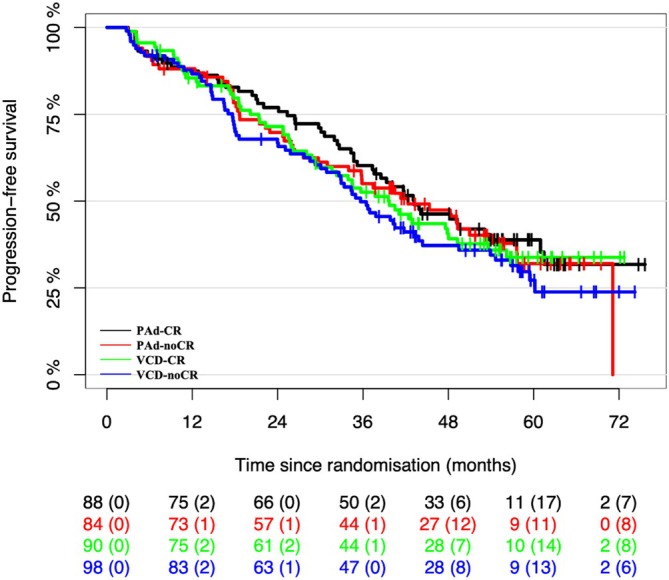 FIGURE 1
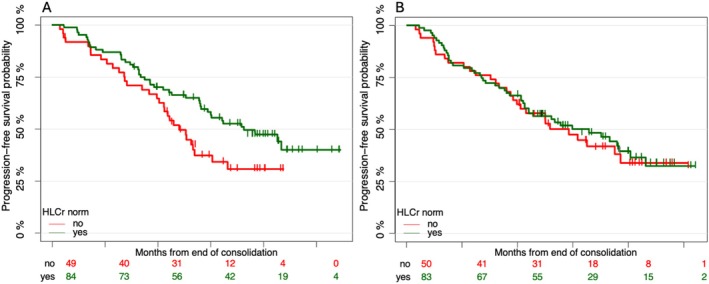 FIGURE 2
| Evaluable | Not evaluable | Overall | |
|---|---|---|---|
| ( | ( | ( | |
| Age | |||
| Mean (CV%) | 58.1 (14.3%) | 58.1 (13.4%) | 58.1 (13.9%) |
| Median [Q1, Q3] | 59.0 [52.0, 65.0] | 59.0 [53.0, 64.0] | 59.0 [53.0, 65.0] |
| SEX | |||
| Male | 217 (60.3%) | 135 (56.0%) | 352 (58.6%) |
| Female | 143 (39.7%) | 106 (44.0%) | 249 (41.4%) |
| WEIGHT | |||
| Mean (CV%) | 79.6 (19.8%) | 77.7 (20.2%) | 78.8 (20.0%) |
| Median [Q1, Q3] | 79.0 [68.0, 90.0] | 75.0 [66.0, 87.0] | 78.0 [68.0, 89.0] |
| Beta2 microglobuline | |||
| Mean (CV%) | 5.10 (128.9%) | 7.09 (166.3%) | 5.90 (153.9%) |
| Median [Q1, Q3] | 3.40 [2.40, 5.13] | 3.80 [2.63, 7.70] | 3.50 [2.50, 5.90] |
| Albumin | |||
| Mean (CV%) | 36.9 (17.3%) | 39.4 (18.0%) | 37.9 (17.9%) |
| Median [Q1, Q3] | 37.3 [32.3, 41.4] | 40.4 [34.9, 44.9] | 38.2 [33.0, 43.0] |
| Missing | 1 (0.3%) | 4 (1.7%) | 5 (0.8%) |
| Renal impairment | |||
| Yes | 29 (8.1%) | 54 (22.4%) | 83 (13.8%) |
| No | 331 (91.9%) | 187 (77.6%) | 518 (86.2%) |
| WHO score | |||
| 0 | 155 (43.1%) | 97 (40.2%) | 252 (41.9%) |
| 1 | 170 (47.2%) | 115 (47.7%) | 285 (47.4%) |
| 2 | 26 (7.2%) | 21 (8.7%) | 47 (7.8%) |
| 3 | 5 (1.4%) | 5 (2.1%) | 10 (1.7%) |
| Not known | 4 (1.1%) | 3 (1.2%) | 7 (1.2%) |
| Mprotein heavy chain, number of patients (%) | |||
| IgA | 99 (27.5%) | 24 (10.0%) | 123 (20.5%) |
| IgG | 261 (72.5%) | 103 (42.7%) | 364 (60.6%) |
| IgD | 0 (0%) | 9 (3.7%) | 9 (1.5%) |
| Light chain myeloma | 0 (0%) | 105 (43.6%) | 105 (17.5%) |
| Mprotein light chain | |||
| Kappa, mg/L | 249 (69.2%) | 155 (64.3%) | 404 (67.2%) |
| Lambda, mg/L | 111 (30.8%) | 86 (35.7%) | 197 (32.8%) |
| Covariate | Covariate levels | Hazard ratio | 95% CI |
|
|---|---|---|---|---|
| Study arm | PAd‐CR | Ref | ||
| PAd‐noCR | 0.96 | [0.63;1.47] | 0.85 | |
| VCD‐CR | 1.09 | [0.73;1.64] | 0.67 | |
| VCD‐noCR | 1.16 | [0.77;1.75] | 0.47 | |
| Hlc.norm. | No | Ref | ||
| Yes | 0.75 | [0.56;1.01] | 0.06 | |
| Response cons | CR | Ref | ||
| No CR | 0.92 | [0.60;1.40] | 0.68 | |
| High risk | No | Ref | ||
| Yes | 1.62 | [1.20;2.19] | 0.002 | |
| ISS | I | Ref | ||
| II | 1.36 | [0.98;1.90] | 0.07 | |
| III | 2.14 | [1.47;3.11] | < 0.001 | |
| Age | 1.00 | [0.98;1.02] | 0.97 | |
| Mprotein.subtype | IgA | Ref | ||
| IgG | 0.98 | [0.69;1.39] | 0.92 |
| Covariate | Covariate levels | Hazard ratio | 95% CI |
|
|---|---|---|---|---|
| Study arm | PAd‐CR | Ref | ||
| PAd‐noCR | 1.19 | [0.77;1.82] | 0.43 | |
| VCD‐CR | 1.34 | [0.88;2.04] | 0.18 | |
| VCD‐noCR | 1.39 | [0.91;2.14] | 0.13 | |
| Hlc.norm. | No | Ref | ||
| Yes | 0.94 | [0.69;1.26] | 0.66 | |
| Response cons | CR | Ref | ||
| No CR | 1.21 | [0.80;1.81] | 0.37 | |
| High risk | No | Ref | ||
| Yes | 1.52 | [1.09;2.14] | 0.01 | |
| ISS | I | Ref | ||
| II | 1.45 | [1.05;2.00] | 0.02 | |
| III | 2.64 | [1.78;3.93] | < 0.001 | |
| Age | 1.01 | [0.99;1.02] | 0.58 | |
| Mprotein.subtype | IgA | Ref | ||
| IgG | 0.88 | [0.62;1.23] | 0.45 |
| Covariate | Covariate levels | Missing | Hazard ratio | 95% CI |
|
|---|---|---|---|---|---|
| HLCr norm. | No | 0 | Ref | ||
| Yes | 0.76 | [0.53;1.09] | 0.13 | ||
| Study arm | PAd/VCD‐CR | 0 | Ref | ||
| PAd/VCD‐noCR | 1.01 | [0.71;1.43] | 0.96 | ||
| High risk | No | 34 | Ref | ||
| Yes | 1.78 | [1.23;2.55] | 0.002 | ||
| ISS | I | 0 | Ref | ||
| II | 1.29 | [0.86;1.94] | 0.22 | ||
| III | 2.01 | [1.29;3.15] | 0.002 | ||
| Age | 0 | 0.99 | [0.97;1.01] | 0.29 |
| Covariate | Covariate levels | Missing | Hazard ratio | 95% CI |
|
|---|---|---|---|---|---|
| HLCr norm. | No | 0 | Ref | ||
| Yes | 0.90 | [0.49;1.65] | 0.73 | ||
| Study arm | PAd/VCD‐CR | 0 | Ref | ||
| PAd/VCD‐noCR | 1.86 | [1.04;3.33] | 0.04 | ||
| High risk | No | 34 | Ref | ||
| Yes | 3.04 | [1.72;5.35] | < 0.001 | ||
| ISS | I | 0 | Ref | ||
| II | 1.29 | [0.62;2.70] | 0.50 | ||
| III | 3.97 | [1.97;8.03] | < 0.001 | ||
| Age | 0 | 1.01 | [0.98;1.05] | 0.53 |
- —Celgene10.13039/100006436
- —Chugai Pharmaceutical10.13039/100010795
- —Johnson and Johnson10.13039/100004331
- —Binding Site GmbH is part of Thermo Fisher Scientific
Peer Reviews
No public reviews on file for this paper yet. If you reviewed it on a platform where reviews are public (OpenReview, ICLR, NeurIPS, ICML), you can paste yours below so the community can read it here.
Videos
No videos yet. Explain this paper in a talk, walkthrough, or lecture? Add one.
Taxonomy
TopicsMultiple Myeloma Research and Treatments · Chemokine receptors and signaling · Myeloproliferative Neoplasms: Diagnosis and Treatment
Introduction
1
The treatment of multiple myeloma (MM) has undergone fundamental changes in the last decades, moving from chemotherapy to immunomodulatory drugs (IMIDs), proteasome inhibitors and antibodies to T‐cell engaging immunotherapies [1]. Using these new therapies with increasing potential to induce rapid and deep remissions has prompted the development of novel ways to assess the tumor burden, in particular methods to detect minimal residual disease (MRD) in the bone marrow by either next generation flow or next generation sequencing [2]. While these techniques are indispensable tools for clinical studies, the need for bone marrow puncture and the complex and costly laboratory analyses have so far limited their broad use in clinical routine worldwide. Therefore, it would be desirable to use minimally invasive blood sampling to assess tumor activity and a more sensitive assessment of circulating paraprotein might be an appealing candidate for this task.
The monoclonal protein may be a complete immunoglobulin composed of two heavy chains and two light chains or, in cases of light chain MM, only light chains. The production of light chains exceeds that of heavy chains [3]. This imbalance results in an elevated level of light chains in the serum, which can also appear in the urine once renal reabsorption capacity is exceeded [4]. In addition to serum protein electrophoresis (SPE) and immunofixation electrophoresis (IFE) the assessment of free light chains (FLC) in peripheral blood is widely used to monitor myeloma burden and the normalization of the kappa/lambda ratio (FLCr) is part of the definition of stringent complete response (CR) [5]. The prognostic effect of normalization of the FLCr on progression‐free survival (PFS) and overall survival (OS) has been shown [6, 7]. In accompanying research to the GMMG‐MM5 trial (EudraCT‐No. 2010–019173‐16), a statistically significant prognostic effect of FLCr has been shown as well [8].
In 2009, The Binding Site Ltd. (Birmingham, United Kingdom) introduced a novel immunoassay called the Hevylite Assay to precisely measure both the involved and uninvolved immunoglobulin isotypes. This test employs sheep polyclonal antibodies targeting junctional epitopes in the constant region between the heavy and light chains (heavy/light chain, HLC). These HLC antibodies specifically identify different immunoglobulin classes, such as IgGκ, IgGλ, IgAκ, IgAλ, IgMκ, and IgMλ. Measurements are made in pairs (e.g., IgGκ/IgGλ) to determine the ratios of involved to uninvolved immunoglobulins, similar to the FLC κ/λ ratios [9].
Research using the HLC assay suggests that HLC ratios (HLCr) are valuable for screening, monitoring, and risk stratifying patients with multiple myeloma (MM), Amyloid Light‐chain (AL) amyloidosis, Waldenström's macroglobulinemia, and monoclonal gammopathy of undetermined significance (MGUS) [7, 10, 11, 12]. In addition, HLC testing can reflect restoration of plasma cell homeostasis, i.e., recovery of normal plasma cell populations, which has been shown in several studies to correlate with improved progression‐free and overall survival [13, 14]. Furthermore, in some cases, these ratios may serve as sensitive markers of disease progression [13]. The utility of the HLC assay to identify and quantify the paraprotein even when SPE and IFE are difficult to evaluate, has been shown [15, 16].
Thus, in a trial with a response‐adapted treatment design, we aimed to investigate whether a more detailed analysis of paraprotein response using HLCr normalization would provide additional prognostic information on clinical outcomes focusing on patients with IgG or IgA myeloma.
Methods
2
GMMG‐MM5 Trial
2.1
Transplant‐eligible patients with newly diagnosed MM and measurable disease were enrolled in the prospective, multicenter, phase III MM5 trial (EudraCT No. 2010–019173‐16) and 601 patients were randomly assigned to one of four treatment arms. Details regarding eligibility criteria, study design, and primary endpoints have been published elsewhere [17]. Following randomization, participants underwent induction therapy with three cycles of either bortezomib, doxorubicin, and dexamethasone (PAd) or bortezomib, cyclophosphamide, and dexamethasone (VCD). Stem cell mobilization, high‐dose melphalan therapy, and autologous stem cell transplantation (ASCT) were performed in accordance with local protocols. After these procedures, 2 cycles of lenalidomide and dexamethasone were administered for consolidation, followed by lenalidomide maintenance therapy continuously for two years in the two arms PAd‐CR and VCD‐CR, while in the other two arms PAd‐noCR and VCD‐noCR it was given to patients not in CR and until CR was achieved (Figure S1; Supporting Information). The GMMG‐MM5 trial received approval from the ethics committees of all participating institutions, with the University of Heidelberg serving as the lead ethics committee (AFmu‐119/2010). All participants provided written informed consent.
Assessment of Paraprotein
2.2
Using the commercially available Hevylite assay (The Binding Site, Birmingham, UK), kappa and lambda fractions of the IgG or IgA paraprotein were measured on serum samples from baseline, the end of induction, after high‐dose therapy, at the end of consolidation and during the maintenance phase. Normal ranges have been established by the manufacturer and are as follows: IgGκ 3.84–12.07 g/L; IgGλ 1.91–6.74 g/L; IgGκ/IgGλ 1.12–3.21; IgAk 0.57–2.08 g/L; IgAλ 0.44–2.04 g/L; IgAk/IgAλ 0.78–1.94. For free light chains, the manufacturer's reference range of κ/λ ratio 0.26–1.65 was applied. A HLCr within the reference range was recorded as normal [13].
Statistical Methods
2.3
During the course of therapy until the end of consolidation, FLCr and HLCr were coded as normal or abnormal if they were inside or outside the reference range. FLCr and HLCr were used as time‐dependent covariates in a multivariable Cox regression analysis for PFS and OS, respectively. HLCr normalization was defined as the presence of a normal HLCr during therapy until the end of consolidation. Response at the end of consolidation (CR versus no CR) was used as an additional time‐dependent covariate. Age (years), International Staging System (ISS, stages I, II and III), high‐risk cytogenetics (yes, no; defined as either deletion 17p13 and/or translocation t(4;14) and/or gain 1q21 (> 3 copies)), paraprotein type (IgA or IgG) and study arm (PAd‐CR vs. VCD‐CR vs. PAd‐noCR vs. VCD‐noCR) were included as fixed covariates. Results were reported using hazard ratio estimates and corresponding 95% confidence intervals (CI). The proportional hazards assumption was checked graphically using scaled Schoenfeld residuals.
The curves for PFS and OS and the corresponding 95% CIs were derived using the method of Kaplan and Meier. Landmark Cox regression analyses were performed from the end of consolidation to assess the impact of HLCr normalization at this time point. No multiplicity adjustments were performed for exploratory analyses. Values of p < 0.05 were considered statistically significant. The analyses were conducted using R version 4.3.2 (https://www.R‐project.org, Vienna, Austria).
Results
3
The expanded population of the GMMG‐MM5 trial consisted of 604 patients (ref. https://doi.org/10.1038/s41375‐020‐0976‐9). Three patients were excluded due to violation of inclusion criteria. Of the 601 patients included in the intention to treat (ITT) population, 360 had an IgA or IgG paraprotein and available serum samples. Besides the type of paraprotein there was no difference in baseline characteristics between these patients and the remaining 241 patients of the ITT population (Table 1).
Both groups were also comparable in terms of response at the end of consolidation therapy when considering the 4 different arms of the study. The proportion of patients in CR after consolidation varied between 8.9% and 26.5% in the evaluable cohort and between 19.7% and 28.8% in the remaining patients (Table S1).
Figure 1 shows the PFS curves of the four study arms.
With a median follow‐up of 57, 6 months, 222 PFS events were observed in 360 evaluable patients. The distribution of PFS for the subset of the Hevylite analysis, is calculated by the method of Kaplan and Meier, stratified by randomization arm.
At first, we aimed to replicate the findings by Klein et al. [7] on the prognostic impact of FLCr normalization in patients with MM treated within the GMMG‐MM5 trial when selecting only patients with immunoglobulin paraprotein.
When assessing the normalization of FLCr as a time‐dependent covariate in a multivariable Cox regression, it was found to be a statistically significant prognostic factor for PFS (HR 0.71, 95% CI 0.51–1.00, p = 0.05) and marginally statistically significant for OS (HR 0.67, 95% CI 0.43–1.05, p = 0.08), confirming the role of FLC ratio normalization in a cohort of patients with only IgG or IgA paraprotein.
When analysing the effect of normalization of HLCr using a corresponding multivariable Cox regression, there was a trend towards an improved PFS (Table 2, HR 0.75, 95% CI 0.56–1.01, p = 0.06), while high‐risk cytogenetics and ISS were found to be the strongest prognostic factors for PFS and OS. Normalization of HLCr showed no clear effect (HR 0.94, 95% CI 0.69–1.26, p = 0.66) in multivariable time‐dependent Cox regression analysis with respect to overall survival (Table 3).
In addition, a multivariable Cox regression landmark analysis for PFS and OS from the end of consolidation was performed. Again, high‐risk cytogenetics and ISS were found to be statistically significant prognostic factors both for PFS and OS, while HLCr normalization showed a trend for better PFS (HR 0.76, 95% CI 0.53–1.09, p = 0.13; Table 4) but not for OS (HR 0.90, 95% CI 0.49–1.65, p = 0.73; Table 5).
Since the GMMG‐MM5 trial investigated two different maintenance strategies, the analysis was repeated separately for the continuous (PAd‐CR and VCD‐CR) and response‐adapted maintenance arms (PAd‐noCR and VCD‐noCR) of the study. For patients receiving lenalidomide for 2 years regardless of response, HLCr normalization was found to be marginally statistically significantly associated with better PFS in a multivariable Cox regression landmark analysis from the end of consolidation (HR 0.61, 95% CI 0.37–1.02, p = 0.06; Table S2). In contrast, no effect of HLC normalization on PFS was seen in patients receiving lenalidomide only when not achieving a CR after consolidation in multivariable Cox landmark analysis, as shown in Figure 2 (Table S3, HR 0.86, 95% CI 0.51–1.45, p = 0.58).
Progression‐free survival from end of consolidation stratified by normalization of HLCr in arms PAd‐CR/VCD‐CR (A) and in arms PAd‐noCR/VCD‐noCR (B).
Discussion
4
With increasingly effective treatment options in MM, response assessment must be improved to increase the sensitivity to detect lower disease burden. For IgG or IgA MM, immunofixation is still the gold standard [18], however there are often borderline results reported with the detection of faint bands of paraprotein. In these cases, the interpretation will be dependent on the investigator to be classified as positive or negative. Measuring total IgG or IgA may also be misleading since at diagnosis there is often an increase of the pathological Ig with a simultaneous depression of the corresponding polyclonal, normal Ig. In patients responding to therapy this is reversed and while the monoclonal Ig is reduced there may be recovery of the polyclonal Ig and thus the total level of IgG or IgA may not anymore reflect tumor burden.
It therefore seems attractive to separately assess the kappa and lambda portions of IgG or IgA and be able to calculate the ratio, similarly to the free light chain kappa/lambda ratio. This is the basis for the Hevylite assay, quantifying IgA or IgG in terms of kappa or lambda HLC usage. A study in 156 MM patients with IgG or IgA paraprotein showed a significantly better OS when responding patients also had a normal HLCr at the time of best response [13]. In a prospective study comparing autologous to allogeneic SCT in MM patients, normalization of all HLCr (IgG, IgA and IgM) before transplant was significantly related to PFS and OS in a multivariate analysis [19]. In the IFM2009 study HLC response was used to further stratify patients with either CR or VGPR after consolidation [14]. PFS in this analysis was significantly better when HLC response also was classified as CR based on the difference between the lambda and kappa HLC results.
With these heterogeneous results regarding the added value of HLC testing, we used the data from the prospective GMMG‐MM5 trial and performed HLC analyses on serum samples at different time points during treatment in the subgroup of patients with either IgG or IgA paraprotein. Using the normalization of the HLC kappa/lambda ratio as a time‐dependent covariate, we could not demonstrate a significant correlation with PFS or OS. In contrast the normalization of the FLC ratio showed a significant effect on PFS and OS, thus confirming our previous results for the total GMMG‐MM5 cohort in a subgroup of patients with only IgG or IgA paraprotein. We speculated that the longer half‐life of intact immunoglobulins may have caused these divergent effects and analyzed the impact of HLCr normalization at the end of consolidation therapy by landmark analysis. For the total study cohort there was no statistically significant impact of HLCr normalization on either PFS or OS. However, when separating the patients according to the two different maintenance strategies, there was a significant impact of HLCr normalization on PFS in patients randomized to continuous lenalidomide maintenance, while no such effect was found in the study arms with response‐adapted maintenance. This aligns with the notion that HLCr normalization may be more informative among patients who achieve deep responses such as CR, by further discriminating those with favorable outcomes. In contrast, in patients with less than CR, other adverse prognostic features may drive outcomes more strongly than HLC results.
This observation underscores that the prognostic significance of a given treatment response may vary considerably depending on the subsequent therapeutic strategy. Our results indicate that patients achieving an optimal HLC response derive the greatest benefit from continued lenalidomide maintenance. One possible explanation is that normalization of the HLC ratio reflects recovery of normal humoral immunity—analogous to polyclonal reconstitution observed on serum electrophoresis—which may enhance the immunomodulatory effects of lenalidomide in controlling multiple myeloma. Conversely, in patients who discontinued lenalidomide maintenance despite achieving complete remission (approximately 25% of patients in arms PAd‐noCR and VCD‐noCR), those with HLCr normalization may have received less cumulative lenalidomide exposure compared to patients in arms PAd‐CR and VCD‐CR. Meanwhile, patients without HLCr normalization in the same arms could have benefited from longer maintenance therapy, potentially offsetting the impact of a less favorable response through more intensive treatment.
However, while the Hevylite assay is providing separate quantification of the kappa and lambda portions of IgG or IgA paraproteins and despite the theoretical benefits of this approach, our data do not support its general use to assess treatment response to predict PFS or OS. While there may be reasons to use the Hevylite test in special situations in MM, better options for sensitive paraprotein quantification such as mass spectrometry (MS) are needed. MS has emerged as a more sensitive alternative, capable of detecting low levels of monoclonal proteins in peripheral blood. In the GMMG‐MM5 trial, MS proved feasible for response monitoring [20]. Kubicki et al. demonstrated that MS negativity post‐transplant correlates with longer PFS [21] while Puig et al. found that MS outperformed immunofixation in sensitivity and risk stratification [22]. Additionally, Lasa et al. reported that peripheral residual disease detected by next‐generation flow cytometry is associated with a significantly higher risk of progression or death, underscoring the potential of less invasive monitoring methods [23]. Another approach to quantify low levels of disease but avoiding the necessity to perform bone marrow aspiration is the analysis of cell‐free DNA from peripheral blood [24]. Nevertheless, Hevylite may still hold value in prospective studies by further stratifying outcomes within patients achieving deeper responses, even though this role is likely to be increasingly superseded by more sensitive MS‐ and NGS‐based MRD assays.
One caveat of our approach may be the way in which the HLC results were analyzed. While it appeared plausible to use the normalization of the kappa/lambda ratio similarly to FLC, other analyses may have yielded other results. One such example would be the use of FLC after CART therapy, where suppression of both kappa and lambda FLC—rather than FLC ratio normalization—was predictive of PFS and OS [25].
In summary our analysis of Hevylite assay results in patients with IgG or IgA MM from the GMMG‐MM5 study does not support the general use of HLC ratio normalization with the Hevylite assay as a response parameter for assessing the course of disease. However, the strikingly different results in relation to the different maintenance strategies may be of interest for the discussion of suitable response endpoints (e.g., MRD) to trigger response‐adapted treatment strategies.
Author Contributions
Conceptualization: Hartmut Goldschmidt, Marc Raab, Christof Scheid, Elias Mai, Hans Salwender. Methodology, formal analysis: Axel Benner, Diana Tichy, Kaya Miah. Patient recruiting: Helga Bernhard, Mathias Hänel, Igor‐Wolfgang Blau, Britta Besemer, Snjezana Janjetovic, Peter Brossart, Amelie Boquoi, Christian S. Michel, Hans Walter Lindemann, Peter Reimer, Hans Salwender, Dirk Hose, Anja Seckinger. Original draft preparation: Christof Scheid and Tim Richardson. Supervision: Hartmut Goldschmidt. Project administration: Ekaterina Menis. All authors have read and agreed to the published version of the manuscript.
Ethics Statement
The study was conducted according to the guidelines of the Declaration of Helsinki and approved by the local ethics committees of all participating centers (leading ethics committee University of Heidelberg AFmu‐119/2010).
Consent
Informed consent was obtained from all subjects involved in the study.
Conflicts of Interest
The authors declare no conflicts of interest.
Supporting information
Data S1: ejh70061‐sup‐0001‐supinfo.docx.
The reference list from the paper itself. Each links out to its DOI / PubMed record.
- 1F. Malard , P. Neri , N. J. Bahlis , et al., “Multiple Myeloma,” Nature Reviews Disease Primers 10, no. 1 (2024): 1–21, https://www.nature.com/articles/s 41572‐024‐00529‐7.10.1038/s 41572-024-00529-738937492 · doi ↗ · pubmed ↗
- 2B. Paiva , J. San‐Miguel , and H. Avet‐Loiseau , “MRD in Multiple Myeloma: Does CR Really Matter?,” Blood 140, no. 23 (2022): 2423–2428, 10.1182/blood.2022016170.35560160 · doi ↗ · pubmed ↗
- 3S. Gurmukh , X. Hongyan , and J. B. Roni , “Monoclonal Light Chains in Multiple Myeloma: The Sinister Immunoglobulin,” International Journal of Pathology and Clinical Research 8, no. 2 (2022): 134.
- 4C. L. H. Snozek , J. A. Katzmann , R. A. Kyle , et al., “Prognostic Value of the Serum Free Light Chain Ratio in Newly Diagnosed Myeloma: Proposed Incorporation Into the International Staging System,” Leukemia 22, no. 10 (2008): 1933–1937, https://www.nature.com/articles/leu 2008171.18596742 10.1038/leu.2008.171PMC 2614406 · doi ↗ · pubmed ↗
- 5S. Kumar , B. Paiva , K. C. Anderson , et al., “International Myeloma Working Group Consensus Criteria for Response and Minimal Residual Disease Assessment in Multiple Myeloma,” Lancet Oncology 17, no. 8 (2016): e 328–e 346.27511158 10.1016/S 1470-2045(16)30206-6 · doi ↗ · pubmed ↗
- 6T. Dejoie , J. Corre , H. Caillon , et al., “Serum Free Light Chains, Not Urine Specimens, Should Be Used to Evaluate Response in Light‐Chain Multiple Myeloma,” Blood 128, no. 25 (2016): 2941–2948, 10.1182/blood-2016-07-726778.27729323 PMC 5179336 · doi ↗ · pubmed ↗
- 7L. Lopez‐Anglada , C. Cueto‐Felgueroso , L. Rosiñol , et al., “Prognostic Utility of Serum Free Light Chain Ratios and Heavy‐Light Chain Ratios in Multiple Myeloma in Three PETHEMA/GEM Phase III Clinical Trials,” P Lo S One 13, no. 9 (2018): e 0203392, 10.1371/journal.pone.0203392.30192814 PMC 6128544 · doi ↗ · pubmed ↗
- 8E. M. Klein , D. Tichy , H. J. Salwender , et al., “Prognostic Impact of Serum Free Light Chain Ratio Normalization in Patients With Multiple Myeloma Treated Within the GMMG‐MM 5 Trial,” Cancers (Basel) 13, no. 19 (2021): 4856, https://www.mdpi.com/2072‐6694/13/19/4856/htm.34638344 10.3390/cancers 13194856 PMC 8507729 · doi ↗ · pubmed ↗