Association between body mass index and pain outcomes in elderly patients with chronic pain: A retrospective cohort study
Tamaki Aihara, Yusuke Nagamine, Masaki Kitahara, Takahisa Goto

TL;DR
This study found that low BMI in elderly patients with chronic pain is linked to higher pain catastrophizing scores, but BMI does not affect pain disability or treatment outcomes over time.
Contribution
The study is the first to explore the relationship between BMI and changes in pain outcomes over time in elderly chronic pain patients using mixed-effects models.
Findings
Low BMI group had significantly higher pain catastrophizing scores compared to other BMI groups.
No significant differences in pain disability scores or treatment-related changes over time based on BMI group.
Findings suggest BMI does not predict treatment outcomes in elderly chronic pain patients.
Abstract
The purpose of this study was to investigate the association between body mass index (BMI) and changes in pain scores among elderly patients with chronic pain. The pain disability assessment scale (PDAS) and the pain catastrophizing scale (PCS) were employed as assessment tools. A single-center, retrospective cohort study was conducted at a university hospital multidisciplinary pain center from 2017 to 2020, involving 180 patients aged ≥ 65 years with noncancer pain persisting for at least 3 months. Patients were classified into three groups according to BMI: low (BMI < 18.5), standard (18.5 ≤ BMI < 25), and high (BMI ≥ 25). Initial, 3-month, and 6-month PDAS and PCS scores were collected and analyzed using mixed-effects models. No significant differences were observed in PDAS scores across BMI groups. However, PCS scores were significantly higher in the low BMI group. Furthermore, no…
Genes, proteins, chemicals, diseases, species, mutations and cell lines named across the full text — each resolved to its canonical identifier and authoritative record.
Click any figure to enlarge with its caption.
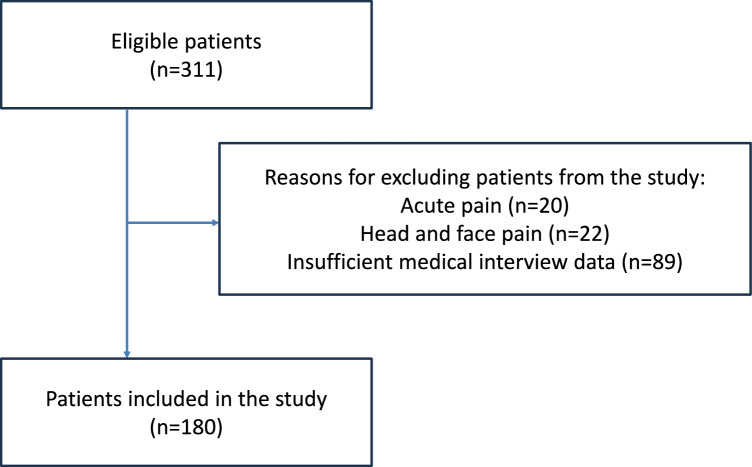 Figure 1
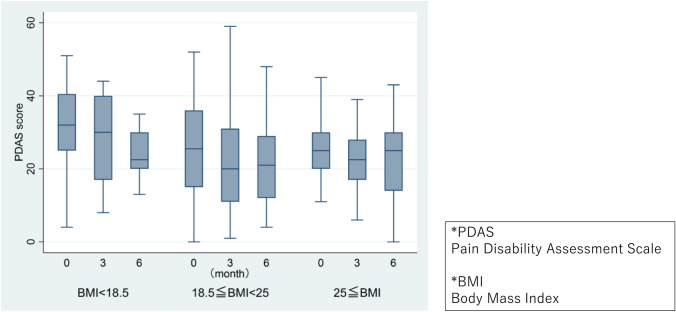 Figure 2
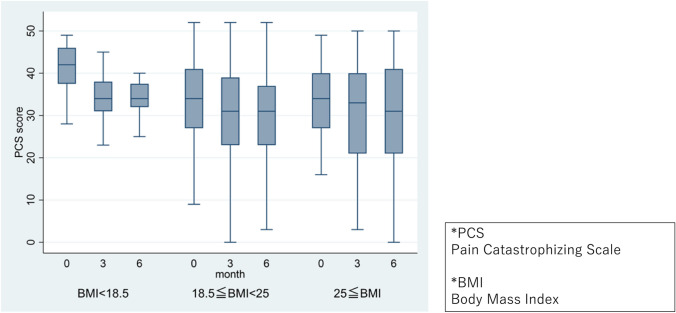 Figure 3
Peer Reviews
No public reviews on file for this paper yet. If you reviewed it on a platform where reviews are public (OpenReview, ICLR, NeurIPS, ICML), you can paste yours below so the community can read it here.
Videos
No videos yet. Explain this paper in a talk, walkthrough, or lecture? Add one.
Taxonomy
TopicsMusculoskeletal pain and rehabilitation · Fibromyalgia and Chronic Fatigue Syndrome Research · Pain Management and Opioid Use
Introduction
Chronic pain is a prevalent condition frequently encountered in elderly patients. One report indicated that 42.7% of the elderly population in Japan experiences some form of chronic pain [1]. The persistence of chronic pain in the elderly represents a critical issue that adversely affects quality of life and necessitates prolonged treatment, thereby consuming substantial medical resources.
Numerous studies have suggested an association between body weight and chronic pain. Research has identified obesity as a risk factor for various conditions, including low back pain, sciatica, and fibromyalgia [2–5]. In the context of post-herpetic neuralgia [6] and chronic widespread pain [7], both obesity and underweight have been documented as risk factors. A study examining the prevalence of chronic pain among Japanese men aged ≥ 50 years demonstrated a U-shaped relationship between chronic pain prevalence and BMI [8]. Additionally, a cross-sectional study involving elderly subjects reported that both obesity and underweight constitute risk factors for chronic pain [9].
Conversely, several studies investigating the efficacy of treatment for patients with fibromyalgia and chronic low back pain have reported no significant difference in treatment responses among normal weight, overweight, and obese patients [10, 11]. Some studies found less improvement in severely obese groups [12]. In the elderly, underweight status may pose a greater risk than obesity in terms of mortality and frailty [13]. Very few studies have quantitatively evaluated the effects of treatment on underweight patients. Consequently, a consensus on the relationship between treatment effects of chronic pain and BMI remains elusive.
In recent years, various scales have been employed in multidisciplinary pain management to quantitatively assess pain severity and treatment effectiveness. The pain disability assessment scale (PDAS) was developed in 1997 to evaluate physical movement and mobility in patients experiencing chronic pain [14, 15]. The Pain Catastrophizing Scale (PCS), developed by Sullivan et al. in 1995, is known to exhibit a strong correlation with pain severity [16]. This study aims to elucidate the relationship between BMI and changes in pain scores associated with multidisciplinary treatment among elderly patients with chronic pain, specifically utilizing the PDAS and PCS to evaluate physical and psychological aspects of pain, respectively, in this vulnerable population.
Methods
Design, setting, and patients
This was a single-center, retrospective cohort study conducted at a university hospital pain clinic, a multidisciplinary pain treatment center that primarily addresses chronic pain. Treatment plans are developed individually for each patient within the outpatient clinic setting. Patients are offered a combination of one or more of the treatment modalities, including the following: exercise therapy (providing basic exercise instructions by nurses and more individualized exercise therapy by physical therapists and occupational therapists, psychotherapy (cognitive-behavioral therapy by clinical psychologists, counseling, progressive muscle relaxation, etc.), pharmacological interventions, social interventions (e.g., new applications for long-term care insurance), nutritional guidance, acupuncture and moxibustion (administered by a dedicated acupuncturist), intramuscular stimulation, nerve blocks, and concurrent consultations with other departments.
Following were the inclusion criteria: (i) patients aged ≥ 65 years; (ii) those who attended the pain clinic between April 2017 and March 2020; (iii) those who presented with noncancer pain that persisted for at least 3 months; and (iv) those capable of participating in at least two medical interviews. Exclusion criteria encompassed patients with pain localized to the head and neck, cancer pain, acute postoperative pain, and those with incomplete interview data (lacking initial visit data or data from the third or sixth month).
Exposure
BMI at the initial visit was calculated using height and weight measurements recorded by the nursing staff. BMI was categorized according to World Health Organization (WHO) standards[17]: low BMI group (BMI < 18.5), standard BMI group (18.5 ≤ BMI < 25), and high BMI group (BMI ≥ 25).
Outcome
The primary outcomes comprised PDAS and PCS scores and their trends over time. PDAS and PCS scores were collected using medical interviews.
The PDAS is a self-administered questionnaire developed in Japan, consisting of 20 questions addressing daily physical movement and mobility on a 4-point scale. The questions include activities such as (Since an official English version of PDAS is not available, the following items have been translated by the authors for reference.) “climbing stairs,” “washing hair,” and “bending to pick up objects from the floor.” Each item is scored as follows: “No difficulty at all”: 0 points, “Slight difficulty”: 1 point, “Considerable difficulty”: 2 points, “Unable to perform due to severe pain”: 3 points. This method quantifies the degree of disability in daily activities, with higher scores indicating greater impairment. The PDAS yields a maximum score of 60 and a minimum of 0, with a cutoff value of 10 points. It does not assess pain localized to the head. Previous research has established that the minimal important difference (MID), corresponding to -2 on the numerical rating scale (NRS) for low back pain, is 6.71.
The PCS is also a self-administered questionnaire that measures the extent of pain-induced catastrophic thinking, comprising three subscales: rumination, magnification, and helplessness. The PCS consists of 13 items, such as “I worry all the time about whether the pain will end” and “I feel I can’t go on,” rated on a 5-point scale from “Not at all” (0 points) to “At all times” (4 points). Higher scores indicate increased catastrophic thinking. The PCS yields a maximum score of 52 and a minimum of 0, with a cutoff value of 30 points. Prior studies have indicated that the MID is 6.48, corresponding to -2 on the NRS for low back pain.
PDAS and PCS scores were collected during outpatient visits using a tablet computer, where patients entered their responses, and the scores were automatically calculated. For patients with visual impairments or those who had difficulty operating the tablet computer due to age, family members or administrative staff assisted in entering the responses.
Covariates
Potential confounding variables included age, sex, charlson comorbidity index (CCI) [18], and mini mental state examination (MMSE) [19, 20]. As potential confounding factors that influence both exposure (BMI) and outcomes (PDAS and PCS), age, sex, physical comorbidities, and cognitive function were included. The CCI was used to evaluate physical comorbidities, and MMSE was used to evaluate cognitive function.
Statistical analysis
The results were expressed as median (interquartile range [IQR]) or as numbers (%). A linear mixed-effects model was performed with individual patients as random intercepts. Fixed effects included the BMI category, the time point (month), and the interaction between the BMI category and time point (month), age, sex, CCI, and MMSE. Missing values were not imputed. Statistical analyses were performed using STATA version 17.0 (StataCorp, Texas, USA), with statistical significance set at a p-value of < 0.05.
Ethical considerations
This study was approved by the ethics committee of the Yokohama City University Medical Center (approval number: B210500052, approval date: June 04, 2021, chairman: Shin Maeda). The requirement for informed consent was waived by the ethics committee. The opportunity to withdraw consent was communicated through a notice on the institution's website. All methods adhered to the principles outlined in the Declaration of Helsinki.
Results
Among 311 patients aged 65 years or older who visited the outpatient clinic from 2017 to 2020, 20 patients with acute pain, 22 patients with pain confined to the head and neck, and 89 patients with insufficient interview data were excluded, resulting in a final analysis of 180 patients (Fig. 1).Fig. 1. Study flow chart
The characteristics of subjects in each group are detailed in Table 1. Among the 180 patients, 108 (60%) were female, with a median age of 74.7 years and a median BMI of 22.9. The distribution of patients and median BMI across BMI groups was as follows: 16 (8.9%) in the low BMI group (median BMI: 17.0), 114 (63.3%) in the standard BMI group (median BMI: 22.1), and 50 (27.8%) in the high BMI group (median BMI: 27.1).Table 1. Baseline characteristics of the study populationAllBMI < 18.5BMI ≥ 18.5 and < 25BMI ≥ 25Number of patients18016(8.9)114(63.3)50(27.8)Age (in years)74.7[69.5–78.6]76.3[74.2–78.8]75.5[68.5–79.2]71.3[68.5–75.1]Male sex (%)72 (40.0)3(18.8)44(38.6)25(50.0)BMI (kg/m^2^)22.9[20.9–25.4]17.0[10.1–18.1]22.1[20.9–23.5]27.1[26.1–28.4]Diagnosis Myofascial pain51(28.3)1(6.3)37 (32.5)13 (26) Osteoarthritis32(17.8)0(0)15 (13.2)17 (34) Disuse syndrome16(8.9)5(31.3)8 (7)3 (6) Chronic postoperative pain16(8.9)1(6.3)9 (7.9)6 (12) Postherpetic neuralgia15(8.3)3(18.8)10 (8.8)2 (4) Peripheral neuropathy10(5.6)1(6.3)7 (6.1)2 (4) Cervical spondylosis5(2.8)0(0)5 (4.4)0 (0) Vertebral compression fracture5(2.8)1(6.3)3 (2.6)1 (2) Unclassifiable arthralgia5(2.8)0(0)3 (2.6)2 (4) Unclassifiable low back pain3(1.7)0(0)2 (1.8)1 (2) Lumbar spondylolisthesis or Spinal canal stenosis2(1.1)0(0)2 (1.8)0 (0) Periarthritis of the shoulder1(0.6)0(0)1 (0.9)0 (0) Other19(10.6)4(25.0)12 (10.5)3 (6)Pain site Cervical region, shoulder, and upper limbs19(10.6)2 (12.5)14 (12.3)3 (6) Thoracoabdominal region14(7.8)1 (6.3)13 (11.4)0 (0) Back, Lumbar26(52)3 (18.8)14 (12.3)9 (18) Gluteal regions, Lower limbs111(61.7)9 (56.3)66 (57.9)36 (72) Whole body10(5.6)1 (6.3)7 (6.1)2 (4) CCI scores1[0–2]1[0–2]1[0–2]1[0–2] MMSE scores28[26–29]27[25–29]28[26–29]28.5[27–29]History of alcohol consumption None91(50.6)10(62.5)61(53.5)20(40.0) Past drinker19(10.6)3(18.8)13(11.4)3(6.0) ≤ 2 per week34(18.9)1(6.3)19(16.7)14(28.0) ≥ 3 per week36(20.0)2(12.5)21(18.4)13(26.0)History of smoking None124(68.9)13(81.3)80(70.2)31(62.0) Past smoker49(27.2)1(6.3)31(27.2)17(34.0) Current smoker7(3.9)2(12.5)3(2.6)2(4.0)Japanese long-term care insurance care-need level None144(80.0)12(75.0)90(79.0)42(84.0) Support level 19(5.0)0(0.0)6(5.3)3(6.0) Support level 211(6.1)2(12.5)6(5.3)3(6.0) Care-need level 18(4.4)1(6.3)5(4.4)2(4.0) Care-need level 26(3.3)1(6.3)5(4.4)0(0.0) Care-need level 32(1.1)0(0.0)2(1.8)0(0.0) Care-need level 4, 50(0.0)0(0.0)0(0.0)0(0.0)PDAS Score at initial visit26[18–35]32[25–40.5]25.5[15–36]25[20–30] Score at 3 months21[13–31]30[17–40]20[11–31]22.5[17–28] Score at 6 months22[13–30]22.5[20–30]21[12–29]25[14–30]PCS Score at initial visit34.5[27.5–41.5]42[37.5–46]34[27–41]34[27–40] Score at 3 months32[23–39]34[31–38]31[23–39]33[21–40] Score at 6 months31[22–40]34[32–37.5]31[23–37]31[21–41]Intervention Pharmacotherapy144(80.0)15(93.8)85(74.6)44(88.0) Exercise remedy137(76.1)11(68.8)88(71.2)38(76.0) Psychotherapy9(5.0)1(6.3)6(5.3)2(4.0) Consultation with other departments52(28.9)6(37.5)32(28.1)14(28.0) Acupuncture or intramuscular stimulation27(15.0)3(18.8)17(14.9)7(14.0) Nerve block3(1.7)0(0.0)2(1.8)1(2.0) Nutrition counseling11(6.1)1(6.3)3(2.6)7(14.0)Values are presented as median [interquartile range] or as numbers (%)BMI body mass index, CCI charlson comorbidity index, MMSE mini mental state examination, PDAS pain disability assessment scale, PCS pain catastrophizing scaleJapanese long-term care insurance (LTCI) care need level is determined by the nursing care needs certification board. There are seven levels of LTCI need certificates according to the total daily estimated care minutes (support levels 1–2, care need levels 1–5) [35, 36]
Changes in PDAS scores over time by BMI group are illustrated in Fig. 2.Fig. 2. Change in PDAS scores over time per BMI group. PDAS pain disability assessment scale, BMI body mass index
Analysis via mixed-effects modeling revealed significant reductions in PDAS scores at 3 and 6 months relative to the initial visit. No significant differences were observed in PDAS scores between BMI groups, and no significant differences were noted between BMI category and time point (month). Age was associated with significantly higher PDAS scores, whereas being male correlated with significantly lower scores; additionally, MMSE scores were associated with significantly higher PDAS scores (Table 2).Table 2. Mixed effects model for PDASCoefficientP value95% confidence intervalsTime point (Month) 3 months−3.40 < 0.001−5.04−1.77 6 months−2.700.006−4.64−0.76BMI < 18.53.810.203−2.069.69 ≥ 252.330.267−1.786.44Confounding factor Age0.370.0090.090.65 Male sex−4.660.005−7.94−1.38 CCI score0.100.827−0.770.97 MMSE score−1.49 < 0.001−2.22−0.75Interaction: “month × BMI group” “3 months” × “BMI < 18.5”1.170.612−3.375.71 “3 months” × “BMI ≥ 25”1.610.314−1.524.74 “6 months” × “BMI < 18.5”2.100.463−3.517.72 “6 months” × “BMI ≥ 25”2.540.150−0.926.01BMI body mass index, CCI charlson comorbidity index, MMSE mini mental state examination, PDAS pain disability assessment scale
Variations in PCS scores across time by BMI group are depicted in Fig. 3. Mixed-effects model analysis indicated significant reductions in PCS scores at 3 and 6 months compared to the initial visit, with the low BMI group displaying significantly higher PCS scores. No significant differences were identified in PCS scores regarding the interaction between BMI category and time point (month). Across all variables, MMSE scores were significantly associated with increased PCS scores (Table 3).Fig. 3. Change in PCS scores over time per BMI group. PCS Pain catastrophizing scale, BMI body mass indexTable 3Mixed effects model for PCSCoefficientP value95% confidence intervalsTime point (Month) 3 months−3.79 < 0.001−5.52−2.06 6 months−3.78 < 0.001−5.82−1.74BMI < 18.56.590.0220.9512.22 ≥ 250.530.794−3.414.47Confounding factor Age−0.020.908−0.280.25 Male sex−0.320.839−3.402.76 CCI score−0.360.380−1.180.45 MMSE score−0.910.010−1.60−0.22Interaction: “month × BMI group” “3 months” × “BMI < 18.5”−3.050.210−7.831.72 “3 months” × “BMI ≥ 25”1.340.426−1.964.64 “6 months” × “BMI < 18.5”−2.330.439−8.223.57 “6 months” × “BMI ≥ 25”1.980.287−1.665.62BMI body mass index, CCI charlson comorbidity index, MMSE mini mental state examination, PCS pain catastrophizing scale
Subgroup analyses were performed for treatment interventions, including exercise remedy and pharmacotherapy. However, due to the small number of participants, subgroup analyses were not performed for acupuncture and psychotherapy. The results are presented in Supplementary Tables 1–4. The overall trend for PDAS remained largely unchanged. For PCS, the association with BMI was not statistically significant in the pharmacotherapy ( +) subgroup. In the exercise remedy ( +) subgroup, low BMI showed a statistically significant association with PCS scores.
The results from the mixed-effects model analyses for each PCS subscale are presented in Supplementary Tables 5–7. The helplessness subscale manifested significantly higher scores in the low BMI group, while no significant differences were identified among other PCS subscales across BMI groups. Among PCS subscales, only the catastrophizing component showed a significant decrease in the interaction of “3 months” × “BMI < 18.5.”
Discussion
This study evaluated the interplay between BMI and various pain-related outcomes in elderly individuals living with chronic pain. The analysis of PDAS and PCS scores of elderly patients with chronic pain indicated significant reductions in both scores at 3 and 6 months compared to the initial visit. Notably, the low BMI group exhibited significantly higher PCS scores. No significant differences were discerned in PDAS and PCS scores regarding the interaction between BMI category and time point (month).
The PDAS serves as an index for evaluating the ability to perform physical activities of daily living [14]. It constitutes a subjective assessment reflecting four stages, with the content of the interview based on the Cardiovascular Health Study criteria, which are the diagnostic criteria for frailty [21]. The questionnaire content overlaps with that of the CHS criteria for the diagnosis of frailty (including weight loss, muscle strength, fatigue, walking speed, and physical activity). Therefore, PDAS scores in the elderly may reflect not only pain but also frailty. To ensure an accurate evaluation of PDAS, it is crucial to consider the impact of frailty, potentially confounding its interpretation as a pain-specific measure. However, a significant limitation of this study is that we could not quantitatively evaluate frailty, making it challenging to isolate pain-related impairment from broader physical decline. A prior study involving more than 7,000 elderly individuals in Japan highlighted a U-shaped correlation between BMI and frailty [22]. In addition, individual differences in body composition may have influenced the results; individuals with similar BMI may present varying PDAS scores contingent upon their muscle mass and fat mass, particularly resulting in greater score variability within the high BMI group. Age was significantly associated with higher PDAS scores, which may indirectly indicate a relation between older age and frailty.
In the present study, PDAS scores were lower in men. Women are more likely to have functional impairment due to muscle weakness in old age [23]. Previous studies on spinal disease have identified male sex as a predictor of lower PDAS scores [24], which aligns with the findings of the present study. The results also indicated a significant association between declining MMSE scores and lower PDAS scores. Certain PDAS inquiries, such as “visiting friends,” “riding the bus or train,” “engaging in hobby activities,” and “cooking,” are difficult to answer unless cognitive function is preserved to some degree.
To the best of our knowledge, no reports have, to date, analyzed the relationship between PCS and weight loss or appetite loss. A prior study examining BMI and personality tendencies [25] reported that the underweight group exhibited heightened neurotic tendencies and more pronounced anxiety, anger, and depressive tendencies. This suggests that neurotic personality tendencies may underlie the association between low body weight and catastrophic thinking observed in this study, warranting further investigation. PCS scores have been found to be positively correlated with the geriatric depression scale (GDS) scores, which assesses depression in old age [26]. Depression is one of the major causes of anorexia in the elderly [27]. Elevated corticotropin-releasing factor (CRF) in depression leads to anorexia [28], and elderly patients with depression demonstrate dysregulation of the hypothalamic–pituitary–adrenal axis compared to younger patients [29]. Conversely, chronic undernutrition has been associated with an increased risk of depression [30]. This implies a close relationship between catastrophic thinking, loss of appetite, eating disorders, weight loss, and depressive symptoms. However, a significant limitation of this study is the lack of direct GDS measurements, making it difficult to objectively assess depressive symptoms in relation to PCS. Future research incorporating validated depression scales is warranted for a more robust assessment of the relationship between depression and PCS scores in elderly individuals.
MMSE was found to be significantly associated with low PCS scores in this study. Existing literature indicates that MMSE scores in patients with chronic pain fall below the cutoff for mild cognitive impairment (MMSE < 27) [31]. Herein, both PDAS and PCS scores were significantly associated with MMSE, corroborating previous findings. Reports suggest a correlation between cognitive decline and decreased pain tolerance [32], while another study conducted at a Japanese elderly care facility found that patients in the low MMSE group tended to overestimate their pain [33]; therefore, the results of this study may be related to similar mechanisms.
This investigation employed non-invasive, low-cost measures, such as height, weight, and questionnaires, to explore physical and psychological trends in pain severity. Specifically, findings revealed that elderly individuals with low BMI demonstrated stronger catastrophic thinking. This underscores the potential importance of maintaining an appropriate weight in older age [13, 34]. Furthermore, it emphasizes the necessity of addressing nutritional status and body composition in multidisciplinary chronic pain treatment approaches. Future research may yield additional insights by assessing the effectiveness of nutritional interventions in mitigating catastrophic thinking.
Several limitations warrant consideration in this study. The first pertains to selection bias; our department operates as a multidisciplinary pain center within a university hospital, functioning as a referral-only facility. Patients treated in this setting may differ significantly from primary care patients and the broader elderly community, as they often seek treatment after inadequate responses to previous medical care. Second, the analysis did not include the content of the treatment analysis; multidisciplinary treatment is personalized and varies greatly among individuals. Third, categorization of chronic pain sites and pain mechanisms was not strictly performed; this study included all chronic pain, excluding only head and neck pain. Moreover, many patients presented with pain in multiple locations or with generalized pain, leading to challenges in strictly classifying patients based on pain types. Fourth, although weight and MMSE were measured at the initial visit, changes over 3 and 6 months were not accounted for, suggesting the potential for further insights by incorporating these items in future long-term follow-ups.
In conclusion, among elderly patients with chronic pain, the low BMI group displayed significantly higher PCS scores, while PDAS scores did not differ across BMI groups. Additionally, no differences emerged in treatment-related changes over time based on BMI group.
Supplementary Information
Below is the link to the electronic supplementary material.Supplementary file1 (DOCX 32 KB)
The reference list from the paper itself. Each links out to its DOI / PubMed record.
- 1Body mass index among adults. https://www.who.int/data/gho/data/themes/topics/indicator-groups/indicator-group-details/GHO/bmi-among-adults Accessed