Gadolinium- and water-based blood-brain barrier dysfunction measures in patients with sporadic small vessel disease
Michael S Stringer, Xingfeng Shao, Hedok Lee, Antoine Vallatos, Carmen Arteaga-Reyes, Una Clancy, Francesca Chappell, Cameron Manning, Maria Valdes-Hernandez, Daniela Jaime Garcia, Rosalind Brown, Fergus N Doubal, Helene Benveniste, Michael J Thrippleton, Danny JJ Wang

TL;DR
The study found that water exchange rates measured without contrast agents may detect subtle blood-brain barrier issues in patients with small vessel disease.
Contribution
This work introduces water exchange rate as a potential non-contrast method to assess blood-brain barrier dysfunction in sporadic small vessel disease.
Findings
Higher water exchange rates correlated with increased small vessel disease burden and progression.
Water exchange rate measurements showed no strong association with traditional gadolinium-based contrast metrics.
The findings suggest water exchange rate could be a sensitive indicator of subtle blood-brain barrier changes.
Abstract
•Worse sporadic small vessel disease (SVD) burden linked to higher water exchange.•1-year small vessel disease increase also associated with higher water exchange.•Water exchange rate was sensitive to subtle blood-brain barrier changes in SVD. Worse sporadic small vessel disease (SVD) burden linked to higher water exchange. 1-year small vessel disease increase also associated with higher water exchange. Water exchange rate was sensitive to subtle blood-brain barrier changes in SVD. Subtle blood-brain barrier (BBB) leakage has been detected in small vessel disease (SVD). While established methods rely on gadolinium-based contrast agents (GBCA), diffusion-weighted arterial spin labelling (DW-ASL) is a promising alternative which assesses water exchange rate (kw) without injected contrast. However, DW-ASL has not been widely applied in sporadic SVD. We aimed to determine how kw varied…
Genes, proteins, chemicals, diseases, species, mutations and cell lines named across the full text — each resolved to its canonical identifier and authoritative record.
Click any figure to enlarge with its caption.
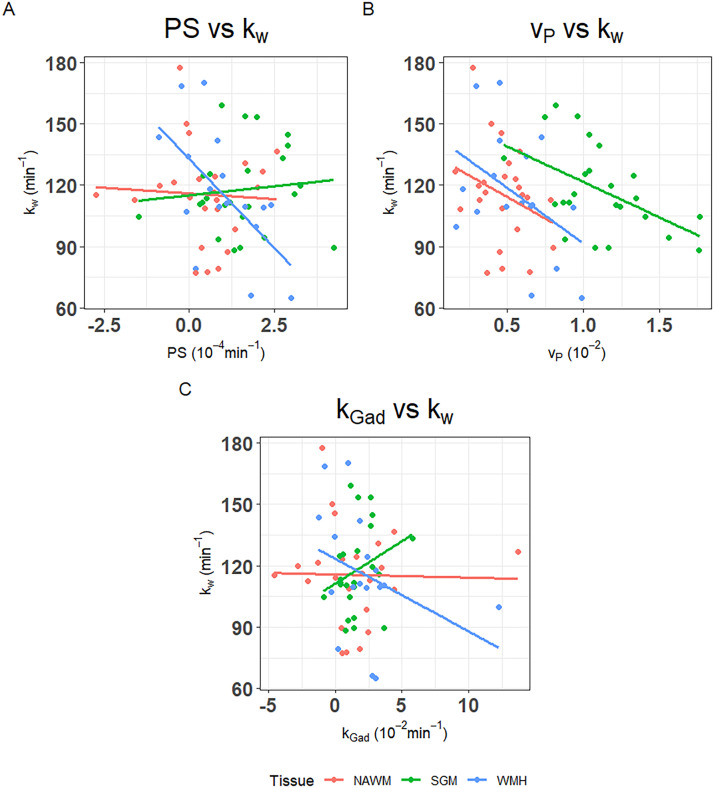 Figure 1
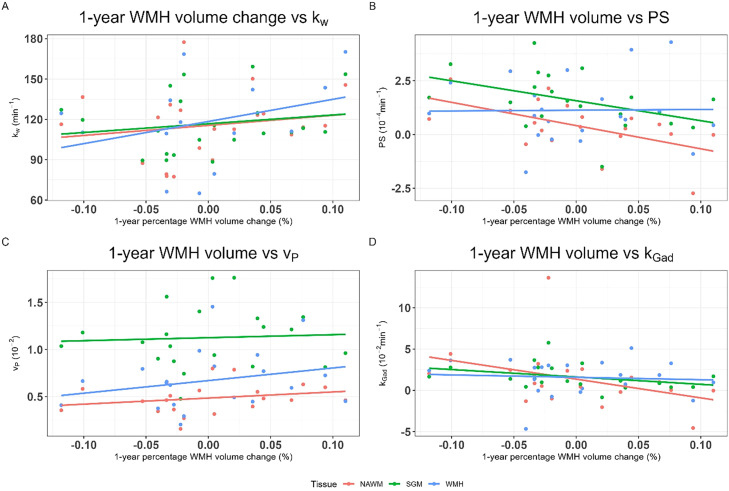 Figure 2
Peer Reviews
No public reviews on file for this paper yet. If you reviewed it on a platform where reviews are public (OpenReview, ICLR, NeurIPS, ICML), you can paste yours below so the community can read it here.
Videos
No videos yet. Explain this paper in a talk, walkthrough, or lecture? Add one.
Taxonomy
TopicsAdvanced MRI Techniques and Applications · Lanthanide and Transition Metal Complexes · MRI in cancer diagnosis
Introduction
Cerebral small vessel diseases (SVDs) cause one quarter of ischaemic strokes and up to a half of dementias, either vascular or mixed, typically begins covertly and increases with age, often being identified incidentally [1]. However, symptom presentation can be broad, including cognitive impairment, problems with mobility or altered mood [2].
The pathophysiology of SVD remains poorly understood, though blood-brain barrier (BBB) dysfunction is thought to play an important role [1]. Brain damage may be caused by several BBB dysfunction components, including impaired endothelial cell dysfunction, fluid, protein and fibrinogen leakage into the walls of blood vessels leading to aberrant thickening and stiffening of arteriole walls, impairing vasoreactivity, oxygen and nutrient transport, perivascular oedema and neuroinflammation [1,3]. While subtly increased with normal ageing [4], BBB leakage is higher in patients with Alzheimer’s disease, worse in patients with SVD who have higher white matter hyperintensity (WMH) burden [3,5]. and steeper post-stroke cognitive decline [6].
In vivo BBB leakage can be evaluated using MRI [3]. Dynamic-contrast enhanced MRI (DCE-MRI), which tracks T1-weighted signal enhancement over time following intravenous injection of a Gd-based contrast agent (GBCA), is the most widely used approach. Using pharmacokinetic models, BBB leakage can be quantitatively assessed [7]. In populations with subtle BBB leakage, the Patlak model, which assesses the permeability-surface area product (PS) and blood plasma volume fraction (v_P_), is favoured [3,8]. However, intravenous injection is required, compromised kidney function is a contraindication, and concerns about possible damage due to Gd retention limits has increased resistance to repeated scanning and the large contrast agent molecular size limits sensitivity [3,9]. Therefore, several techniques using water as an endogenous contrast agent have been developed, including diffusion-weighted arterial spin labelling (DW-ASL) which proposes to measure the water exchange rate (k_w_) across the microvessel wall [10]. However, findings in studies relevant to SVD have varied. In previous work, higher whole brain k_w_ correlated with higher Fazekas scores in community dwelling older subjects [9], but, relative to age- and sex-matched controls, k_w_ was lower in genetic forms of SVD which have a severe SVD lesions (e.g. Cerebral Autosomal Dominant Arteriopathy with Subcortical Infarcts and Leukoencephalopathy (CADASIL) and high‐temperature requirement factor A serine peptidase 1 (HTRA1)‐related SVD) [11]. Lower k_w_ was associated with worse cognitive function in genetic SVD and across the Alzheimer’s disease continuum [12], and lower CSF Aβ42 concentrations [13]. However, DW-ASL has not been widely applied in patients with stroke-related SVD e.g. lacunar stroke or in non-genetic forms of WMHs [14] and no studies have assessed longitudinal associations prospectively [15,16]. Moreover, to our knowledge, only 2 studies have contemporaneously assessed k_w_ and GBCA BBB leakage, finding limited region-dependent associations, likely as water and GBCA transport mechanisms differ, but only one assessed symptomatic sporadic SVD patients [14].
Here we compared DW-ASL and DCE-MRI measures of BBB function in the same participants in a prospective, longitudinal study of well-characterised patients with symptomatic SVD. We assessed associations between water exchange and age, SVD burden and 1-year change. We hypothesised that k_w_ and PS would have limited inter-associations but would independently associate with WMH volume and 1-year change.
Methods
Participants and study procedure
As previously described in our published protocol [17], we prospectively recruited patients with mild ischaemic stroke (defined as modified NIH Stroke Secale [NIHSS] <8 and expected to be non-disabling i.e. modified Rankin Score [mRS]≤2) presenting at Edinburgh/Lothian stroke services, United Kingdom (Mild Stroke Study 3, ISRCTN:12113543). Stroke diagnosis and subtype was determined by specialist stroke physicians and neuroradiologists. In the parent study, we included patients with lacunar ischaemic stroke (clinically symptomatic SVD) and cortical ischaemic stroke, as controls for having a stroke, common risk factors, and usual medications. The inclusion of cortical ischaemic stroke also allowed us to include a broader range of SVD features. Detailed inclusion and exclusion criteria and study procedures have been previously published [17]. In brief, we excluded patients with contraindications to MRI, other major neurological conditions, and severe cardiac and respiratory diseases. Data can be made available upon reasonable request to the senior author (J.M.W.).
We invited patients within 1-3 months of stroke onset to avoid acute effects of the infarct on BBB leakage. We assessed stroke severity (NIHSS) and a medical history, including vascular risk factors, was taken by a medical doctor (U.C./C.A.R) overseen by one expert consultant stroke physician (F.D.). We measured blood pressure and acquired brain MRI scans for each patient.
Brain MRI acquisition
At baseline, we scanned all participants on a 3 T MRI scanner (MAGNETOM Prisma, Siemens Healthcare, Erlangen, Germany). The full image acquisition protocol has been previously described [17]. In brief, we acquired:
- •Structural images to assess SVD burden (3D T1-weighted, T2-weighted, FLAIR, susceptibility weighted imaging (SWI) and diffusion MRI)
- •Quantitative T1 (qT1) mapping (two inversion recovery (IR-) spoiled gradient recalled echo (SPGR): TR/TE/TI=1040/1.82/600 and 1940/1.82/1500 ms, FA=5°; three SPGR: TR/TE = 5.4/1.82 ms, FA = 2/5/12°, acquisition matrix 160 × 200 × 160, 1.2-mm isotropic)
- •DCE-MRI (32 consecutive SPGR volumes during intravenous injection of 0.1 mmol/kg body weight gadobutrol (1M Gadovist, Bayer AG, Leverkusen, Germany) using a power injector; TR/TE = 3.4/1.7 ms, FA = 15°, acquisition matrix size 120 × 96 × 96, 2-mm isotropic)
Additionally, for this exploratory pilot study, in a subset of consecutive patients and prior to gadolinium-based contrast agent (GBCA) injection, we acquired a diffusion-prepared pseudocontinuous arterial spin labelling (DP-pCASL) sequence (TR/TE=4000/36.5 ms, FA=120°, acquisition matrix=64 × 64, 12 axial slices (10% oversampling), 3.5 × 3.5 × 8 mm^3^ resolution, label/control durations=1500 ms, post-labelling delay (PLD)=900 and 1800 ms and b=0 and 50 s/mm^2^ for the PLD=1800 ms scan) [9].
After one-year, all patients returned for a follow-up visit which included repeat structural imaging using the same 3T MRI scanner and imaging protocol (3D T1-w, T2-w, FLAIR, SWI, diffusion MRI and qT1) as at baseline.
Structural MRI analysis
We performed all analyses of structural scans blinded to clinical information and BBB dysfunction measures. Trained raters visually assessed all structural MRI scans for index and incident infarcts and key SVD features under supervision of an experienced neuroradiologist using the STRIVE-1 criteria including deep and periventricular WMH severity using the Fazekas score, basal ganglia and centrum semiovale perivascular space score, number of lacunes and microbleeds [18].
For computational analyses, we registered all structural images to the baseline T2-w scan using FSL-FLIRT (FMRIB Software Library, FMRIB Analysis Group, Oxford, United Kingdom) [19]. Using previously described computational methods, highly validated for use in stroke and other SVD-related populations, we segmented WMH on the registered FLAIR image [20]. We generated a brain mask based on the coregistered T1-w, T2-w and FLAIR images. We segmented subcortical grey (SGM) and whole-brain normal-appearing white matter (NAWM) using an in-house pipeline combining FreeSurfer and FSL-FAST outputs [20]. One researcher, supervised by an expert neuroradiologist, manually segmented acute index stroke lesions and subsequent incident infarcts based on the registered FLAIR image. We excluded the manually segmented stroke lesions from the tissue masks, checked and manually corrected all masks as necessary [17]. We calculated percentage white matter volume normalised to intracranial volume (ICV).
DCE-MRI processing
We processed the quantitative T1 and DCE-MRI data in MATLAB (MathWorks, MA, USA) using in-house code as previously described [21] and following consensus recommendations [3]. We measured pre-contrast T1 maps using the DESPOT1-HIFI method [22], correcting flip angle error voxelwise [23]. For the DCE-MRI, we manually determined a patient-specific venous input function by selecting five voxels in the superior sagittal sinus and calculating the mean signal time-course. We calculated signal enhancement timecourses relative to the mean pre-contrast signal using the median signal within each tissue mask [21]. We calculated SGM, NAWM and WMH permeability surface area product (PS) and blood plasma volume (v_P_) from the median tissue enhancement timecourses using an unconstrained multiple linear regression implementation of the Patlak model [21,24]. For comparability and to attempt to partially correct for differences in vascularity, we computed the exchange rate of GBCA (k_Gad_) as the ratio between PS and v_P_ [9].
DW-ASL processing
We used a two-stage approach to measure arterial transit time (ATT) and water exchange rate (k_w_) [25]. We calculated k_w_ using a total-generalized variation regularized single-pass-approximation model from scans acquired at PLD=1,800 ms with b=0 and 50 s/mm^2^, intended to separate the intra- and extra-vascular compartments, respectively [9].
Statistics
We performed all statistical analyses in R (v4.2.3, https://cran.r-project.org) and reported all data for all available participants. We calculated summary statistics as the mean ± standard deviation.
We assessed differences between tissue types in k_w_, PS, v_P_ and k_Gad_ using 1-way paired ANOVAs. Where we found meaningful differences, we used paired 2-sample t-tests to compare how SGM and WMH differed relative to NAWM.
We investigated associations between k_w_ and PS, v_P_ and k_Gad_ (PS/v_P_) in separate models using univariate and multiple variable linear regression adjusted for age and percentage WMH volume (as a marker of SVD burden).
We evaluated whether SGM, NAWM and WMH k_w_, PS, v_P_ and k_Gad_ differed with percentage WMH volume using separate multiple linear regression for each tissue type and BBB variable adjusted for age.
Finally, we assessed associations between 1-year change in percentage WMH volume (outcome) and k_w_, PS, v_P_ and k_Gad_ in separate multiple linear regression models adjusted for baseline WMH volume and age.
For all analyses, we checked underlying statistical assumptions, including checking for collinearity using variance inflation factors. We scaled PS (x10,000) and v_P_ (x100) for range consistency with other variables. We reported all linear regressions as unstandardised coefficients (B), 95% confidence intervals and p-value. Consistent with the American Statistical Society’s Statement on p-value [26,27], we interpreted relationships between variables based on the point estimate directions of effect, confidence interval breadth and existing clinical knowledge rather than only p-values. As this is an exploratory analysis, we did not apply any correction for multiple comparisons.
Results
We recruited 26 patients. All patients had complete processable baseline structural and DCE-MRI scans, but two DW-ASL scans failed. At 1-year follow-up, 22 of the 24 patients had structural MRI data (1: claustrophobia, 1 unable to attend).
The remaining 24 patients had a mean age of 61±10 years, and 71% were male, 71% had hypertension, 67% hypercholesterolaemia, 17 % diabetes, 12% atrial fibrillation and 50% were current/ex-smokers (Table 1). Participants had a mean percentage WMH/ICV volume of 0.72±0.66%.Table 1. Patient demographic and clinical variables. Categorical variables are given as number (percentage) with diagnostic variables coded as 1 and 0 for diagnosed/not diagnosed. Continuous numeric variables are quoted as mean ± standard deviation (SD), Fazekas score as median ± interquartile range (WMH=white matter hyperintensity).Table 1 dummy alt textTotal (N=24)Sex Male17 (71 %) Female7 (29 %)Age (years) Mean ± SD61 ± 10Stroke Subtype Lacunar13 Cortical11Systolic BP (mmHg) Mean ± SD148 ± 23NIHSS score at baseline Mean ± SD0.79 ± 0.66Hypertension No7 (29 %) Yes17 (71 %)Diabetes No20 (83 %) Yes4 (17 %)Atrial Fibrillation No21 (88 %) Yes3 (12 %)Hypercholesterolaemia No8 (33 %) Yes16 (67 %)Smoking History Never12 (50 %) Current/Ex12 (50 %)Fazekas score4 (3-6)Percentage WMH volume (%) Baseline Mean ± SD0.743 ± 0.661 1-year^a^ Mean ± SD0.749 ± 0.680a) n=22, 2 participants did not have 1-year follow-up scans (n=1, claustrophobia; n=1, unable to attend).
We did not find measurable differences between tissues (SGM, NAWM or WMH) in k_w_ (F=0.06, p=0.94) or k_Gad_ (F=0.28, p=0.76). However, PS and v_P_ in NAWM tended lower relative to SGM (PS: t=-3.24, p=0.002; v_P_: t=-8.91, p<0.001) and WMH (PS: t=-1.86, p=0.07; v_P_: t=-2.36, p=0.02). Table 2 and Figure S1 show mean values and distribution of the imaging variables.Table 2. Blood-brain barrier variables calculated from dynamic-contrast enhanced MRI and diffusion-weighted arterial spin labelling in normal-appearing white matter (NAWM), subcortical grey matter (SGM) and white matter hyperintensities (WMH).Table 2 dummy alt textTotalNAWMSGMWMHaOne-way(N=24)(N=24)(N=24)paired ANOVAWater exchange rate (min^-1^) Mean ± SD115.56 ± 23.79117.87 ± 21.01115.80 ± 30.10F=0.06,p=0.94Permeability surface area product (10^-4^min^-1^) Mean ± SD0.44 ± 1.171.57 ± 1.231.16 ± 1.47F=4.61,p=0.01Blood plasma volume (10^-2^) Mean ± SD0.47 ± 0.171.11 ± 0.310.65 ± 0.32F=34.37,p<0.001GBCA exchange rate (10^-2^min^-1^) Mean ± SD1.39 ± 3.411.61 ± 1.391.98 ± 3.02F=0.28,p=0.76aWater exchange rate values in WMH based on data from n=17 (n=6 low WMH burden;n=1 WMH outwith the DW-ASL imaging plane).
Inter-associations between water exchange rate and DCE-MRI BBB metrics
In univariate analyses (Fig. 1, Table 3), patients with higher SGM k_w_ had lower SGM v_P_ (B=-34.65, 95% confidence interval (95%CI)=-60.37,-8.93, p=0.01) and tended to have marginally higher SGM k_Gad_ (B=4.17, 95%CI=-2.23,10.57, p=0.19), but PS did not associate with k_w_ in SGM. Patients with higher NAWM k_w_ tended to have lower v_P_ (B=-42.15, 95%CI=-102.77,18.48, p=0.16), but we found no clear associations with PS or k_Gad_. Patients with higher WMH k_w_ had lower WMH PS (B=-17.34, 95%CI=-29.78,-4.91, p=0.01), and tended to have lower WMH v_P_ (B=-54.15, 95%CI=-116.22, 7.93, p=0.08) and WMH k_Gad_ (B=-3.56, 95%CI=-8.73, 1.60, p=0.16). After correcting for WMH volume and age, all associations were attenuated, though the directions of effect were unchanged.Fig. 1. Scatter plots of A) permeability surface area product (PS) against water exchange rate (k_w_), B) blood plasma volume (v_P_) against k_w_ and C) Gadolinium-based contrast agent exchange rate (PS/v_P_, k_Gad_) against k_w_ by tissue type (normal-appearing white matter (NAWM), subcortical grey matter (SGM) and white matter hyperintensities (WMH).Fig 1 dummy alt textTable 3Linear regressions with water exchange rate (k_w_) as the outcome against DCE-MRI BBB metrics: permeability surface area (PS), blood plasma volume (v_P_) and Gd-based contrast exchange rate (k_Gad_=PS/v_P_) each in a separate model. Multivariable models were adjusted for WMH volume and age.Table 3 dummy alt textAnalysis typeUnivariableMultivariableB95% CIpB95% CIpk_w_ against PS SGM1.77-5.71, 9.260.63-0.23-7.47, 7.010.95 NAWM-1.11-10.12, 7.890.80-1.48-10.29, 7.330.73 WMH-17.34-29.78, -4.910.01-15.31-28.98, -1.640.03k_w_ against v_P_ SGM-34.65-60.37, -8.930.01-29.40-55.46, -3.340.03 NAWM-42.15-102.77, 18.480.16-30.06-93.32, 33.200.33 WMH-54.15-116.22, 7.930.08-43.83-113.88, 26.220.20k_w_ against k_Gad_ SGM4.17-2.23, 10.570.192.48-3.92, 8.870.43 NAWM-0.15-3.24, 2.930.92-0.54-3.64, 2.570.72 WMH-3.56-8.73, 1.600.16-2.59-8.51, 3.340.36
Age associations with BBB metrics
In older participants, we found k_w_ tended lower across tissues (e.g. SGM: B=-0.74, 95%CI=-1.63, 0.15, p=0.10; Table 4, Figure S2). We did not generally find meaningful associations between age and PS, v_P_ or k_Gad_, though older participants tended to have higher WMH k_Gad_ (B=0.11, 95%CI=-0.022, 0.25, p=0.09).Table 4. Linear regressions with each BBB metric water exchange rate (k_w_), permeability surface area (PS), blood plasma volume (v_P_) and Gd-based contrast exchange rate (k_Gad_) in subcortical grey matter (SGM), normal-appearing white matter (NAWM) and white matter hyperintensities (WMH) assessed in separate models with baseline WMH volume and age as predictors.Table 4 dummy alt textCovariatePercentage WMH volume (%)AgeB95% CIpB95% CIpk_W_ SGM14.591.00, 28.180.04-0.74-1.63, 0.150.10 NAWM14.45-1.73, 30.630.08-0.38-1.44, 0.680.47 WMH19.48-5.34, 44.300.11-0.97-2.55, 0.600.21PS SGM0.40-0.48, 1.270.35-0.029-0.086, 0.0290.31 NAWM0.082-0.77, 0.940.84-0.0087-0.065, 0.0470.75 WMH-0.39-1.45, 0.660.440.033-0.036, 0.100.33v_P_ SGM-0.16-0.38,0.0550.140.0016-0.013, 0.0160.82 NAWM-0.074-0.19, 0.0420.200.00020-0.0074, 0.00780.96 WMH-0.22-0.43, -0.0110.04-0.0016-0.015, 0.0120.81k_Gad_ SGM0.68-0.29, 1.660.16-0.014-0.078, 0.0500.66 NAWM0.79-1.63, 3.220.500.050-0.11, 0.210.52 WMH-0.27-2.34, 1.800.790.11-0.022, 0.250.09
Baseline WMH volume associations with BBB metrics
In participants with higher WMH volumes, across tissues k_w_ tended higher (e.g. SGM: B=14.59, 95%CI=-1.00,28.18, p=0.04) and v_P_ lower (e.g. SGM: B=-0.16, 95%CI=-0.38, 0.055, p=0.14). We found no definite associations between WMH volume and PS or k_Gad_, though in patients with higher WMH volumes SGM and NAWM PS and k_Gad_ tended to be higher while WMH PS and k_Gad_ tended to be lower (Table 4, Figure S3).
1-year WMH volume increase associations with BBB metrics
Patients with greater WMH volume increase at 1-year tended to have higher baseline k_w_ in all tissues, but were marginally stronger associations for k_w_ in SGM (B=0.0013, 95%CI=-0.000068, 0.0026, p=0.06) and WMH (B=0.0012, 95%CI=0.00010, 0.0024, p=0.04) than NAWM (B=0.00081, 95%CI=-0.00032, 0.0019, p=0.15) (Fig. 2, Table 5).Fig. 2. Scatter plots of 1-year WMH volume change against: A) water exchange rate (k_w_), B) permeability surface area product (PS), C) blood plasma volume (v_P_) and D) Gadolinium-based contrast agent exchange rate (k_Gad_) by tissue type (normal-appearing white matter (NAWM), subcortical grey matter (SGM) and white matter hyperintensities (WMH).Fig 2 dummy alt textTable 5Linear regressions with 1-year WMH volume as the outcome against the BBB metrics water exchange rate (k_w_), permeability surface area (PS), blood plasma volume (v_P_) and Gd-based contrast exchange rate (k_Gad_=PS/v_P_) measured in subcortical grey matter (SGM), normal-appearing white matter (NAWM) and white matter hyperintensities (WMH) in separate models adjusted for baseline WMH volume and age.Table 5 dummy alt textB95% CIp1-year WMH volume against k_w_ SGM0.0013-0.000068, 0.00260.06 NAWM0.00081-0.00032, 0.00190.15 WMH0.00120.00010, 0.00240.041-year WMH volume against PS SGM-0.017-0.038, 0.00520.13 NAWM-0.026-0.047, -0.00490.02 WMH-0.0019-0.021, 0.0170.841-year WMH volume against v_P_ SGM-0.011-0.10, 0.0810.81 NAWM0.056-0.13, 0.240.53 WMH0.031-0.072, 0.130.541-year WMH volume against k_Gad_ SGM-0.011-0.031, 0.00830.24 NAWM-0.0061-0.014, 0.00180.12 WMH-0.0022-0.015, 0.0110.72
Patients with greater WMH volume increase at 1-year had lower NAWM PS (B=-0.026, 95%CI=-0.047, -0.049, p=0.02) and SGM PS tended lower (B=-0.017, 95%CI=-0.038, 0.052, p=0.13), though there was no clear association in WMH PS (B=-0.0019, 95%CI=-0.021, 0.017, p=0.84). However, we found no consistent associations between 1-year WMH increase and v_P_ in any tissue (e.g. SGM: B=-0.011, 95%CI=-0.10, 0.081, p=0.81). SGM and NAWM k_Gad_ tended lower in patients with greater 1-year WMH volume increase e.g. (SGM: B=-0.011, 95%CI=-0.031, 0.0083, p=0.24), but WMH k_Gad_ differed little (B=-0.0022, 95%CI=-0.015, 0.011, p=0.72).
Discussion
We investigated how k_w_ related to GBCA-derived BBB metrics and differed with WMH severity and change over 1 year in patients with stroke-related SVD. We found participants with higher k_w_ tended to have higher k_Gad_ in SGM and lower v_P_ in SGM and NAWM, suggesting only limited inter-associations between k_w_ and GBCA-based BBB metrics. While k_w_ tended to be higher in patients with higher baseline and 1-year increase in WMH volume, we did not find consistent associations between baseline/1-year increase in WMH volume and GBCA-derived BBB metrics.
Limited inter-associations between water and GBCA BBB function measures
Consistent with previous validation studies, we found only limited associations between water and GBCA exchange metrics. Relatively few studies have assessed how GBCA BBB measures associate with k_w_ in SVD. In community-dwelling elderly (n=16), Shao et al reported k_w_ and K^Trans^ (volume transfer constant from plasma to extracellular space) positively correlated in white matter, the caudate and middle cerebral artery perforator territory, but not the whole brain or grey matter [28]. Meanwhile, k_w_ and k_Gad_ only correlated in the MCA perforator territory, medial-temporal lobe and hippocampus. One recent study reported no significant correlations between whole-brain, deep grey matter, NAWM and WMH k_w_ and K^trans^ in sporadic SVD (n=30) [14]. By contrast, in CADASIL (n=40) and HTRA1‐related SVD (n=10) respectively higher deep grey matter and whole-brain k_w_ correlated with lower K^trans^. Mirroring these findings in sporadic SVD, we did not generally find consistent associations between k_w_ and PS, except in WMH, where the sample size was reduced by the limited extent and spatial distribution of WMH volume in some patients. Generally, we found SGM, NAWM, and WMH k_w_ tended higher with lower PS after correcting for age and WMH volume, reflecting findings in CADASIL and HTRA1-related SVD [14]. Water and GBCA exchange probe different BBB transport mechanisms [28]. While GBCA-derived metrics assess extravasation of GBCA into the brain parenchyma, k_w_ is thought to evaluate passive diffusion and active transport of water [16,28], which may provide complementary information on BBB integrity. Finally, lower v_P_ in sporadic SVD patients with higher k_w_ is generally consistent with vascular changes [29,30].
Age and BBB function
While older participants generally had lower k_w_, we found only limited evidence of differences in PS, v_P_ or k_Gad_. In line with our findings, several previous studies have reported k_w_ generally trends lower with older age [31,32]. Notably, in a large cohort study (n=186, age range: 8-92), Shao et al reported grey matter k_w_ sharply declined with age after 62 [31]. While PS/k_Gad_ and v_P_ are typically thought to become respectively higher and lower with age, in SVD conventional associations with BBB metrics may be confounded by existing comorbidities, particularly vascular risk and poor lifestyle factors [30]. As PS is defined as the product of permeability and vessel surface area, age- or SVD-related vessel size and density changes may disrupt associations [[33], [34], [35]], with v_P_ explaining much of the variance in PS [36]. Normalising by v_P_ (k_Gad_) accounts for differences in blood volume, but not vessel size, but generally we did not observe substantial differences between models including k_Gad_ or PS. Therefore, methods to assess vessel density should be developed and evaluated to help assess BBB leakage more accurately [[10], [30],37].
Baseline SVD burden and altered BBB function
Patients with sporadic SVD with higher WMH volumes had higher k_w_. Findings from previous studies have been mixed. Shao et al found a positive correlation between higher k_w_ and Fazekas score in community-dwelling elderly at risk of SVD (n=19) [9]. By contrast, one study in sporadic SVD (lacunar stroke/vascular cognitive impairment presumed to relate to SVD, n=30) reported no associations between k_w_ and WMH volume, nor other SVD markers, including number of lacunes, microbleeds and PVS score [14]. However, the inclusion criteria for sporadic SVD differed from our work (e.g. we scanned patients 1-3 months post-stroke to avoid acute stroke-related BBB effects which could disrupt associations with k_w_ and did not include patients diagnosed with vascular cognitive impairment). More broadly, higher WMH volume has previously been associated with lower k_w_ in CADASIL [11,14,38], HTRA1-related SVD [14] and mild cognitive impairment [12]. Previously, CADASIL and sporadic SVD were found to show similar vascular dysfunctions, including GBCA BBB measures, with apparent differences largely reflecting disease severity [39]. Taken together with previous findings of varying associations between k_w_ and WMH volume in CADASIL vs sporadic SVD [14], this may tentatively suggest associations may vary across the disease course with SVD severity and types [16,40]. However, confirmatory findings in larger cohort studies are required.
We did not find consistent associations between WMH volume and PS/k_Gad_. However, consistent with previous results [30,39,41], we found v_P_ generally tended to be lower in patients with higher WMH volume reflecting SVD-related vascular changes. Several studies have found higher BBB leakage associates with higher WMH severity [5,41], but others findings were more mixed [3,30,39,42]. For example, Li et al found higher GM, WM and WMH K^Trans^ with increasing WMH burden [41]. However, Zhang et al reported lower WMH K_i_ in patients with higher WMH volume, while NAWM and cortical grey matter K_i_ (permeability) did not associate with WMH volume [42]. Accurate assessment of subtle BBB leakage, as in SVD, remains challenging due to the limited signal-to-noise ratio, even following gold-standard consensus protocols [3,21], and the previously discussed inability to separate the effects of SVD- and age-related vascular changes [30]. Larger sample sizes (including multicentre collaborations) [39], further harmonisation and methodological development [3,21] are needed to untangle these interacting effects.
1-year WMH increase and BBB function associations
In line with our hypothesis, we found higher 1-year WMH volume increase was generally associated with higher k_w_, while PS and k_Gad_ tended to be lower. Associations between water exchange and SVD progression have not been widely explored previously [16]. In patients with white matter lesions/chronic ischaemia (n=41), Fujima et al found k_w_ at 2-year follow-up did not differ in ROIs with versus without WMH progression, though the square difference (relative to mean k_w_ in age-matched healthy controls with no WMH, n=5) was higher in regions where WMH had progressed [40]. Several pathological processes are implicated in WMH progression, including neuroinflammation, demyelination, axonal loss and gliosis [1]. However, evidence on how AQP4 and vascular dysfunctions, including BBB impairment, interact with disease progression in humans remains scarce [43], therefore robust translational validation studies in clinically relevant models are required to assess how these different effects interact with SVD change [37].
Strengths/limitations
This work has several strengths. We conducted this work in a subset of patients from an established and extremely well-characterised cohort with extensive contextual data, directly comparing water and GBCA measures of BBB leakage. We used established acquisition and processing protocols for the structural, DW-ASL and DCE-MRI data which were optimised for SVD research. Where available we followed relevant consensus guidelines [3,18]. We included a mix of cortical and lacunar patients to include a broader range of SVD severity while controlling for guidelines stroke prevention, received by all patients, and similar VRFs [17]. To our knowledge, our study is amongst the first studies to investigate how k_w_ varies with longitudinal SVD change at 1-year. Limitations include the relatively small sample size, as this was an exploratory pilot analysis. We only included patients with sporadic SVD who had lacunar or mild cortical strokes. Not all participants completed scans at 1-year, which may have introduced bias, however retention was very high with over 90% (22/24) completing follow-up. We did not acquire DW-ASL scans at 1-year, therefore we are unable to assess whether change in k_w_ and SVD severity co-vary. Future studies with larger sample sizes should explore how k_w_ varies with cognitive, physical and SVD burden changes over longer follow-up durations. Additionally, other markers of SVD e.g. perivascular space volume should be evaluated. The effects of local differences in k_w_ e.g. adjacent to WMH should also be investigated. Importantly, both DCE-MRI and DW-ASL remain technically challenging, complex imaging techniques, further methodological improvements and validation is needed to improve harmonization [3,44]. Inter-associations with other variables, including local differences in perfusion and diffusivity, should also be evaluated.
Conclusion
In this small study, we found evidence of associations between DW-ASL and GBCA BBB function metrics. k_w_ was sensitive to SVD severity and 1-year change, consistent with previous studies using GBCA [5,6,30,45,46], suggesting DW-ASL is a promising imaging marker of subtle BBB dysfunction. However, limited inter-relations between k_w_ and GBCA-metrics suggest k_w_ probes different facets of BBB dysfunction than conventional GBCA-metrics. Further studies are required to validate these findings in a larger cohort, to evaluate longitudinal changes in k_w_ and associations with other disease burden metrics and understand the role of k_w_ in assessing BBB leakage.
Funding sources
Funding is gratefully acknowledged from Fondation Leducq Network (16 CVD 05); the UK Dementia Research Institute which receives its funding from DRI Ltd, primarily funded by the UK MRC; Scottish Funding Council through the Scottish Imaging Network, A Platform for Scientific Excellence (SINAPSE) Postdoctoral and Early Career Researcher Exchanges scheme and Stroke Association Post-Doctoral Fellowship (MSS) (SAPDF 23/100007); Row Fogo Charitable Trust Centre for Research into Aging and the Brain; NHS Lothian Research and Development Office (MJT); Mexican National Council of Science and Technology and Anne Rowling Regenerative Neurology Clinic (CAR); Chief Scientist Office of Scotland Clinical Academic Fellowship (UC) (CAF/18/08); Stroke Association Princess Margaret Research Development Fellowship (UC) (2018); Wellcome Trust Translational Neuroscience Ph.D. programme (224912/ Z/21/Z) (DJG); Stroke Association-Garfield Weston Foundation (The Stroke Association Lectureship 2015/04), NHS Research Scotland, and Agnes Parry Endowment at the University of Edinburgh (FND) and US National Institutes of Health (NIH) grants R01NS134712 and R01NS114382 (DJJW). The 3T scanner is funded by the Wellcome Trust (104916/Z/14/Z), Dunhill Trust (R380R/1114), Edinburgh and Lothians Health Foundation (2012/17), Muir Maxwell Research Fund and University of Edinburgh.
CRediT authorship contribution statement
Michael S Stringer: Writing – review & editing, Writing – original draft, Visualization, Project administration, Methodology, Investigation, Funding acquisition, Formal analysis, Conceptualization. Xingfeng Shao: Writing – review & editing, Software, Resources, Methodology. Hedok Lee: Writing – review & editing, Methodology, Funding acquisition, Conceptualization. Antoine Vallatos: Writing – review & editing, Methodology, Funding acquisition, Conceptualization. Carmen Arteaga-Reyes: Writing – review & editing, Methodology, Investigation, Data curation. Una Clancy: Writing – review & editing, Methodology, Investigation. Francesca Chappell: Writing – review & editing, Methodology, Data curation. Cameron Manning: Writing – review & editing, Methodology, Formal analysis. Maria Valdes-Hernandez: Writing – review & editing, Software, Methodology, Investigation. Daniela Jaime Garcia: Writing – review & editing, Methodology, Investigation, Data curation. Rosalind Brown: Writing – review & editing, Project administration, Investigation, Data curation. Fergus N Doubal: Writing – review & editing, Resources, Methodology, Investigation. Helene Benveniste: Writing – review & editing, Supervision, Funding acquisition, Conceptualization. Michael J Thrippleton: Writing – review & editing, Supervision, Software, Methodology, Investigation, Funding acquisition, Formal analysis, Conceptualization. Danny JJ Wang: Writing – review & editing, Supervision, Software, Resources, Methodology, Investigation, Funding acquisition, Conceptualization. Joanna M Wardlaw: Writing – review & editing, Supervision, Resources, Methodology, Investigation, Funding acquisition, Conceptualization.
Declaration of competing interest
The authors declare the following financial interests/personal relationships which may be considered as potential competing interests:
Michael S Stringer reports financial support was provided by Stroke Association. Carmen Arteaga-Reyes reports financial support was provided by UK Dementia Research Institute. Carmen Arteaga-Reyes reports financial support was provided by Mexican National Council of Humanities Science and Technology. Carmen Arteaga-Reyes reports financial support was provided by Row Fogo Charitable Trust Centre for Research into Ageing and the Brain. Carmen Arteaga-Reyes reports financial support was provided by Anne Rowling Regenerative Neurology Clinic. Una Clancy reports financial support was provided by the Chief Scientist Office of Scotland Clinical Academic Fellowship. Una Clancy reports financial support was provided by the Stroke Association Princess Margaret Research Development Fellowship. Maria Del Carmen Valdes-Hernandez reports financial support was provided by Mrs Gladys Row Fogo Charitable Trust. Daniela Jaime Garcia reports financial support was provided by The Wellcome Trust. Fergus Doubal reports financial support was provided by the Stroke Association-Garfield Weston Foundation. Fergus Doubal reports financial support was provided by NHS Research Scotland. Fergus Doubal reports financial support was provided by the Agnes Parry Endowment at the University of Edinburgh. Danny Wang reports financial support was provided by the US National Institutes of Health. Danny Wang is a co-founder and shareholder of Hura Imaging, Inc. Joanna M Wardlaw reports financial support was provided by Leducq Foundation. Joanna M Wardlaw reports financial support was provided by UK Dementia Research Institute. Joanna M Wardlaw reports financial support was provided by The Stroke Association. Joanna M Wardlaw reports financial support was provided by The Row Fogo Charitable Trust. Joanna M Wardlaw reports financial support was provided by Wellcome Trust. JM Wardlaw is on the Editorial Board of CCCB - Given her role as editorial board member, JM Wardlaw had no involvement in the peer review of this article and had no access to information regarding its peer review. Full responsibility for the editorial process for this article was delegated to another journal editor. If there are other authors, they declare that they have no known competing financial interests or personal relationships that could have appeared to influence the work reported in this paper.
The reference list from the paper itself. Each links out to its DOI / PubMed record.
- 1Wardlaw J.Smith C.Dichgans M.Small vessel disease: mechanisms and clinical implications Lancet Neurol.18720196846963109738510.1016/S 1474-4422(19)30079-1 · doi ↗ · pubmed ↗
- 2Clancy U.Appleton J.Arteaga C.Doubal F.Bath P.Wardlaw JM.Clinical management of cerebral small vessel disease: a call for a holistic approach Chin. Med. J.13422020127142 Oct 63311896010.1097/CM 9.0000000000001177 PMC 7817338 · doi ↗ · pubmed ↗
- 3Thrippleton M.Backes W.Sourbron S.Quantifying blood-brain barrier leakage in small vessel disease: Review and consensus recommendations Alzheimers Dement.1562019840858 Jun 3103110110.1016/j.jalz.2019.01.013PMC 6565805 · doi ↗ · pubmed ↗
- 4Farrall A.Wardlaw JM.Blood-brain barrier: ageing and microvascular disease–systematic review and meta-analysis Neurobiol, Aging,3032009337352 Mar 1786938210.1016/j.neurobiolaging.2007.07.015 · doi ↗ · pubmed ↗
- 5Wardlaw J.Makin S.Valdés Hernández M.Blood-brain barrier failure as a core mechanism in cerebral small vessel disease and dementia: evidence from a cohort study Alzheimer's Dement.13620176346432017/06/01/
- 6Kerkhofs D.Wong S.Zhang E.Blood-brain barrier leakage at baseline and cognitive decline in cerebral small vessel disease: a 2-year follow-up study Geroscience 4342021 Aug 164316523416078010.1007/s 11357-021-00399-x PMC 8492799 · doi ↗ · pubmed ↗
- 7Sourbron S.Buckley DL.Classic models for dynamic contrast-enhanced MRINMR Biomed.268201310041027 Aug 2367430410.1002/nbm.2940 · doi ↗ · pubmed ↗
- 8Heye A.Thrippleton M.Armitage P.Tracer kinetic modelling for DCE-MRI quantification of subtle blood-brain barrier permeability Neuroimage 1252016446455 Jan 152647765310.1016/j.neuroimage.2015.10.018PMC 4692516 · doi ↗ · pubmed ↗