Evaluation of the Safety of Robot‐Assisted Radical Cystectomy for Bladder Cancer in Octogenarians
Toshiharu Morikawa, Shuzo Hamamoto, Yoshihiko Tasaki, Daiki Ishikawa, Maria Aoki, Masakazu Gonda, Nobuhiko Shimizu, Takashi Nagai, Toshiki Etani, Taku Naiki, Ryosuke Ando, Kazuhiro Kanemoto, Atsushi Okada, Noriyasu Kawai, Tohru Mogami, Takahiro Yasui

TL;DR
Robot-assisted surgery for bladder cancer is safe for elderly patients, with similar complication rates to younger patients, though they face longer hospital stays and more ileus.
Contribution
This study evaluates the safety and outcomes of robot-assisted radical cystectomy in octogenarians with bladder cancer.
Findings
Elderly patients had shorter operative times but longer hospital stays compared to younger patients.
The complication rates were comparable between elderly and younger patients, though ileus was more common in the elderly group.
Higher age, ileus, and delayed drain removal were factors prolonging hospitalization in elderly patients.
Abstract
Open radical cystectomy is the current standard treatment for bladder cancer. However, it is associated with high morbidity and mortality, particularly in the elderly. Recently, robotic surgery has become a minimally invasive approach. To this end, we aimed to evaluate the safety and complications of robot‐assisted radical cystectomy (RARC) in elderly patients with urothelial carcinoma. We performed a retrospective single‐center analysis of 103 patients who underwent RARC between May 2018 and May 2024. The patients were divided into an elderly group (age, ≥ 80 years; n = 24) and a younger group (n = 79). The American Society of Anesthesiologists Physical Status Classification System scores were significantly lower in the elderly group than in the younger group. No significant differences were observed between the two groups in terms of demography. Operative time was shorter in the…
Genes, proteins, chemicals, diseases, species, mutations and cell lines named across the full text — each resolved to its canonical identifier and authoritative record.
Click any figure to enlarge with its caption.
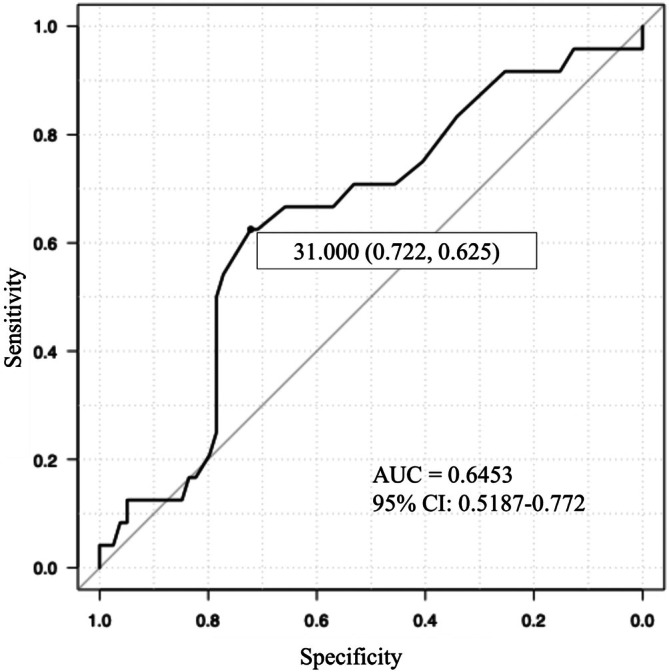 FIGURE 1
| Overall ( | Elderly group ( | Younger group ( |
| |
|---|---|---|---|---|
| Age (years), median (IQR) | 75.0 (69.0–79.0) | 83.0 (81.0–84.0) | 73.0 (67.5–75.5) | < 0.001 |
| Sex, | ||||
| Male | 84 (81.6) | 20 (83.3) | 64 (81.0) | 1.000 |
| Female | 19 (18.4) | 4 (16.7) | 15 (19.0) | |
| BMI, median (IQR) | 23.6 (21.3–26.05) | 24.4 (21.5–26.7) | 23.6 (21.2–25.8) | 0.376 |
| ASA‐PS, | ||||
| 1 | 3 (2.9) | 3 (12.5) | 0 (0.0) | 0.019 |
| 2 | 75 (72.8) | 15 (62.5) | 60 (75.9) | |
| 3 | 25 (24.3) | 6 (25.0) | 19 (24.1) | |
| Barthel Index | 100 (100–100) | 100 (97.5–100) | 100 (100–100) | 0.768 |
| Clinical T stage, | ||||
| Carcinoma in situ | 17 (16.5) | 3 (12.5) | 14 (17.7) | 0.069 |
| 1 or lower | 25 (24.3) | 4 (16.7) | 21 (26.6) | |
| 2 | 55 (53.4) | 12 (50.0) | 43 (54.4) | |
| 3 | 16 (15.5) | 8 (33.3) | 8 (10.1) | |
| 4 | 7 (6.8) | 0 (0.0) | 7 (8.9) | |
| Clinical N stage, | ||||
| 0 | 95 (92.2) | 22 (91.7) | 73 (92.4) | 0.644 |
| 1 | 5 (4.9) | 2 (8.3) | 3 (3.8) | |
| 2 | 3 (2.9) | 0 (0.0) | 3 (3.8) | |
| Neoadjuvant chemotherapy, | ||||
| Gemcitabine + cisplatin | 63 (61.2) | 17 (70.8) | 46 (58.2) | 0.598 |
| Gemcitabine + carboplatin | 7 (6.8) | 1 (4.2) | 6 (7.6) | |
| None | 33 (32.0) | 6 (25.0) | 27 (34.2) | |
| Cycles of neoadjuvant chemotherapy, median (IQR) | 3 (0–3) | 3 (0.75–3) | 3 (0–3) | 0.094 |
| Patients with comorbidities, | 84 (81.6) | 21 (87.5) | 63 (79.7) | 0.551 |
| Hypertension | 42 (40.8) | 11 (45.8) | 31 (39.2) | 0.012 |
| Hyperlipidemia | 21 (20.4) | 11 (45.8) | 10 (12.7) | |
| Hyperuricemia | 18 (17.5) | 1 (4.2) | 17 (21.5) | |
| Diabetes | 26 (25.2) | 10 (41.7) | 16 (20.3) | |
| Heart disease | 11 (10.7) | 4 (16.7) | 7 (8.9) | |
| Respiratory disease | 6 (5.8) | 1 (4.2) | 5 (2.5) | |
| Hepatitis | 3 (2.9) | 1 (4.2) | 2 (2.5) | |
| Stroke | 7 (6.8) | 1 (4.2) | 6 (7.6) | |
| Other carcinoma | 20 (19.4) | 1 (4.2) | 19 (24.1) | |
| Others | 16 (15.5) | 5 (20.8) | 11 (13.9) | |
| Overall ( | Elderly group ( | Younger group ( |
| |
|---|---|---|---|---|
| Preoperative serum albumin | 3.8 (3.6–4.2) | 3.7 (3.5–4.1) | 3.9 (3.6–4.2) | 0.076 |
| Preoperative serum CRP | 0.130 (0.058–0.298) | 0.130 (0.040–0.450) | 0.100 (0.055–0.265) | 0.931 |
| Preoperative NLR | 2.380 (1.492–3.166) | 2.346 (1.578–2.771) | 2.418 (1.492–3.482) | 0.588 |
| Urinary diversion, | ||||
| Ileal conduit (ICUD) | 49 (47.6) | 17 (70.8) | 32 (40.5) | 0.070 |
| Ileal conduit (ECUD) | 29 (28.2) | 4 (16.7) | 25 (31.6) | |
| Neobladder | 7 (6.8) | 0 (0.0) | 7 (8.9) | |
| Cutaneous ureterostomy | 18 (17.5) | 3 (12.5) | 15 (19.0) | |
| Operative time (min), median (IQR) | 433.0 (381.5–512.5) | 393.5 (343.5–449.8) | 442.0 (405.5–522.5) | 0.029 |
| Console time (min), median (IQR) | 275.0 (221.0–365.0) | 239.5 (224.0–334.0) | 278.0 (220.0–365.5) | 0.270 |
| Days of resumption of oral intake, median (IQR) | 3.0 (2.0–5.0) | 3.0 (2.0–4.5) | 3.0 (2.0–5.0) | 0.416 |
| Days of drain removal, median (IQR) | 8.0 (7.0–14.0) | 8.0 (7.0–15.25) | 8.0 (7.0–14.0) | 0.615 |
| Days of hospitalization, median (IQR) | 26.0 (22.0–36.5) | 34.5 (23.8–38.5) | 25.0 (21.5–31.5) | 0.032 |
| Overall ( | Elderly group ( | Younger group ( |
| |
|---|---|---|---|---|
| Overall complications, | 67 (65.0) | 16 (66.7) | 51 (64.6) | 1.000 |
| Grade of complication (Clavien–Dindo) | ||||
| Grade 0 | 38 (36.9) | 10 (41.7) | 28 (35.4) | 0.670 |
| Grade I | 20 (19.4) | 6 (25.0) | 14 (17.7) | |
| Grade II | 31 (30.1) | 6 (25.0) | 25 (31.6) | |
| Grade III | 14 (13.6) | 2 (8.3) | 12 (15.2) | |
| > Grade IV | 0 (0.0) | 0 (0.0) | 0 (0.0) | |
| Type of complication | ||||
| Anemia | 4 (3.9) | 0 (0.0) | 4 (5.1) | 0.571 |
| Fever | 11 (10.7) | 1 (4.2) | 10 (12.7) | 0.450 |
| Wound infection | 5 (4.9) | 1 (4.2) | 4 (5.1) | 1.000 |
| Pyelonephritis | 10 (9.7) | 2 (8.3) | 8 (10.1) | 1.000 |
| Epididymitis | 1 (1.0) | 0 (0.0) | 1 (1.3) | 1.000 |
| Pelvic inflammatory disease | 4 (3.9) | 1 (4.2) | 3 (3.8) | 1.000 |
| Lymphorrhea | 2 (1.9) | 0 (0.0) | 2 (2.5) | 1.000 |
| Ileus | 14 (13.6) | 7 (29.2) | 7 (8.9) | 0.018 |
| Ureteral obstruction | 2 (1.9) | 0 (0.0) | 2 (2.5) | 1.000 |
| Anastomotic leakage | 4 (3.9) | 0 (0.0) | 4 (5.1) | 0.571 |
| Parastomal hernia | 2 (1.9) | 1 (4.2) | 1 (1.3) | 0.413 |
| Nausea | 3 (2.9) | 0 (0.0) | 3 (3.8) | 1.000 |
| Decreased oxygenation | 1 (1.0) | 1 (4.2) | 0 (0.0) | 0.233 |
| Deep vein thrombosis | 1 (1.0) | 0 (0.0) | 1 (1.3) | 1.000 |
| Compartment syndrome | 1 (1.0) | 0 (0.0) | 1 (1.3) | 1.000 |
| Factors | Univariate | Multivariate | |||
|---|---|---|---|---|---|
| Odds ratio (95% CI) |
| Odds ratio (95% CI) |
| VIF | |
| Intercept | 0.000123 (0.0000000538–0.279) | 0.022 | |||
| Age | 1.070 (1.010–1.140) | 0.017 | 1.08 (1.01–1.16) | 0.032 | 1.178 |
| Male sex | 0.556 (0.203–1.520) | 0.253 | |||
| BMI | 1.040 (0.930–1.170) | 0.467 | |||
| ASA‐PS class III or more | 1.960 (0.782–4.900) | 0.152 | 2.78 (0.877–8.820) | 0.083 | 1.152 |
| Preoperative serum Albumin | 0.493 (0.204–1.200) | 0.118 | 1.14 (0.368–3.540) | 0.819 | 1.146 |
| Preoperative serum CRP | 1.050 (0.784–1.410) | 0.737 | |||
| Preoperative NLR | 0.936 (0.764–1.150) | 0.520 | |||
| Urinary diversion | |||||
| Ileal conduit (ICUD) | 2.110 (0.596–7.480) | 0.246 | |||
| Ileal conduit (ECUD) | 1.510 (0.462–4.930) | 0.495 | |||
| Neobladder | 0.433 (0.041–4.570) | 0.486 | |||
| Cutaneous ureterostomy | 1.000 (reference) | 1.000 (reference) | |||
| Operative time | 0.997 (0.993–1.000) | 0.255 | |||
| Complications (Clavien‐Dindo Grade 3 or more) | 2.710 (0.915–8.020) | 0.072 | 3.21 (0.772–13.3) | 0.109 | 1.142 |
| Ileus | 8.880 (2.290–34.500) | 0.002 | 6.56 (1.03–41.80) | 0.047 | 1.485 |
| Days of resumption of oral intake | 1.110 (1.010–1.230) | 0.028 | 1.02 (0.89–1.18) | 0.748 | 1.381 |
| Days of drain removal | 1.120 (1.050–1.200) | 0.001 | 1.12 (1.04–1.21) | 0.004 | 1.094 |
| Factors | Univariate | Multivariate | |||
|---|---|---|---|---|---|
| Odds ratio (95% CI) |
| Odds ratio (95% CI) |
| VIF | |
| Intercept | |||||
| Age | 1.170 (1.040–1.310) | 0.007 | 1.160 (1.030–1.300) | 0.012 | 1.002 |
| BMI | 0.939 (0.793–1.110) | 0.466 | |||
| Male sex | 0.804 (0.201–3.220) | 0.757 | |||
| ASA‐PS class III or more | 0.831 (0.212–3.250) | 0.790 | |||
| Preoperative serum albumin | 0.306 (0.092–1.020) | 0.054 | 0.369 (0.092–1.480) | 0.159 | 1.002 |
| Preoperative serum CRP | 1.080 (0.746–1.570) | 0.681 | |||
| Preoperative NLR | 1.000 (0.787–1.280) | 0.986 | |||
| Urinary diversion | |||||
| Ileal conduit (ICUD) | 2.720 (0.279–26.500) | 0.389 | |||
| Ileal conduit (ECUD) | 3.320 (0.385–28.600) | 0.275 | |||
| Neobladder | 2.830 (0.152–52.700) | 0.485 | |||
| Cutaneous ureterostomy | 1.000 (reference) | 1.000 (reference) | |||
| Operative time | 1.000 (0.994–1.010) | 0.944 | |||
| Complications (Clavien–Dindo Grade 3 or more) | 1.590 (0.391–6.500) | 0.515 | |||
| Days of drain removal | 1.030 (0.971–1.100) | 0.304 | |||
Peer Reviews
No public reviews on file for this paper yet. If you reviewed it on a platform where reviews are public (OpenReview, ICLR, NeurIPS, ICML), you can paste yours below so the community can read it here.
Videos
No videos yet. Explain this paper in a talk, walkthrough, or lecture? Add one.
Taxonomy
TopicsBladder and Urothelial Cancer Treatments · Ureteral procedures and complications · Urinary and Genital Oncology Studies
Introduction
1
Bladder cancer is the 10th most frequently diagnosed cancer worldwide and presents a substantial clinical challenge owing to its high recurrence rate. The current standard of care for muscle‐invasive bladder cancer and high‐risk non‐muscle‐invasive bladder cancer is radical cystectomy [1, 2, 3, 4]. Open radical cystectomy (ORC) is the conventional curative treatment in such cases. However, this procedure is often associated with high perioperative morbidity and mortality, particularly in elderly and/or frail patients [5, 6, 7, 8].
Recently, robotic surgery has become a minimally invasive approach in urology. Similarly, robot‐assisted radical cystectomy (RARC) was introduced to exceed ORC [9]. Although several reports showcase the safety and efficacy of RARC, its application in elderly patients remains controversial [10, 11]. In particular, several large‐scale studies have shown that ORC is reported to be associated with a significant risk of major complications and perioperative morbidity and mortality in patients aged ≥ 80 years [7, 8], even after adjustment for comorbidities and performance status. This age‐group also may require additional attention given evidence indiacting that octogenarians represent a clinically distinct population, with a nonlinear increase in mortality risk [12] and frailty prevalence [13] reflecting a marked decline in physiological reserves that directly impacts surgical tolerance and postoperative recovery. In an era of increasing life expectancy, a rapidly aging society, and a growing proportion of elderly people being diagnosed with bladder cancer, establishing the safety profile of RARC in this population is imperative for surgical decision‐making [12, 13, 14, 15]. Based on the above background, in this study, we aimed to evaluate the safety of RARC in patients aged ≥ 80 years.
Patients and Methods
2
Patients
2.1
A retrospective analysis was conducted in 103 patients presenting with urothelial carcinoma who underwent RARC at Nagoya City University Hospital between May 2018 and May 2024. The preoperative performance status was evaluated using the American Society of Anesthesiologists Physical Status Classification System (ASA‐PS) classification. Clinical staging was determined based on the pathological diagnosis of transurethral resection performed prior to radical cystectomy and imaging findings from enhanced computed tomography or magnetic resonance imaging. It was conducted in accordance with the TNM classification system, which is based on UICC version 8. Complications were graded according to the Clavien–Dindo classification system. The study protocol was approved by the Institutional Review Board of Nagoya City University Hospital (IRB approved number: 46‐17‐0007) and conformed to the provisions of the Declaration of Helsinki, 2024. Informed consent was obtained from all patients.
Statistical Analysis
2.2
Categorical variables were compared using Fisher's exact test, and quantitative variables were evaluated using the Mann–Whitney U‐test and Kruskal–Wallis test. Predictive factors for hospitalization for > 30 days were tested using logistic regression analysis. Multivariate logistic regression analysis was performed with p < 0.2 in the univariate logistic regression analysis. All tests were two‐sided, and p < 0.05 was considered statistically significant. All statistical analyses were performed using EZR software. This program is a graphical user interface for R [16].
Results
3
The 103 patients included in this study were divided into two groups for analysis: the Elderly group (n = 24), consisting of patients aged ≥ 80 years at the time of surgery, and the Younger group (n = 79), consisting of patients aged < 80 years. The demographic characteristics of the study population are shown in Table 1. The median age was 83.0 (81.0–84.0) years in the Elderly group and 73.0 (67.5–75.5) years in the Younger group. The ASA‐PS score was significantly lower in the Elderly group compared to the Younger group (p = 0.019). No significant differences were observed between the two groups in terms of body mass index, Barthel Index, clinical disease stage, preoperative chemotherapy status, regimen, or number of cycles administered. Furthermore, although the proportion of patients with comorbidities did not differ significantly between groups, the details of comorbidities were significantly more prevalent in the Elderly group.
TABLE 1: Patient characteristics.
<table><col align="left"/><col align="center"/><col align="center"/><col align="center"/><col align="center"/><thead><tr><th align="left" rowspan="1" colspan="1"/><th align="center" rowspan="1" colspan="1">Overall (<italic>n</italic> = 103)</th><th align="center" rowspan="1" colspan="1">Elderly group (<italic>n</italic> = 24) (age ≥ 80)</th><th align="center" rowspan="1" colspan="1">Younger group (<italic>n</italic> = 79) (age < 80)</th><th align="center" rowspan="1" colspan="1"> <italic>p</italic> </th></tr></thead><tbody><tr><td align="left" rowspan="1" colspan="1">Age (years), median (IQR)</td><td align="center" rowspan="1" colspan="1">75.0 (69.0–79.0)</td><td align="center" rowspan="1" colspan="1">83.0 (81.0–84.0)</td><td align="center" rowspan="1" colspan="1">73.0 (67.5–75.5)</td><td align="center" rowspan="1" colspan="1">< 0.001<xref>*</xref> </td></tr><tr><td align="left" colspan="5" rowspan="1">Sex, <italic>n</italic> (%)</td></tr><tr><td align="left" rowspan="1" colspan="1">Male</td><td align="center" rowspan="1" colspan="1">84 (81.6)</td><td align="center" rowspan="1" colspan="1">20 (83.3)</td><td align="center" rowspan="1" colspan="1">64 (81.0)</td><td align="center" rowspan="2" colspan="1">1.000</td></tr><tr><td align="left" rowspan="1" colspan="1">Female</td><td align="center" rowspan="1" colspan="1">19 (18.4)</td><td align="center" rowspan="1" colspan="1">4 (16.7)</td><td align="center" rowspan="1" colspan="1">15 (19.0)</td></tr><tr><td align="left" rowspan="1" colspan="1">BMI, median (IQR)</td><td align="center" rowspan="1" colspan="1">23.6 (21.3–26.05)</td><td align="center" rowspan="1" colspan="1">24.4 (21.5–26.7)</td><td align="center" rowspan="1" colspan="1">23.6 (21.2–25.8)</td><td align="center" rowspan="1" colspan="1">0.376</td></tr><tr><td align="left" colspan="5" rowspan="1">ASA‐PS, <italic>n</italic> (%)</td></tr><tr><td align="left" rowspan="1" colspan="1">1</td><td align="center" rowspan="1" colspan="1">3 (2.9)</td><td align="center" rowspan="1" colspan="1">3 (12.5)</td><td align="center" rowspan="1" colspan="1">0 (0.0)</td><td align="center" rowspan="3" colspan="1">0.019<xref>*</xref> </td></tr><tr><td align="left" rowspan="1" colspan="1">2</td><td align="center" rowspan="1" colspan="1">75 (72.8)</td><td align="center" rowspan="1" colspan="1">15 (62.5)</td><td align="center" rowspan="1" colspan="1">60 (75.9)</td></tr><tr><td align="left" rowspan="1" colspan="1">3</td><td align="center" rowspan="1" colspan="1">25 (24.3)</td><td align="center" rowspan="1" colspan="1">6 (25.0)</td><td align="center" rowspan="1" colspan="1">19 (24.1)</td></tr><tr><td align="left" rowspan="1" colspan="1">Barthel Index</td><td align="center" rowspan="1" colspan="1">100 (100–100)</td><td align="center" rowspan="1" colspan="1">100 (97.5–100)</td><td align="center" rowspan="1" colspan="1">100 (100–100)</td><td align="center" rowspan="1" colspan="1">0.768</td></tr><tr><td align="left" colspan="5" rowspan="1">Clinical T stage, <italic>n</italic> (%)<xref> <sup>a</sup> </xref> </td></tr><tr><td align="left" rowspan="1" colspan="1">Carcinoma in situ</td><td align="center" rowspan="1" colspan="1">17 (16.5)</td><td align="center" rowspan="1" colspan="1">3 (12.5)</td><td align="center" rowspan="1" colspan="1">14 (17.7)</td><td align="center" rowspan="5" colspan="1">0.069</td></tr><tr><td align="left" rowspan="1" colspan="1">1 or lower</td><td align="center" rowspan="1" colspan="1">25 (24.3)</td><td align="center" rowspan="1" colspan="1">4 (16.7)</td><td align="center" rowspan="1" colspan="1">21 (26.6)</td></tr><tr><td align="left" rowspan="1" colspan="1">2</td><td align="center" rowspan="1" colspan="1">55 (53.4)</td><td align="center" rowspan="1" colspan="1">12 (50.0)</td><td align="center" rowspan="1" colspan="1">43 (54.4)</td></tr><tr><td align="left" rowspan="1" colspan="1">3</td><td align="center" rowspan="1" colspan="1">16 (15.5)</td><td align="center" rowspan="1" colspan="1">8 (33.3)</td><td align="center" rowspan="1" colspan="1">8 (10.1)</td></tr><tr><td align="left" rowspan="1" colspan="1">4</td><td align="center" rowspan="1" colspan="1">7 (6.8)</td><td align="center" rowspan="1" colspan="1">0 (0.0)</td><td align="center" rowspan="1" colspan="1">7 (8.9)</td></tr><tr><td align="left" colspan="5" rowspan="1">Clinical N stage, <italic>n</italic> (%)</td></tr><tr><td align="left" rowspan="1" colspan="1">0</td><td align="center" rowspan="1" colspan="1">95 (92.2)</td><td align="center" rowspan="1" colspan="1">22 (91.7)</td><td align="center" rowspan="1" colspan="1">73 (92.4)</td><td align="center" rowspan="3" colspan="1">0.644</td></tr><tr><td align="left" rowspan="1" colspan="1">1</td><td align="center" rowspan="1" colspan="1">5 (4.9)</td><td align="center" rowspan="1" colspan="1">2 (8.3)</td><td align="center" rowspan="1" colspan="1">3 (3.8)</td></tr><tr><td align="left" rowspan="1" colspan="1">2</td><td align="center" rowspan="1" colspan="1">3 (2.9)</td><td align="center" rowspan="1" colspan="1">0 (0.0)</td><td align="center" rowspan="1" colspan="1">3 (3.8)</td></tr><tr><td align="left" colspan="5" rowspan="1">Neoadjuvant chemotherapy, <italic>n</italic> (%)</td></tr><tr><td align="left" rowspan="1" colspan="1">Gemcitabine + cisplatin</td><td align="center" rowspan="1" colspan="1">63 (61.2)</td><td align="center" rowspan="1" colspan="1">17 (70.8)</td><td align="center" rowspan="1" colspan="1">46 (58.2)</td><td align="center" rowspan="3" colspan="1">0.598</td></tr><tr><td align="left" rowspan="1" colspan="1">Gemcitabine + carboplatin</td><td align="center" rowspan="1" colspan="1">7 (6.8)</td><td align="center" rowspan="1" colspan="1">1 (4.2)</td><td align="center" rowspan="1" colspan="1">6 (7.6)</td></tr><tr><td align="left" rowspan="1" colspan="1">None</td><td align="center" rowspan="1" colspan="1">33 (32.0)</td><td align="center" rowspan="1" colspan="1">6 (25.0)</td><td align="center" rowspan="1" colspan="1">27 (34.2)</td></tr><tr><td align="left" rowspan="1" colspan="1">Cycles of neoadjuvant chemotherapy, median (IQR)</td><td align="center" rowspan="1" colspan="1">3 (0–3)</td><td align="center" rowspan="1" colspan="1">3 (0.75–3)</td><td align="center" rowspan="1" colspan="1">3 (0–3)</td><td align="center" rowspan="1" colspan="1">0.094</td></tr><tr><td align="left" rowspan="1" colspan="1">Patients with comorbidities, <italic>n</italic> (%)<xref> <sup>a</sup> </xref> </td><td align="center" rowspan="1" colspan="1">84 (81.6)</td><td align="center" rowspan="1" colspan="1">21 (87.5)</td><td align="center" rowspan="1" colspan="1">63 (79.7)</td><td align="center" rowspan="1" colspan="1">0.551</td></tr><tr><td align="left" rowspan="1" colspan="1">Hypertension</td><td align="center" rowspan="1" colspan="1">42 (40.8)</td><td align="center" rowspan="1" colspan="1">11 (45.8)</td><td align="center" rowspan="1" colspan="1">31 (39.2)</td><td align="center" rowspan="1" colspan="1">0.012<xref>*</xref> </td></tr><tr><td align="left" rowspan="1" colspan="1">Hyperlipidemia</td><td align="center" rowspan="1" colspan="1">21 (20.4)</td><td align="center" rowspan="1" colspan="1">11 (45.8)</td><td align="center" rowspan="1" colspan="1">10 (12.7)</td><td align="center" rowspan="1" colspan="1"/></tr><tr><td align="left" rowspan="1" colspan="1">Hyperuricemia</td><td align="center" rowspan="1" colspan="1">18 (17.5)</td><td align="center" rowspan="1" colspan="1">1 (4.2)</td><td align="center" rowspan="1" colspan="1">17 (21.5)</td><td align="center" rowspan="1" colspan="1"/></tr><tr><td align="left" rowspan="1" colspan="1">Diabetes</td><td align="center" rowspan="1" colspan="1">26 (25.2)</td><td align="center" rowspan="1" colspan="1">10 (41.7)</td><td align="center" rowspan="1" colspan="1">16 (20.3)</td><td align="center" rowspan="1" colspan="1"/></tr><tr><td align="left" rowspan="1" colspan="1">Heart disease</td><td align="center" rowspan="1" colspan="1">11 (10.7)</td><td align="center" rowspan="1" colspan="1">4 (16.7)</td><td align="center" rowspan="1" colspan="1">7 (8.9)</td><td align="center" rowspan="1" colspan="1"/></tr><tr><td align="left" rowspan="1" colspan="1">Respiratory disease</td><td align="center" rowspan="1" colspan="1">6 (5.8)</td><td align="center" rowspan="1" colspan="1">1 (4.2)</td><td align="center" rowspan="1" colspan="1">5 (2.5)</td><td align="center" rowspan="1" colspan="1"/></tr><tr><td align="left" rowspan="1" colspan="1">Hepatitis</td><td align="center" rowspan="1" colspan="1">3 (2.9)</td><td align="center" rowspan="1" colspan="1">1 (4.2)</td><td align="center" rowspan="1" colspan="1">2 (2.5)</td><td align="center" rowspan="1" colspan="1"/></tr><tr><td align="left" rowspan="1" colspan="1">Stroke</td><td align="center" rowspan="1" colspan="1">7 (6.8)</td><td align="center" rowspan="1" colspan="1">1 (4.2)</td><td align="center" rowspan="1" colspan="1">6 (7.6)</td><td align="center" rowspan="1" colspan="1"/></tr><tr><td align="left" rowspan="1" colspan="1">Other carcinoma</td><td align="center" rowspan="1" colspan="1">20 (19.4)</td><td align="center" rowspan="1" colspan="1">1 (4.2)</td><td align="center" rowspan="1" colspan="1">19 (24.1)</td><td align="center" rowspan="1" colspan="1"/></tr><tr><td align="left" rowspan="1" colspan="1">Others</td><td align="center" rowspan="1" colspan="1">16 (15.5)</td><td align="center" rowspan="1" colspan="1">5 (20.8)</td><td align="center" rowspan="1" colspan="1">11 (13.9)</td><td align="center" rowspan="1" colspan="1"/></tr></tbody></table>The perioperative factors are presented in Table 2. No significant differences were observed between the groups in terms of urinary diversion type, console time, days to oral intake, or days to pelvic drain removal. However, the operation time was shorter in the Elderly group (393.5 [343.5–449.8] min) compared to the Younger group (442.0 [405.5–522.5] min) (p = 0.0286). Regarding urinary diversion, the operative time for ureterocutaneostomy was significantly shorter in the Younger group. Conversely, the postoperative hospital stay was shorter in the Younger group (25.0 [21.5–31.5] days) compared to the Elderly group (34.5 [23.8–38.5] days) (p = 0.0318).
TABLE 2: Perioperative factors.
<table><col align="left"/><col align="center"/><col align="center"/><col align="center"/><col align="center"/><thead><tr><th align="left" rowspan="1" colspan="1"/><th align="center" rowspan="1" colspan="1">Overall (<italic>n</italic> = 103)</th><th align="center" rowspan="1" colspan="1">Elderly group (<italic>n</italic> = 24) (age ≥ 80)</th><th align="center" rowspan="1" colspan="1">Younger group (<italic>n</italic> = 79) (age < 80)</th><th align="center" rowspan="1" colspan="1"> <italic>p</italic> </th></tr></thead><tbody><tr><td align="left" rowspan="1" colspan="1">Preoperative serum albumin</td><td align="center" rowspan="1" colspan="1">3.8 (3.6–4.2)</td><td align="center" rowspan="1" colspan="1">3.7 (3.5–4.1)</td><td align="center" rowspan="1" colspan="1">3.9 (3.6–4.2)</td><td align="center" rowspan="1" colspan="1">0.076</td></tr><tr><td align="left" rowspan="1" colspan="1">Preoperative serum CRP</td><td align="center" rowspan="1" colspan="1">0.130 (0.058–0.298)</td><td align="center" rowspan="1" colspan="1">0.130 (0.040–0.450)</td><td align="center" rowspan="1" colspan="1">0.100 (0.055–0.265)</td><td align="center" rowspan="1" colspan="1">0.931</td></tr><tr><td align="left" rowspan="1" colspan="1">Preoperative NLR</td><td align="center" rowspan="1" colspan="1">2.380 (1.492–3.166)</td><td align="center" rowspan="1" colspan="1">2.346 (1.578–2.771)</td><td align="center" rowspan="1" colspan="1">2.418 (1.492–3.482)</td><td align="center" rowspan="1" colspan="1">0.588</td></tr><tr><td align="left" colspan="5" rowspan="1">Urinary diversion, <italic>n</italic> (%)</td></tr><tr><td align="left" rowspan="1" colspan="1">Ileal conduit (ICUD)</td><td align="center" rowspan="1" colspan="1">49 (47.6)</td><td align="center" rowspan="1" colspan="1">17 (70.8)</td><td align="center" rowspan="1" colspan="1">32 (40.5)</td><td align="center" rowspan="4" colspan="1">0.070</td></tr><tr><td align="left" rowspan="1" colspan="1">Ileal conduit (ECUD)</td><td align="center" rowspan="1" colspan="1">29 (28.2)</td><td align="center" rowspan="1" colspan="1">4 (16.7)</td><td align="center" rowspan="1" colspan="1">25 (31.6)</td></tr><tr><td align="left" rowspan="1" colspan="1">Neobladder</td><td align="center" rowspan="1" colspan="1">7 (6.8)</td><td align="center" rowspan="1" colspan="1">0 (0.0)</td><td align="center" rowspan="1" colspan="1">7 (8.9)</td></tr><tr><td align="left" rowspan="1" colspan="1">Cutaneous ureterostomy</td><td align="center" rowspan="1" colspan="1">18 (17.5)</td><td align="center" rowspan="1" colspan="1">3 (12.5)</td><td align="center" rowspan="1" colspan="1">15 (19.0)</td></tr><tr><td align="left" rowspan="1" colspan="1">Operative time (min), median (IQR)</td><td align="center" rowspan="1" colspan="1">433.0 (381.5–512.5)</td><td align="center" rowspan="1" colspan="1">393.5 (343.5–449.8)</td><td align="center" rowspan="1" colspan="1">442.0 (405.5–522.5)</td><td align="center" rowspan="1" colspan="1">0.029<xref>*</xref> </td></tr><tr><td align="left" rowspan="1" colspan="1">Console time (min), median (IQR)</td><td align="center" rowspan="1" colspan="1">275.0 (221.0–365.0)</td><td align="center" rowspan="1" colspan="1">239.5 (224.0–334.0)</td><td align="center" rowspan="1" colspan="1">278.0 (220.0–365.5)</td><td align="center" rowspan="1" colspan="1">0.270</td></tr><tr><td align="left" rowspan="1" colspan="1">Days of resumption of oral intake, median (IQR)</td><td align="center" rowspan="1" colspan="1">3.0 (2.0–5.0)</td><td align="center" rowspan="1" colspan="1">3.0 (2.0–4.5)</td><td align="center" rowspan="1" colspan="1">3.0 (2.0–5.0)</td><td align="center" rowspan="1" colspan="1">0.416</td></tr><tr><td align="left" rowspan="1" colspan="1">Days of drain removal, median (IQR)</td><td align="center" rowspan="1" colspan="1">8.0 (7.0–14.0)</td><td align="center" rowspan="1" colspan="1">8.0 (7.0–15.25)</td><td align="center" rowspan="1" colspan="1">8.0 (7.0–14.0)</td><td align="center" rowspan="1" colspan="1">0.615</td></tr><tr><td align="left" rowspan="1" colspan="1">Days of hospitalization, median (IQR)</td><td align="center" rowspan="1" colspan="1">26.0 (22.0–36.5)</td><td align="center" rowspan="1" colspan="1">34.5 (23.8–38.5)</td><td align="center" rowspan="1" colspan="1">25.0 (21.5–31.5)</td><td align="center" rowspan="1" colspan="1">0.032<xref>*</xref> </td></tr></tbody></table>Thirty‐day complications are shown in Table 3. There were no significant differences in the frequency and grade of complications between the two groups. However, the incidence of ileus was significantly higher in the Elderly group (p = 0.0180). Ileus was caused by the absence of intestinal peristalsis or motility in all cases; there were no cases of mechanical obstruction in this cohort.
TABLE 3: Complications.
<table><col align="left"/><col align="center"/><col align="center"/><col align="center"/><col align="center"/><thead><tr><th align="left" rowspan="1" colspan="1"/><th align="center" rowspan="1" colspan="1">Overall (<italic>n</italic> = 103)</th><th align="center" rowspan="1" colspan="1">Elderly group (<italic>n</italic> = 24) (age ≥ 80)</th><th align="center" rowspan="1" colspan="1">Younger group (<italic>n</italic> = 79) (age < 80)</th><th align="center" rowspan="1" colspan="1"> <italic>p</italic> </th></tr></thead><tbody><tr><td align="left" rowspan="1" colspan="1">Overall complications, <italic>n</italic> (%)</td><td align="center" rowspan="1" colspan="1">67 (65.0)</td><td align="center" rowspan="1" colspan="1">16 (66.7)</td><td align="center" rowspan="1" colspan="1">51 (64.6)</td><td align="center" rowspan="1" colspan="1">1.000</td></tr><tr><td align="left" colspan="5" rowspan="1">Grade of complication (Clavien–Dindo)</td></tr><tr><td align="left" rowspan="1" colspan="1">Grade 0</td><td align="center" rowspan="1" colspan="1">38 (36.9)</td><td align="center" rowspan="1" colspan="1">10 (41.7)</td><td align="center" rowspan="1" colspan="1">28 (35.4)</td><td align="center" rowspan="5" colspan="1">0.670</td></tr><tr><td align="left" rowspan="1" colspan="1">Grade I</td><td align="center" rowspan="1" colspan="1">20 (19.4)</td><td align="center" rowspan="1" colspan="1">6 (25.0)</td><td align="center" rowspan="1" colspan="1">14 (17.7)</td></tr><tr><td align="left" rowspan="1" colspan="1">Grade II</td><td align="center" rowspan="1" colspan="1">31 (30.1)</td><td align="center" rowspan="1" colspan="1">6 (25.0)</td><td align="center" rowspan="1" colspan="1">25 (31.6)</td></tr><tr><td align="left" rowspan="1" colspan="1">Grade III</td><td align="center" rowspan="1" colspan="1">14 (13.6)</td><td align="center" rowspan="1" colspan="1">2 (8.3)</td><td align="center" rowspan="1" colspan="1">12 (15.2)</td></tr><tr><td align="left" rowspan="1" colspan="1">> Grade IV</td><td align="center" rowspan="1" colspan="1">0 (0.0)</td><td align="center" rowspan="1" colspan="1">0 (0.0)</td><td align="center" rowspan="1" colspan="1">0 (0.0)</td></tr><tr><td align="left" colspan="5" rowspan="1">Type of complication</td></tr><tr><td align="left" rowspan="1" colspan="1">Anemia</td><td align="center" rowspan="1" colspan="1">4 (3.9)</td><td align="center" rowspan="1" colspan="1">0 (0.0)</td><td align="center" rowspan="1" colspan="1">4 (5.1)</td><td align="center" rowspan="1" colspan="1">0.571</td></tr><tr><td align="left" rowspan="1" colspan="1">Fever</td><td align="center" rowspan="1" colspan="1">11 (10.7)</td><td align="center" rowspan="1" colspan="1">1 (4.2)</td><td align="center" rowspan="1" colspan="1">10 (12.7)</td><td align="center" rowspan="1" colspan="1">0.450</td></tr><tr><td align="left" rowspan="1" colspan="1">Wound infection</td><td align="center" rowspan="1" colspan="1">5 (4.9)</td><td align="center" rowspan="1" colspan="1">1 (4.2)</td><td align="center" rowspan="1" colspan="1">4 (5.1)</td><td align="center" rowspan="1" colspan="1">1.000</td></tr><tr><td align="left" rowspan="1" colspan="1">Pyelonephritis</td><td align="center" rowspan="1" colspan="1">10 (9.7)</td><td align="center" rowspan="1" colspan="1">2 (8.3)</td><td align="center" rowspan="1" colspan="1">8 (10.1)</td><td align="center" rowspan="1" colspan="1">1.000</td></tr><tr><td align="left" rowspan="1" colspan="1">Epididymitis</td><td align="center" rowspan="1" colspan="1">1 (1.0)</td><td align="center" rowspan="1" colspan="1">0 (0.0)</td><td align="center" rowspan="1" colspan="1">1 (1.3)</td><td align="center" rowspan="1" colspan="1">1.000</td></tr><tr><td align="left" rowspan="1" colspan="1">Pelvic inflammatory disease</td><td align="center" rowspan="1" colspan="1">4 (3.9)</td><td align="center" rowspan="1" colspan="1">1 (4.2)</td><td align="center" rowspan="1" colspan="1">3 (3.8)</td><td align="center" rowspan="1" colspan="1">1.000</td></tr><tr><td align="left" rowspan="1" colspan="1">Lymphorrhea</td><td align="center" rowspan="1" colspan="1">2 (1.9)</td><td align="center" rowspan="1" colspan="1">0 (0.0)</td><td align="center" rowspan="1" colspan="1">2 (2.5)</td><td align="center" rowspan="1" colspan="1">1.000</td></tr><tr><td align="left" rowspan="1" colspan="1">Ileus</td><td align="center" rowspan="1" colspan="1">14 (13.6)</td><td align="center" rowspan="1" colspan="1">7 (29.2)</td><td align="center" rowspan="1" colspan="1">7 (8.9)</td><td align="center" rowspan="1" colspan="1">0.018<xref>*</xref> </td></tr><tr><td align="left" rowspan="1" colspan="1">Ureteral obstruction</td><td align="center" rowspan="1" colspan="1">2 (1.9)</td><td align="center" rowspan="1" colspan="1">0 (0.0)</td><td align="center" rowspan="1" colspan="1">2 (2.5)</td><td align="center" rowspan="1" colspan="1">1.000</td></tr><tr><td align="left" rowspan="1" colspan="1">Anastomotic leakage</td><td align="center" rowspan="1" colspan="1">4 (3.9)</td><td align="center" rowspan="1" colspan="1">0 (0.0)</td><td align="center" rowspan="1" colspan="1">4 (5.1)</td><td align="center" rowspan="1" colspan="1">0.571</td></tr><tr><td align="left" rowspan="1" colspan="1">Parastomal hernia</td><td align="center" rowspan="1" colspan="1">2 (1.9)</td><td align="center" rowspan="1" colspan="1">1 (4.2)</td><td align="center" rowspan="1" colspan="1">1 (1.3)</td><td align="center" rowspan="1" colspan="1">0.413</td></tr><tr><td align="left" rowspan="1" colspan="1">Nausea</td><td align="center" rowspan="1" colspan="1">3 (2.9)</td><td align="center" rowspan="1" colspan="1">0 (0.0)</td><td align="center" rowspan="1" colspan="1">3 (3.8)</td><td align="center" rowspan="1" colspan="1">1.000</td></tr><tr><td align="left" rowspan="1" colspan="1">Decreased oxygenation</td><td align="center" rowspan="1" colspan="1">1 (1.0)</td><td align="center" rowspan="1" colspan="1">1 (4.2)</td><td align="center" rowspan="1" colspan="1">0 (0.0)</td><td align="center" rowspan="1" colspan="1">0.233</td></tr><tr><td align="left" rowspan="1" colspan="1">Deep vein thrombosis</td><td align="center" rowspan="1" colspan="1">1 (1.0)</td><td align="center" rowspan="1" colspan="1">0 (0.0)</td><td align="center" rowspan="1" colspan="1">1 (1.3)</td><td align="center" rowspan="1" colspan="1">1.000</td></tr><tr><td align="left" rowspan="1" colspan="1">Compartment syndrome</td><td align="center" rowspan="1" colspan="1">1 (1.0)</td><td align="center" rowspan="1" colspan="1">0 (0.0)</td><td align="center" rowspan="1" colspan="1">1 (1.3)</td><td align="center" rowspan="1" colspan="1">1.000</td></tr></tbody></table>The cutoff level for the duration of hospitalization was determined using a receiver operating characteristic curve targeting patients aged > 80 years (Figure 1). Univariate and multivariate analyses were conducted for each factor based on the identified cutoff of 31 days (Table 4). The analyses revealed that ileus, number of days to drain removal, and age were independent factors. However, neither operative time nor the type of urinary diversion was identified as an independent factor.
Setting cut‐off values using ROC curve analysis for days of hospitalization between the Elder and Younger groups.
TABLE 4: Univariate and multivariate logistic regression analysis predicting the days of hospitalization over 30 days.
<table><col align="left"/><col align="center"/><col align="center"/><col align="center"/><col align="center"/><col align="center"/><thead><tr><th align="left" rowspan="2" colspan="1">Factors</th><th align="center" colspan="2" rowspan="1">Univariate</th><th align="center" colspan="3" rowspan="1">Multivariate</th></tr><tr><th align="center" rowspan="1" colspan="1">Odds ratio (95% CI)</th><th align="center" rowspan="1" colspan="1"> <italic>p</italic> </th><th align="center" rowspan="1" colspan="1">Odds ratio (95% CI)</th><th align="center" rowspan="1" colspan="1"> <italic>p</italic> </th><th align="center" rowspan="1" colspan="1">VIF</th></tr></thead><tbody><tr><td align="left" rowspan="1" colspan="1">Intercept</td><td align="center" rowspan="1" colspan="1"/><td align="center" rowspan="1" colspan="1"/><td align="center" rowspan="1" colspan="1">0.000123 (0.0000000538–0.279)</td><td align="center" rowspan="1" colspan="1">0.022<xref>*</xref> </td><td align="center" rowspan="1" colspan="1"/></tr><tr><td align="left" rowspan="1" colspan="1">Age</td><td align="center" rowspan="1" colspan="1">1.070 (1.010–1.140)</td><td align="center" rowspan="1" colspan="1">0.017<xref>*</xref> </td><td align="center" rowspan="1" colspan="1">1.08 (1.01–1.16)</td><td align="center" rowspan="1" colspan="1">0.032<xref>*</xref> </td><td align="center" rowspan="1" colspan="1">1.178</td></tr><tr><td align="left" rowspan="1" colspan="1">Male sex</td><td align="center" rowspan="1" colspan="1">0.556 (0.203–1.520)</td><td align="center" rowspan="1" colspan="1">0.253</td><td align="center" rowspan="1" colspan="1"/><td align="center" rowspan="1" colspan="1"/><td align="center" rowspan="1" colspan="1"/></tr><tr><td align="left" rowspan="1" colspan="1">BMI</td><td align="center" rowspan="1" colspan="1">1.040 (0.930–1.170)</td><td align="center" rowspan="1" colspan="1">0.467</td><td align="center" rowspan="1" colspan="1"/><td align="center" rowspan="1" colspan="1"/><td align="center" rowspan="1" colspan="1"/></tr><tr><td align="left" rowspan="1" colspan="1">ASA‐PS class III or more</td><td align="center" rowspan="1" colspan="1">1.960 (0.782–4.900)</td><td align="center" rowspan="1" colspan="1">0.152</td><td align="center" rowspan="1" colspan="1">2.78 (0.877–8.820)</td><td align="center" rowspan="1" colspan="1">0.083</td><td align="center" rowspan="1" colspan="1">1.152</td></tr><tr><td align="left" rowspan="1" colspan="1">Preoperative serum Albumin</td><td align="center" rowspan="1" colspan="1">0.493 (0.204–1.200)</td><td align="center" rowspan="1" colspan="1">0.118</td><td align="center" rowspan="1" colspan="1">1.14 (0.368–3.540)</td><td align="center" rowspan="1" colspan="1">0.819</td><td align="center" rowspan="1" colspan="1">1.146</td></tr><tr><td align="left" rowspan="1" colspan="1">Preoperative serum CRP</td><td align="center" rowspan="1" colspan="1">1.050 (0.784–1.410)</td><td align="center" rowspan="1" colspan="1">0.737</td><td align="center" rowspan="1" colspan="1"/><td align="center" rowspan="1" colspan="1"/><td align="center" rowspan="1" colspan="1"/></tr><tr><td align="left" rowspan="1" colspan="1">Preoperative NLR</td><td align="center" rowspan="1" colspan="1">0.936 (0.764–1.150)</td><td align="center" rowspan="1" colspan="1">0.520</td><td align="center" rowspan="1" colspan="1"/><td align="center" rowspan="1" colspan="1"/><td align="center" rowspan="1" colspan="1"/></tr><tr><td align="left" colspan="6" rowspan="1">Urinary diversion</td></tr><tr><td align="left" rowspan="1" colspan="1">Ileal conduit (ICUD)</td><td align="center" rowspan="1" colspan="1">2.110 (0.596–7.480)</td><td align="center" rowspan="1" colspan="1">0.246</td><td align="center" rowspan="1" colspan="1"/><td align="center" rowspan="1" colspan="1"/><td align="center" rowspan="1" colspan="1"/></tr><tr><td align="left" rowspan="1" colspan="1">Ileal conduit (ECUD)</td><td align="center" rowspan="1" colspan="1">1.510 (0.462–4.930)</td><td align="center" rowspan="1" colspan="1">0.495</td><td align="center" rowspan="1" colspan="1"/><td align="center" rowspan="1" colspan="1"/><td align="center" rowspan="1" colspan="1"/></tr><tr><td align="left" rowspan="1" colspan="1">Neobladder</td><td align="center" rowspan="1" colspan="1">0.433 (0.041–4.570)</td><td align="center" rowspan="1" colspan="1">0.486</td><td align="center" rowspan="1" colspan="1"/><td align="center" rowspan="1" colspan="1"/><td align="center" rowspan="1" colspan="1"/></tr><tr><td align="left" rowspan="1" colspan="1">Cutaneous ureterostomy</td><td align="center" rowspan="1" colspan="1">1.000 (reference)</td><td align="center" rowspan="1" colspan="1">1.000 (reference)</td><td align="center" rowspan="1" colspan="1"/><td align="center" rowspan="1" colspan="1"/><td align="center" rowspan="1" colspan="1"/></tr><tr><td align="left" rowspan="1" colspan="1">Operative time</td><td align="center" rowspan="1" colspan="1">0.997 (0.993–1.000)</td><td align="center" rowspan="1" colspan="1">0.255</td><td align="center" rowspan="1" colspan="1"/><td align="center" rowspan="1" colspan="1"/><td align="center" rowspan="1" colspan="1"/></tr><tr><td align="left" rowspan="1" colspan="1">Complications (Clavien‐Dindo Grade 3 or more)</td><td align="center" rowspan="1" colspan="1">2.710 (0.915–8.020)</td><td align="center" rowspan="1" colspan="1">0.072</td><td align="center" rowspan="1" colspan="1">3.21 (0.772–13.3)</td><td align="center" rowspan="1" colspan="1">0.109</td><td align="center" rowspan="1" colspan="1">1.142</td></tr><tr><td align="left" rowspan="1" colspan="1">Ileus</td><td align="center" rowspan="1" colspan="1">8.880 (2.290–34.500)</td><td align="center" rowspan="1" colspan="1">0.002<xref>*</xref> </td><td align="center" rowspan="1" colspan="1">6.56 (1.03–41.80)</td><td align="center" rowspan="1" colspan="1">0.047<xref>*</xref> </td><td align="center" rowspan="1" colspan="1">1.485</td></tr><tr><td align="left" rowspan="1" colspan="1">Days of resumption of oral intake</td><td align="center" rowspan="1" colspan="1">1.110 (1.010–1.230)</td><td align="center" rowspan="1" colspan="1">0.028<xref>*</xref> </td><td align="center" rowspan="1" colspan="1">1.02 (0.89–1.18)</td><td align="center" rowspan="1" colspan="1">0.748</td><td align="center" rowspan="1" colspan="1">1.381</td></tr><tr><td align="left" rowspan="1" colspan="1">Days of drain removal</td><td align="center" rowspan="1" colspan="1">1.120 (1.050–1.200)</td><td align="center" rowspan="1" colspan="1">0.001<xref>*</xref> </td><td align="center" rowspan="1" colspan="1">1.12 (1.04–1.21)</td><td align="center" rowspan="1" colspan="1">0.004<xref>*</xref> </td><td align="center" rowspan="1" colspan="1">1.094</td></tr></tbody></table>Moreover, univariate and multivariate analyses were performed to explore the predictive incidence of ileus (Table 5). Additionally, age was identified as a predictive factor for ileus.
TABLE 5: Univariate and multivariate logistic regression analysis predicting incidence of ileus.
<table><col align="left"/><col align="center"/><col align="center"/><col align="center"/><col align="center"/><col align="center"/><thead><tr><th align="left" rowspan="2" colspan="1">Factors</th><th align="center" colspan="2" rowspan="1">Univariate</th><th align="center" colspan="3" rowspan="1">Multivariate</th></tr><tr><th align="center" rowspan="1" colspan="1">Odds ratio (95% CI)</th><th align="center" rowspan="1" colspan="1"> <italic>p</italic> </th><th align="center" rowspan="1" colspan="1">Odds ratio (95% CI)</th><th align="center" rowspan="1" colspan="1"> <italic>p</italic> </th><th align="center" rowspan="1" colspan="1">VIF</th></tr></thead><tbody><tr><td align="left" colspan="6" rowspan="1">Intercept</td></tr><tr><td align="left" rowspan="1" colspan="1">Age</td><td align="center" rowspan="1" colspan="1">1.170 (1.040–1.310)</td><td align="center" rowspan="1" colspan="1">0.007<xref>*</xref> </td><td align="center" rowspan="1" colspan="1">1.160 (1.030–1.300)</td><td align="center" rowspan="1" colspan="1">0.012<xref>*</xref> </td><td align="center" rowspan="1" colspan="1">1.002</td></tr><tr><td align="left" rowspan="1" colspan="1">BMI</td><td align="center" rowspan="1" colspan="1">0.939 (0.793–1.110)</td><td align="center" rowspan="1" colspan="1">0.466</td><td align="center" rowspan="1" colspan="1"/><td align="center" rowspan="1" colspan="1"/><td align="center" rowspan="1" colspan="1"/></tr><tr><td align="left" rowspan="1" colspan="1">Male sex</td><td align="center" rowspan="1" colspan="1">0.804 (0.201–3.220)</td><td align="center" rowspan="1" colspan="1">0.757</td><td align="center" rowspan="1" colspan="1"/><td align="center" rowspan="1" colspan="1"/><td align="center" rowspan="1" colspan="1"/></tr><tr><td align="left" rowspan="1" colspan="1">ASA‐PS class III or more</td><td align="center" rowspan="1" colspan="1">0.831 (0.212–3.250)</td><td align="center" rowspan="1" colspan="1">0.790</td><td align="center" rowspan="1" colspan="1"/><td align="center" rowspan="1" colspan="1"/><td align="center" rowspan="1" colspan="1"/></tr><tr><td align="left" rowspan="1" colspan="1">Preoperative serum albumin</td><td align="center" rowspan="1" colspan="1">0.306 (0.092–1.020)</td><td align="center" rowspan="1" colspan="1">0.054<xref>*</xref> </td><td align="center" rowspan="1" colspan="1">0.369 (0.092–1.480)</td><td align="center" rowspan="1" colspan="1">0.159</td><td align="center" rowspan="1" colspan="1">1.002</td></tr><tr><td align="left" rowspan="1" colspan="1">Preoperative serum CRP</td><td align="center" rowspan="1" colspan="1">1.080 (0.746–1.570)</td><td align="center" rowspan="1" colspan="1">0.681</td><td align="center" rowspan="1" colspan="1"/><td align="center" rowspan="1" colspan="1"/><td align="center" rowspan="1" colspan="1"/></tr><tr><td align="left" rowspan="1" colspan="1">Preoperative NLR</td><td align="center" rowspan="1" colspan="1">1.000 (0.787–1.280)</td><td align="center" rowspan="1" colspan="1">0.986</td><td align="center" rowspan="1" colspan="1"/><td align="center" rowspan="1" colspan="1"/><td align="center" rowspan="1" colspan="1"/></tr><tr><td align="left" colspan="6" rowspan="1">Urinary diversion</td></tr><tr><td align="left" rowspan="1" colspan="1">Ileal conduit (ICUD)</td><td align="center" rowspan="1" colspan="1">2.720 (0.279–26.500)</td><td align="center" rowspan="1" colspan="1">0.389</td><td align="center" rowspan="1" colspan="1"/><td align="center" rowspan="1" colspan="1"/><td align="center" rowspan="1" colspan="1"/></tr><tr><td align="left" rowspan="1" colspan="1">Ileal conduit (ECUD)</td><td align="center" rowspan="1" colspan="1">3.320 (0.385–28.600)</td><td align="center" rowspan="1" colspan="1">0.275</td><td align="center" rowspan="1" colspan="1"/><td align="center" rowspan="1" colspan="1"/><td align="center" rowspan="1" colspan="1"/></tr><tr><td align="left" rowspan="1" colspan="1">Neobladder</td><td align="center" rowspan="1" colspan="1">2.830 (0.152–52.700)</td><td align="center" rowspan="1" colspan="1">0.485</td><td align="center" rowspan="1" colspan="1"/><td align="center" rowspan="1" colspan="1"/><td align="center" rowspan="1" colspan="1"/></tr><tr><td align="left" rowspan="1" colspan="1">Cutaneous ureterostomy</td><td align="center" rowspan="1" colspan="1">1.000 (reference)</td><td align="center" rowspan="1" colspan="1">1.000 (reference)</td><td align="center" rowspan="1" colspan="1"/><td align="center" rowspan="1" colspan="1"/><td align="center" rowspan="1" colspan="1"/></tr><tr><td align="left" rowspan="1" colspan="1">Operative time</td><td align="center" rowspan="1" colspan="1">1.000 (0.994–1.010)</td><td align="center" rowspan="1" colspan="1">0.944</td><td align="center" rowspan="1" colspan="1"/><td align="center" rowspan="1" colspan="1"/><td align="center" rowspan="1" colspan="1"/></tr><tr><td align="left" rowspan="1" colspan="1">Complications (Clavien–Dindo Grade 3 or more)</td><td align="center" rowspan="1" colspan="1">1.590 (0.391–6.500)</td><td align="center" rowspan="1" colspan="1">0.515</td><td align="center" rowspan="1" colspan="1"/><td align="center" rowspan="1" colspan="1"/><td align="center" rowspan="1" colspan="1"/></tr><tr><td align="left" rowspan="1" colspan="1">Days of drain removal</td><td align="center" rowspan="1" colspan="1">1.030 (0.971–1.100)</td><td align="center" rowspan="1" colspan="1">0.304</td><td align="center" rowspan="1" colspan="1"/><td align="center" rowspan="1" colspan="1"/><td align="center" rowspan="1" colspan="1"/></tr></tbody></table>To further validate whether ileus risk increases progressively with age, we divided the patients into three subgroups based on a cutoff of 70 years—Group A: patients aged ≥ 80 years, Group B: patients aged between 70 and 80 years, and Group C: patients aged less than 70 years. Regarding patient characteristics, significant differences were observed only in age, ASA‐PS score, and details of comorbidities (Table S1). Furthermore, although no differences were observed in perioperative factors (Table S2) and overall incidence of complications, multiple comparisons revealed a significant difference in the incidence of ileus (p = 0.024) (Table S3).
Discussion
4
Our findings revealed that, even in elderly patients, RARC resulted in only a slight extension of hospital stay, with reduced operation time and without significantly affecting the incidence or severity of overall complications. Postoperative ileus was an independent risk factor for prolonged hospital stay. Importantly, this study was conducted in a patient cohort with significantly favorable ASA‐PS scores among the elderly population, and surgery was performed in elderly patients aged 80 years or older who were in good general condition. De Groote et al. [17] reported that patients aged ≥ 80 years undergoing RARC for bladder cancer did not have a higher risk of peri‐ and postoperative morbidity and mortality rate and had a similar 3‐year recurrence‐free survival. Xie et al. [18] also reported that elderly patients who underwent RARC had a similar risk of perioperative complications and recurrence‐free survival as younger patients. These studies suggest that RARC could be performed in elderly patients with complication rates and oncologic outcomes similar to those in younger patients.
In conventional ORC and laparoscopic radical cystectomy (LRC), no differences in overall or severe complications have been reported in elderly patients, as evidenced in our study [19, 20, 21]. However, in contrast to the RARC in our report, it has been noted that there is no difference in operative time between ORC and LRC, but it could be shorter in elderly patients undergoing ORC [20]. This may have been influenced by surgical strategies to reduce burden, such as choosing simple urinary diversion or reducing lymph node dissection in elderly patients [22]. A probability for the differences in the results of this study might be due to the effect of bias, as this study was conducted on a small sample size from a single institution.
Previous studies have reported inconsistent operative times. However, our study showed that the Younger group had longer operative times than the Older group. This might be because younger patients had higher clinical T and N stages and underwent more difficult surgeries, or because the proportion of neobladders in urinary diversion was higher and the surgical procedures were more complicated.
Prolonged hospitalization of elderly patients can lead to several challenges. Elderly patients are at an increased risk for loss of muscle strength and mobility due to minimal mobility caused by hospitalization, which might hamper their routine lifestyle even after discharge [23]. Furthermore, approximately 30% of elderly patients experience decreased functional independence in daily activities as a result of hospitalization [24]. On the mental aspect, there is a possibility that the delirium caused due to long‐term hospitalization may cause chronic deterioration of cognitive functions in elderly patients that might progress to dementia [25].
A novel aspect of this study is that it identified postoperative ileus and prolonged drain placement as potential factors contributing to an extended hospital stay. The study also found that early initiation of oral intake was effective in preventing ileus. Zennami et al. [26] also reported that early ambulation and oral intake after RARC may help prevent postoperative ileus. Additionally, enhanced recovery after surgery, initially developed as a multidisciplinary approach to promote postoperative recovery in gastrointestinal surgery, has been adapted to RARC and found to be advantageous in preventing ileus [27, 28]. Notably, among the factors contributing to a hospital stay exceeding a month, preoperative factors such as ASA‐PS and perioperative factors such as urinary diversion type were not identified as significant components. Instead, only age and postoperative factors were identified. These findings suggest that elderly patients may have ileus, longer hospital stays, and related challenges, highlighting the need for judiciously designed postoperative management.
This study had two limitations. First, this was a single‐center retrospective study. Consequently, there may be variations in the operative skills of the surgeons and assistants, which could introduce differences in surgical proficiency. Additionally, selection biases, such as variations in operative time due to patient factors and urinary diversion type, cannot be entirely ruled out. Secondly, the relatively small sample size may have limited the statistical power of the analysis.
Despite these limitations, our report of RARC in elderly patients provides valuable insights. The finding that overall complication rates were not significantly affected is crucial for designing treatment regimens. Furthermore, the identification of prolonged hospital stays and the need for ileus prevention highlights the importance of meticulous postoperative management in optimizing outcomes for elderly patients undergoing RARC. No differences were observed between groups even in terms of the preoperative Barthel Index, a comprehensive geriatric assessment index that focuses on physical function. The Barthel index has also been reported to be useful for evaluating postoperative complications in abdominal surgery [29], and our results are consistent with this finding. Furthermore, although there were no significant differences in comorbidities between the two groups in this cohort, the Elderly group showed significantly more detailed complications, with a higher proportion of lifestyle‐related diseases such as hypertension and hyperlipidemia. While heart disease, including acute coronary syndrome and arrhythmia, was more prevalent in the Elderly group, the ASA‐PS score indicated better outcomes in this group, suggesting no issues with activities of daily living. The lower proportion of other carcinoma in the elderly group tends to suggest selection bias due to patient factors.
In analyses further subdividing age groups, significant differences were observed only for age, ASA‐PS score, detail of comorbidities, and the occurrence of ileus. The tendency for ASA‐PS score to decrease with increasing age might represent a limitation of this study as a potential selection bias. Differences in the detail of comorbidities also did not significantly alter the overall trends between the two groups. The novel finding from these analyses further strongly indicates that increasing age is associated with an increased risk of ileus.
In conclusion, RARC is a safe treatment option for elderly patients with bladder cancer with complication profiles comparable to those in younger patients. However, the increased risk of ileus and prolonged hospitalization in elderly patients highlights the need for cautious perioperative management to optimize outcomes in this growing population.
Author Contributions
Toshiharu Morikawa: methodology (equal), data curation (lead), formal analysis (lead), writing – original draft (lead). Shuzo Hamamoto: conceptualization (lead), methodology (lead), formal analysis (equal), writing – original draft (equal), writing – review and editing (lead). Yoshihiko Tasaki: writing – review and editing (equal). Daiki Ishikawa: writing – review and editing (equal). Maria Aoki: writing – review and editing (equal). Masakazu Gonda: writing – review and editing (equal). Nobuhiko Shimizu: writing – review and editing (equal). Takashi Nagai: writing – review and editing (equal). Toshiki Etani: writing – review and editing (equal). Taku Naiki: writing – review and editing (equal). Ryosuke Ando: writing – review and editing (equal). Kazuhiro Kanemoto: writing – review and editing (equal). Atsushi Okada: supervision (equal). Noriyasu Kawai: supervision (equal). Tohru Mogami: supervision (equal). Takahiro Yasui: supervision (lead).
Funding
The authors have nothing to report.
Ethics Statement
The study protocol was approved by the Institutional Review Board of Nagoya City University Hospital (IRB approved number: 46‐17‐0007) and conformed to the provisions of the Declaration of Helsinki, 2024. Informed consent was obtained from all patients.
Consent
All patients provided informed consent.
Conflicts of Interest
The authors declare no conflicts of interest.
Supporting information
Table S1: Patient characteristics. Table S2: Perioperative factors. Table S3: Complications.
The reference list from the paper itself. Each links out to its DOI / PubMed record.
- 1J. L. Gore , M. S. Litwin , J. Lai , et al., “Use of Radical Cystectomy for Patients With Invasive Bladder Cancer,” Journal of the National Cancer Institute 102, no. 11 (2010): 802–811, 10.1093/jnci/djq 121.20400716 PMC 3245689 · doi ↗ · pubmed ↗
- 2P. Andius , O. Damm , and S. Holmang , “Prognostic Factors in Patients With Carcinoma In Situ Treated With Intravesical Bacille Calmette‐Guerin,” Scandinavian Journal of Urology and Nephrology 38, no. 4 (2004): 285–290, 10.1080/00365590410028692.15669587 · doi ↗ · pubmed ↗
- 3P. E. Clark , N. Agarwal , M. C. Biagioli , et al., “Bladder Cancer,” Journal of the National Comprehensive Cancer Network 11, no. 4 (2013): 446–475, 10.6004/jnccn.2013.0059.23584347 · doi ↗ · pubmed ↗
- 4M. Babjuk , A. Bohle , M. Burger , et al., “EAU Guidelines on Non‐Muscle‐Invasive Urothelial Carcinoma of the Bladder: Update 2016,” European Urology 71, no. 3 (2017): 447–461, 10.1016/j.eururo.2016.05.041.27324428 · doi ↗ · pubmed ↗
- 5V. Fonteyne , P. Ost , J. Bellmunt , et al., “Curative Treatment for Muscle Invasive Bladder Cancer in Elderly Patients: A Systematic Review,” European Urology 73, no. 1 (2018): 40–50, 10.1016/j.eururo.2017.03.019.28478043 · doi ↗ · pubmed ↗
- 6A. P. Mitra , J. Cai , G. Miranda , et al., “Management Trends and Outcomes of Patients Undergoing Radical Cystectomy for Urothelial Carcinoma of the Bladder: Evolution of the University of Southern California Experience Over 3,347 Cases,” Journal of Urology 207, no. 2 (2022): 302–313, 10.1097/JU.0000000000002242.34994657 PMC 8746892 · doi ↗ · pubmed ↗
- 7A. S. Fairey , W. Kassouf , A. G. Aprikian , et al., “Age ≥ 80 Years Is Independently Associated With Survival Outcomes After Radical Cystectomy: Results From the Canadian Bladder Cancer Network Database,” Urology Oncology 30, no. 6 (2012): 825–832, 10.1016/j.urolonc.2011.07.014.21889368 · doi ↗ · pubmed ↗
- 8I. Berger , T. Martini , C. Wehrberger , et al., “Perioperative Complications and 90‐Day Mortality of Radical Cystectomy in the Elderly (75+): A Retrospective, Multicentre Study,” Urologia Internationalis 93, no. 3 (2014): 296–302, 10.1159/000357127.24642400 · doi ↗ · pubmed ↗