Coexisting in a Crowded Field: A 10-year Comparison of Procedural Volumes of Plastic Surgeons and Other Surgical Specialties in the United States
Ethan L. MacKenzie, Doruk Orgun, Kasey Leigh Wood Matabele, Samuel O. Poore

TL;DR
This study compares plastic surgeons' procedural volumes with other surgical specialties in the U.S. over 10 years, finding plastic surgeons dominate in breast reconstruction and microsurgery.
Contribution
The paper provides the first 10-year analysis of plastic surgery procedural volumes relative to other surgical specialties in the U.S.
Findings
Plastic surgeons performed the majority of breast reconstruction and microsurgery procedures in 2010 and 2020.
Plastic surgical involvement did not significantly decrease in any procedural category over the study period.
Operative times and complication rates varied inversely with case numbers across specialties.
Abstract
Plastic surgery has broad overlap with other surgical subspecialties. Regarding procedures provided by both plastic surgery and other surgical specialties in the United States, the changes in plastic surgical case volume over time have not been previously investigated. Select common procedure terminology (CPT) codes from an array of areas of practice including breast reconstruction, hand, adult craniofacial, peripheral nerve, microsurgery, and ventral hernia were extracted from the American College of Surgeons National Surgical Quality Improvement Program (ACS-NSQIP) from 2010 to 2020. Case numbers, operative times, and complication rates among surgical subspecialties were compared. Aesthetic surgery cases were excluded as they are not well captured by the NSQIP database. A total of 128,545 procedures were included. In 2010 and 2020, plastic surgeons performed 83.9% versus 89.3% of…
Genes, proteins, chemicals, diseases, species, mutations and cell lines named across the full text — each resolved to its canonical identifier and authoritative record.
Click any figure to enlarge with its caption.
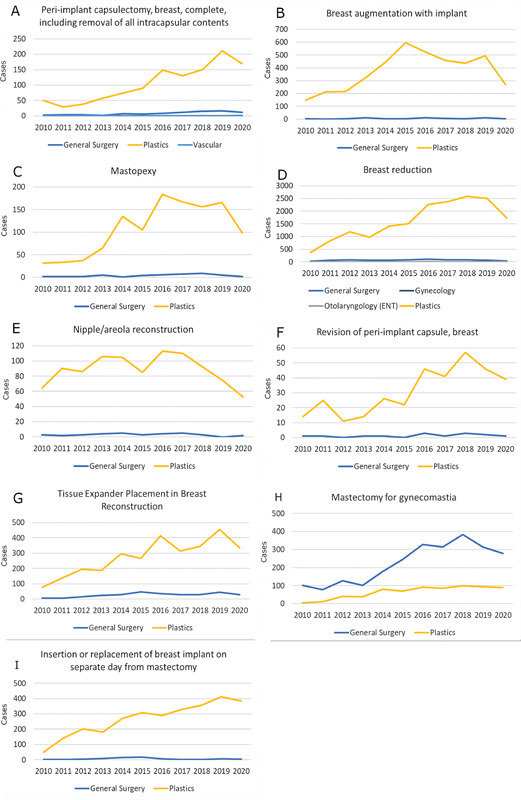 Fig. 1
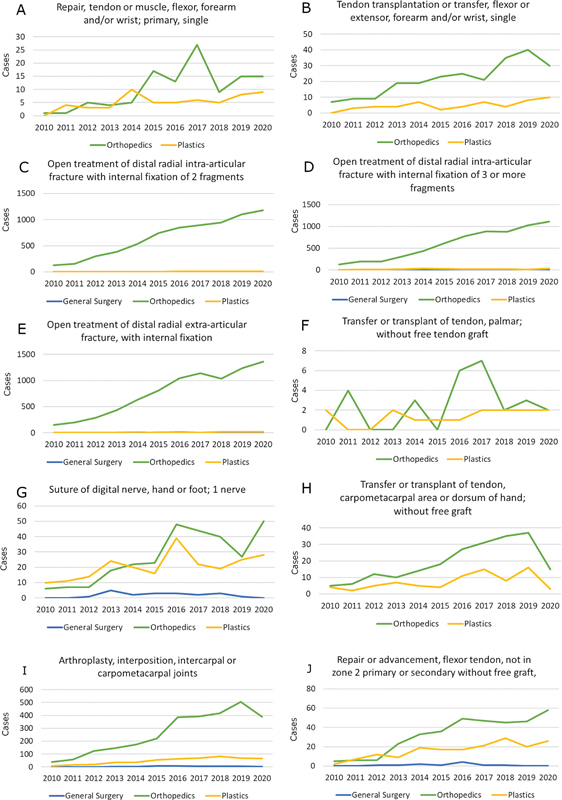 Fig. 2
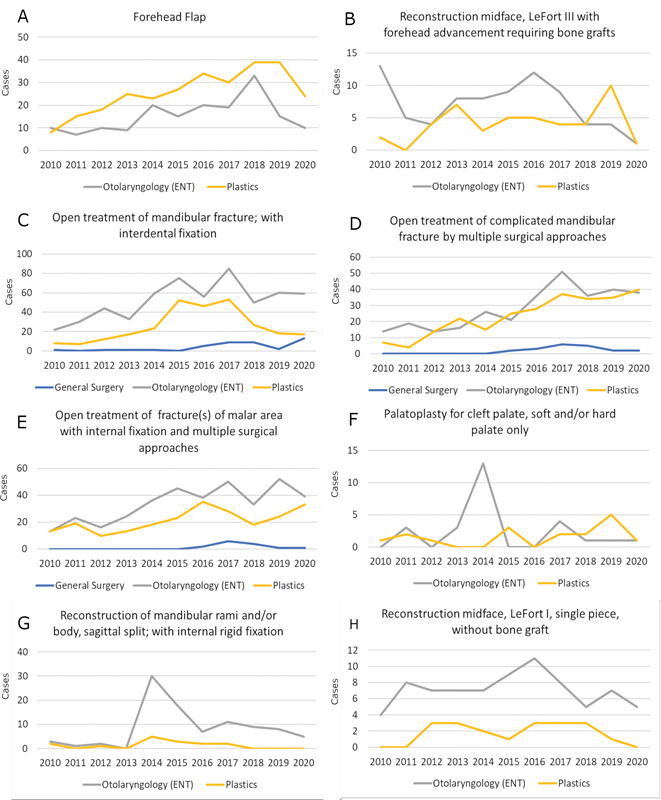 Fig. 3
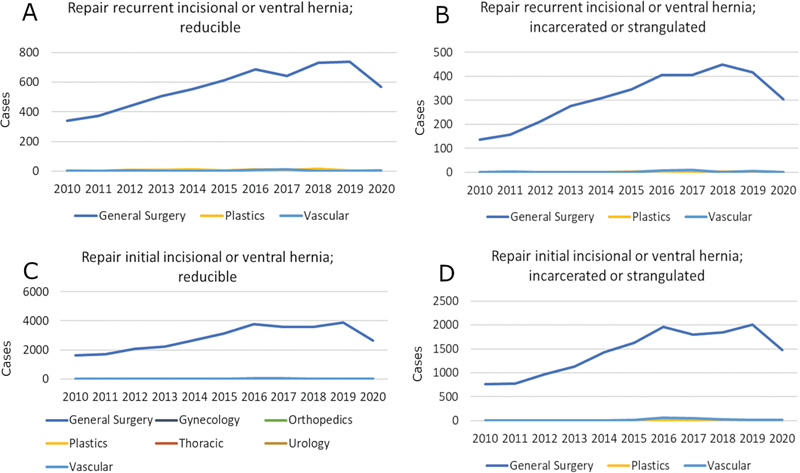 Fig. 4
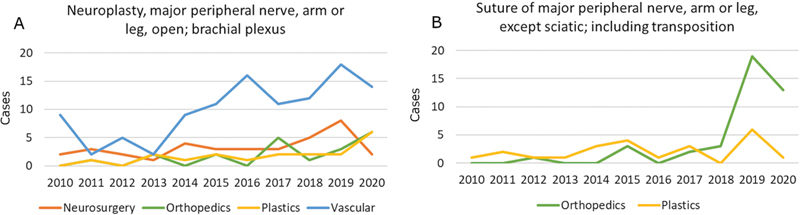 Fig. 5
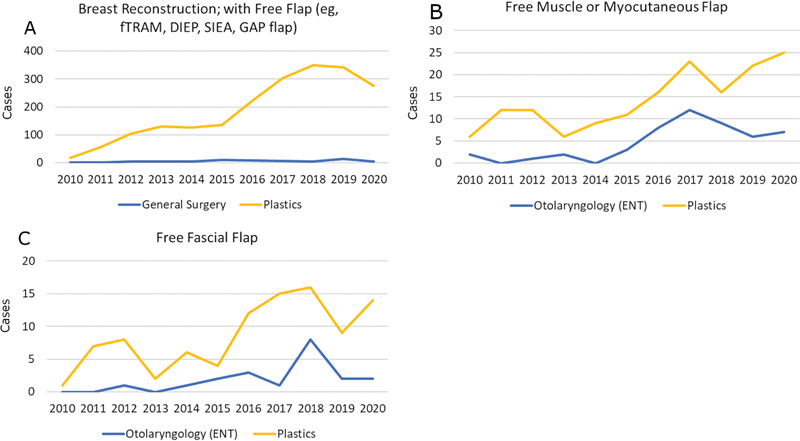 Fig. 6
| Procedure | Specialty | Median time (minutes) | Interquartile range | |
|---|---|---|---|---|
|
| Plastic surgery | 74 | 48–112 | <0.01 |
| General surgery | 45 | 30–67 | ||
|
| Plastic surgery | 118 | 83–165 | NS |
| General surgery | 104 | 77–138 | ||
|
| Plastic surgery | 152 | 111–195 | <0.01 |
| General surgery | 173 | 121–222 | ||
|
| Plastic surgery | 66 | 48–89 | <0.01 |
| General surgery | 74 | 59–109 | ||
|
| Plastic surgery | 81 | 53–129 | <0.01 |
| General surgery | 135 | 92–215 | ||
|
| Plastic surgery | 77 | 55–112 | <0.01 |
| General surgery | 92 | 64–142 | ||
|
| Plastic surgery | 59 | 36–90 | NS |
| General surgery | 43 | 32–71 | ||
|
| Plastic surgery | 77 | 51–130 | <0.01 |
| General surgery | 153 | 90–228 | ||
|
| Plastic surgery | 67 | 42–93 | <0.01 |
| General surgery | 111 | 78–159 | ||
|
| Plastic surgery | 77 | 52–106 | NS |
| General surgery | 87 | 56–105 |
| Procedure | Type of complication | Specialty |
|
Complication
| |
|---|---|---|---|---|---|
|
| Readmission | Plastic surgery | 2,929 | 59 (2.0%) | 0.04 |
| General surgery | 74 | 4 (5.4%) | |||
| Bleed requiring transfusion | Plastic surgery | 2,928 | 0 (0%) | <0.01 | |
| General surgery | 74 | 1 (1.4%) | |||
| DVT | Plastic surgery | 2,928 | 2 (0.07%) | <0.01 | |
| General surgery | 74 | 1 (1.4%) | |||
|
| Bleed requiring transfusion | Plastic surgery | 1,120 | 0 (0%) | <0.01 |
| General surgery | 133 | 1 (0.7%) | |||
|
| Superficial infection | Plastic surgery | 340 | 2 (0.6%) | 0.09 |
| General surgery | 14 | 1 (7.1%) | |||
|
| Dehiscence | Plastic surgery | 1147 | 5 (0.4%) | 0.03 |
| General surgery | 90 | 2 (2.2%) |
| Procedure | Specialty | Median time (minutes) | Interquartile range | |
|---|---|---|---|---|
|
| Plastic surgery | 60 | 48–89 | NS |
| Orthopedic surgery | 62 | 41–90 | ||
|
| Plastic surgery | 84 | 45–126 | NS |
| Orthopedic surgery | 70 | 48–105 | ||
|
| Plastic surgery | 68 | 53–89 | <0.01 |
| Orthopedic surgery | 64 | 46–84 | ||
|
| Plastic surgery | 92 | 66–109 | <0.01 for all comparisons |
| General surgery | 74 | 51–95 | ||
| Orthopedic surgery | 62 | 47–82 | ||
|
| Plastic surgery | 89 | 69–116 | <0.01 |
| Orthopedic surgery | 65 | 48–87 | ||
|
| Plastic surgery | 100 | 79–128 | <0.01 for all comparisons |
| General surgery | 68 | 54–98 | ||
| Orthopedic surgery | 68 | 50–91 | ||
|
| Plastic surgery | 59 | 40–82 | <0.01 |
| Orthopedic surgery | 81 | 57–107 | ||
|
| Plastic surgery | 56 | 40–81 | NS |
| Orthopedic surgery | 55 | 40–76 | ||
|
| Plastic surgery | 67 | 48–103 | NS |
| Orthopedic surgery | 63 | 48–82 | ||
|
| Plastic surgery | 45 | 30–59 | <0.01 |
| Orthopedic surgery | 55 | 37–78 |
| Procedure | Type of complication | Specialty |
|
Complication
| |
|---|---|---|---|---|---|
|
| Readmission | Plastic surgery | 234 | 8 (3.4%) | 0.013 |
| Orthopedic surgery | 6,557 | 82 (1.3%) | |||
| General surgery | 41 | 0 (0%) | |||
| Reoperation | Plastic surgery | 228 | 7 (3.1%) | <0.01 | |
| Orthopedic surgery | 6,416 | 61 (1.0%) | |||
| General surgery | 40 | 0 (0%) | |||
|
| Superficial infection | Plastic surgery | 522 | 18 (3.4%) | <0.01 |
| General surgery | 42 | 0 (0%) | |||
| Orthopedic surgery | 2,845 | 12 (0.4%) |
| Procedure | Specialty | Median time (minutes) | Interquartile range | |
|---|---|---|---|---|
|
| Plastic surgery | 126 | 107–179 | NS |
| Otolaryngology | 143 | 92–204 | ||
|
| Plastic surgery | 135 | 109–143 | NS |
| Otolaryngology | 114 | 73–177 | ||
|
| Plastic surgery | 44 | 19–92 | NS |
| Otolaryngology | 63 | 36–100 | ||
|
| Plastic surgery | 93 | 57–136 | NS for otolaryngology, |
| Otolaryngology | 86 | 55–126 | ||
| General surgery | 149 | 84–165 | ||
|
| Plastic surgery | 112 | 77–151 | NS |
| Otolaryngology | 104 | 70–148 | ||
| General surgery | 126 | 98–165 | ||
|
| Plastic surgery | 121 | 85–185 | NS |
| Otolaryngology | 135 | 98–197 | ||
| General surgery | 117 | 100–180 | ||
|
| Plastic surgery | 65 | 59–86 | NS |
| Otolaryngology | 71 | 36–109 | ||
|
| Plastic surgery | 76 | 55–120 | 0.01 |
| Otolaryngology | 94 | 63–132 |
| Procedure | Type of complication | Specialty |
|
Complication,
| |
|---|---|---|---|---|---|
|
| Dehiscence | Plastic surgery | 261 | 1 (0.4%) | 0.036 |
| General surgery | 20 | 0 (0%) | |||
| Otolaryngology | 311 | 10 (3.2%) |
| Procedure | Specialty | Median time (minutes) | Interquartile range | |
|---|---|---|---|---|
|
| Plastic surgery | 138 | 95–182 | <0.01 for all comparisons |
| Urology | 72 | 44–116 | ||
| General surgery | 51 | 31–88 | ||
| Ob/Gyn | 63 | 44–87 | ||
| Vascular surgery | 62 | 39–108 | ||
|
| Plastic surgery | 115 | 64–162 | <0.01 for all comparisons |
| General surgery | 49 | 31–79 | ||
| Ob/Gyn | 82 | 41–152 | ||
| Vascular surgery | 54 | 38–75 | ||
|
| Plastic surgery | 132 | 95–196 | <0.01 for all comparisons |
| General surgery | 74 | 44–124 | ||
| Vascular surgery | 78 | 56–123 | ||
|
| Plastic surgery | 184 | 147–246 | <0.01 for all comparisons |
| General surgery | 75 | 45–122 | ||
| Vascular surgery | 68 | 52–77 |
| Procedure | Type of complication | Specialty |
|
Complication,
| |
|---|---|---|---|---|---|
|
| Readmission | Plastic surgery | 204 | 13 (6.4%) | <0.01 |
| General surgery | 29,273 | 1157 (4.0%) | |||
| Ob/Gyn | 63 | 9 (14%) | |||
| Orthopedic surgery | 13 | 1 (8%) | |||
| Thoracic | 40 | 1 (2.5%) | |||
| Urology | 39 | 4 (10.2%) | |||
| Vascular | 189 | 7 (3.7%) | |||
| DVT | Plastic surgery | 210 | 3 (1.4%) | 0.026 | |
| General surgery | 30,868 | 59 (0.2%) | |||
| Ob/Gyn | 64 | 0 (0%) | |||
| Orthopedic surgery | 13 | 0 (0%) | |||
| Thoracic | 41 | 0 (0%) | |||
| Urology | 40 | 0 (0%) | |||
| Vascular | 194 | 0 (0%) | |||
|
| DVT | Plastic surgery | 84 | 2 (2.4%) | <0.01 |
| General surgery | 6179 | 16 (0.3%) | |||
| Vascular | 42 | 0 (0%) | |||
|
| Pulmonary embolism | Plastic surgery | 16 | 1 (5.9%) | 0.027 |
| General surgery | 3,415 | 22 (0.6%) | |||
| Vascular | 26 | 0 (0%) |
| Procedure | Specialty | Median time (minutes) | Interquartile range | |
|---|---|---|---|---|
|
| Plastic surgery | 137 | 88–266 | NS for all comparisons |
| Neurosurgery | 146 | 101–220 | ||
| Orthopedics | 109 | 51–151 | ||
| Vascular surgery | 147 | 113–176 | ||
|
| Plastic surgery | 73 | 40–128 | NS |
| Orthopedics | 50 | 41–92 |
| Procedure | Specialty | Median time (minutes) | Interquartile range | |
|---|---|---|---|---|
|
| Plastic surgery | 446 | 347–567 | NS |
| General surgery | 489 | 397–588 | ||
|
| Plastic surgery | 422 | 316–531 | 0.03 |
| Otolaryngology | 487 | 382–594 | ||
|
| Plastic surgery | 329 | 243–476 | 0.04 |
| Otolaryngology | 448 | 416–192 |
| Procedure | Type of complication | Specialty |
|
Complication,
| |
|---|---|---|---|---|---|
|
| Bleed requiring transfusion | Plastic surgery | 2,058 | 135 (6.6%) | 0.01 |
| General surgery | 60 | 9 (15%) |
| Area of practice | General trends | Operative time findings | Complication findings |
|---|---|---|---|
| Breast reconstruction | • Overall increase in volumes with plastic surgeons performing majority of cases | • Plastic surgeons had shorter operative times with the exception of gynecomastia excision | • Overall lower complication rates for plastic surgeons |
| Hand surgery | • Overall increase in case volumes | • Plastic surgeons had longer operative times with the exception of soft tissue cases | • Overall higher complication rates for plastic surgeons |
| Adult craniofacial surgery | • Plastic surgeons had an overall increase in the proportion of cases performed from 2010 to 2020 | • Largely no significant differences for operative times with the exception of two cases where plastic surgeons had shorter times | • Largely no significant differences with the exception of one case where plastic surgeons had lower complication rates |
| Ventral hernia repair | • Plastic surgeons perform a very small proportion of ventral hernia repairs compared to general surgeons | • Plastic surgeons have consistently longer operative times compared to general surgeons | • Plastic surgeons have consistently higher complication rates compared to general surgeons |
| Peripheral nerve | • Plastic surgeons performed approximately one-fifth of peripheral nerve cases | • No significant differences in operative times | • No significant differences in complication rates |
| Microsurgery | • Plastic surgeons consistently perform the highest volume of microsurgical cases among CPT codes analyzed | • Plastic surgeons had lower operative times for cases analyzed | • Complication rates only differed for one complication in one set of cases in which plastic surgeons had lower bleed rates than general surgeons |
Peer Reviews
No public reviews on file for this paper yet. If you reviewed it on a platform where reviews are public (OpenReview, ICLR, NeurIPS, ICML), you can paste yours below so the community can read it here.
Videos
No videos yet. Explain this paper in a talk, walkthrough, or lecture? Add one.
Taxonomy
TopicsBreast Implant and Reconstruction · Surgical Simulation and Training · Digital Imaging in Medicine
Introduction
Plastic surgery is an inherently innovative specialty that addresses a broad spectrum of conditions from head to toe in patients of all ages and comorbidity status. Plastic surgeons have contributed immensely to major advancements in surgery, such as with the development of free tissue transfer with microvascular anastomosis throughout the 1970s. 1 2 3 4 Other historical advancements by plastic surgeons include the anatomical description of component separation in ventral hernia repair, 5 biomechanical restoration in brachial plexus repair via functioning free muscle transfers, 6 and the development of digital replantation with the first report of replantation of a totally amputated thumb. 7 Moreover, the principles of skin grafting were essential in the early immunologic experiments that eventually gave rise to solid organ transplantation in humans. 8 9 It is therefore not surprising that the field of plastic surgery shares significant clinical domain with other specialties, with many procedures having been adopted by surgeons of different specialties. In some areas, surgical techniques have been refined by collaboration with other specialties such as in the case of complex hernia repair. Other areas, such as hand surgery, exist at the interface of multiple specialties, with each contributing to the field. Lastly, some areas such as microvascular head and neck reconstruction have recently begun to move away from the domain of plastic surgeons and into the practice of head and neck surgeons.
In a recent study we demonstrated that plastic surgeons, despite being a relatively small group that shares intellectual spaces with surgeons of other subspecialties, continue to contribute robustly to academic innovation with respect to publication volume and number of citations in breast and aesthetic literature. 10 However, at present there is a paucity of literature regarding how plastic surgeons perform in areas of shared practice with other specialties, especially with regards to case volumes. In this study, the American College of Surgeons National Surgical Quality Improvement Program (ACS-NSQIP) database was utilized to compare case volumes and patient outcomes for select non-aesthetic procedures among plastic surgery and other surgical specialties in the United States between 2010 and 2020.
Methods
Study Design
This study is a registry-based observational study of patients undergoing breast, hand, microsurgery, peripheral nerve, adult craniofacial, and ventral hernia surgeries in the United States between the years 2010 and 2020. Hospitals participating in the ACS-NSQIP are not responsible for the validity of the data analysis or the conclusions derived by the authors.
Data Sources and Study Population
The ACS-NSQIP database is a publicly accessible source of over 150 prospectively gathered demographic, comorbid, preoperative, perioperative, and 30-day postoperative variables recorded by clinicians in a HIPAA-compliant manner. Only cases performed on the adult population are captured, and the specialties of dermatology and oral surgery, which share numerous procedures with plastic surgery, are not included. Cases are randomly selected for inclusion from participating hospitals that span the entire United States. Thus, collected data represent academic and community hospitals in both urban and rural locations but do not include data from freestanding surgery centers. We began by extracting all cases with select Current Procedural Terminology (CPT) codes recorded in the ACS-NSQIP from January 1, 2010 to December 31, 2020. These codes were chosen such that subsequent analyses would pertain to the following select areas of plastic surgical practice: breast, hand, adult craniofacial, brachial plexus, microsurgery, and open ventral hernia repair. This choice was based on the presence of professional organization representation or associated fellowship training. Even though purely aesthetic surgical procedures are important components of plastic surgical practice, these were not included since these procedures are better captured through insurance databases and are not in the scope of this study. Furthermore, since ACS-NSQIP does not include procedures performed by the specialty of dermatology, skin cancer treatment and reconstruction were not included in this study. Only cases with single CPT codes were included to avoid factors that would confound operative time or complications. Although all cases captured by given CPT code searches were included in demographic analyses, to evaluate the impact of only those specialties that robustly contribute to a given surgical area and to eliminate the confounding effect of potentially incorrect data entry, specialties performing fewer than 10 of a given case over the study period were excluded from further analysis. Case selection is summarized in Supplemental Fig. S1 .
Statistical Analysis
Statistical analyses began with descriptive statistics to compare the frequency of involvement between various surgical specialties for selected cases. Case volumes over time within specialties were then compared using Chi-square tests to identify general trends.
For the comparison of operative times of given procedures among different surgical specialties, Mann-Whitney U tests (for the comparison of two specialties) and Kruskal-Wallis tests (for the comparison of more than two specialties) were used. In the case where more than two specialties were compared, further pairwise comparisons between plastic surgery and other specialties were performed by using Wilcoxon rank-sum tests supplemented by Bonferroni-Holm method for p -value adjustment.
Finally, Chi-square tests were performed to assess for any statistically significant differences in bleeding requiring transfusion, deep venous thrombosis (DVT), pulmonary embolism, wound infections, wound dehiscence, and readmission between surgical specialties. Initial data manipulations were performed in SAS 9.4 (Cary, NC) and R 4.2.0 (R Foundation, Vienna, Austria) and statistical analyses were run using SPSS 28.0 (IBM, NY). Statistical significance was set at α = 0.05.
Results
Breast
We reviewed 10 CPT codes accounting for 37,423 reconstructive breast procedures. Corresponding demographic data are shown in Supplemental Table S2 . An analysis comparing comorbidities between specialties is shown in Supplemental Table S1 . Approximately 89.0% ( n = 33,299) of all included procedures were performed by plastic surgeons with the exception of gynecomastia excisions, of which 77.4% were performed by general surgeons. Case volumes over the years are shown in Fig. 1 . In the years 2010 and 2020, plastic surgeons performed 83.9% versus 89.3% of selected reconstructive breast procedures ( p < 0.001). Yearly procedure volume increased for almost all procedures prior to 2020, during which procedure volumes decreased. One exception to this was nipple/areola reconstruction, with decreasing case volume starting in 2018.
Year on year surgical volumes for selected breast procedures by operative specialty. The Y axis represents number of cases. ( A ) Peri-implant complete breast capsulectomy, including removal of all intracapsular contents. ( B ) Breast augmentation with implant. ( C ) Mastopexy. ( D ) Breast reduction. ( E ) Nipple/areola reconstruction. ( F ) Revision of peri-implant capsule, breast. ( G ) Tissue expander placement in breast reconstruction. ( H ) Mastectomy for gynecomastia. ( I ) Insertion or replacement of breast implant on separate day from mastectomy.
With regards to operative times, only plastic surgeons and general surgeons performed high enough volumes of breast procedures to be included in the analysis. Table 1 presents median operative times for each breast procedure. Comparing plastic surgeons with general surgeons, median operative time in minutes were 152 versus 173 for breast reduction ( p < 0.01), 66 versus 74 for breast augmentation with implant ( p < 0.01), 81 versus 135 for immediate implant placement ( p < 0.01), 77 versus 92 for delayed implant placement ( p = 0.02), 77 versus 153 for tissue expander reconstruction ( p <0.01), 67 versus 111 for reconstruction revision ( p < 0.01), and 74 versus 45 for gynecomastia mastectomy ( p < 0.01).
Differences in complication rates for plastic surgery versus general surgery are presented in Table 2 and Supplemental Table S3 . Complication rates for delayed implant placement and implant revision procedures were inversely proportional to the case volumes performed by the specialties.
Hand
A total of 10 CPT codes accounting for 27,986 hand surgical procedures were reviewed. Corresponding demographic data are shown in Supplemental Table S4 . Approximately 4.8% ( n = 1,315) of these were performed by plastic surgeons and 94.4% ( n = 25,900) by orthopedic surgeons. Plastic surgical involvement comprised 32.4% of soft tissue procedures (suture of digital nerve, tendon repairs or transfers) and 3.6% of bony procedures (fractures, intercarpal or carpometacarpal procedures). Case volumes over the years are shown in Fig. 2 . In the years 2010 and 2020, plastic surgical involvement did not differ significantly, with 5.4% versus 4.3% of hand procedures being performed by plastic surgeons, respectively ( p = 0.23). Yearly procedure volume increased for all bony procedures over the study period. This trend was similar for soft tissue procedures until 2018.
Year on year surgical volumes for selected hand procedures by operative specialty. The Y axis represents number of cases. ( A ) Repair, tendon or muscle, flexor, forearm and/or wrist; primary, single. ( B ) Tendon transplantation or transfer, flexor or extensor, forearm and/or wrist, single. ( C ) Open treatment of distal radial intra-articular fracture with internal fixation of two fragments. ( D ) Open treatment of distal radial intra-articular fracture with internal fixation of three or more fragments. ( E ) Open treatment of distal radial extra-articular fracture, with internal fixation. ( F ) Transfer or transplant of tendon, palmar; without free tendon graft. ( G ) Suture of digital nerve, hand or foot; one nerve. ( H ) Transfer or transplant of tendon, carpometacarpal area or dorsum of hand; without free graft. ( I ) Arthroplasty, interposition, intercarpal or carpometacarpal joints. ( J ) Repair or advancement, flexor tendon, not in zone 2 primary or secondary; without free graft.
Table 3 presents median operative times for each procedure. Comparing plastic surgeons with orthopedic surgeons, the median operative time in minutes were 68 versus 64 for intercarpal or carpometacarpal arthroplasty procedures ( p < 0.01), 92 versus 62 and 74 for general surgery for distal radial fracture fixation ( p < 0.01), 89 versus 65 for distal radial fracture fixation, two fragments ( p < 0.01), 100 versus 68 for both general and orthopedic surgery for distal radial fracture fixation, three or more fragments ( p < 0.01), 59 versus 81 for flexor tendon repair ( p < 0.01), and 45 versus 55 for suture of digital nerve ( p < 0.01).
Differences in complication rates between specialties are presented in Table 4 and Supplemental Table S5 . Complication rates for distal radial fracture fixation, three or more fragments as well as intercarpal or carpometacarpal procedures were grossly inversely proportional to the case volumes performed by the specialties that were compared.
Adult Craniofacial/Facial Reconstruction
A total of 13 CPT codes, accounting for 3,026 adult craniofacial and facial reconstructive surgical procedures, were reviewed. Corresponding demographic data and comorbidity analysis are shown in Supplemental Tables S1 and S6 . Five CPT codes were excluded from further analysis due to lack of volume either among plastic surgeons or other specialties. Of the cases reviewed, 89.5% comprised the repair of facial trauma or soft tissue reconstruction ( n = 2,707) and 10.5% comprised reconstruction or revision surgery of facial anomalies ( n = 319). Plastic surgical involvement constituted 40.7 and 21.6% of facial trauma repairs and reconstruction or revision surgery of facial anomalies, respectively. Case volumes over the years are shown in Fig. 3 . In the years 2010 and 2020, plastic surgeons performed 33.6% versus 39.1% of adult craniofacial procedures ( p = 0.28).
Year on year surgical volumes for selected adult craniofacial/facial reconstructive procedures by operative specialty. The Y axis represents number of cases. ( A ) Forehead flap. ( B ) Reconstruction of midface, LeFort III with forehead advancement requiring bone grafts. ( C ) Open treatment of mandibular fracture, with interdental fixation. ( D ) Open treatment of complicated mandibular fracture by multiple surgical approaches. ( E ) Open treatment of fracture(s) of malar area with internal fixation and multiple surgical approaches. ( F ) Palatoplasty for cleft palate, soft and/or hard palate only. ( G ) Reconstruction of mandibular rami and/or body, sagittal split; with internal rigid fixation. ( H ) Reconstruction of midface, LeFort I, single piece, without bone fragment.
Table 5 presents median operative times for each procedure. Comparing plastic surgeons with other specialties, the median operative time in minutes were 93 versus 86 and 149 for otolaryngology and general surgery respectively (NS for otolaryngology; p < 0.01 for general surgery) for treatment of complicated zygomatic fractures and 76 versus 94 for otolaryngology ( p < 0.01) for forehead flaps. Regarding complications, only wound dehiscence rates in the open treatment of mandible fractures were significantly different with a complication rate of 0.4% for plastic surgeons compared with 3.2% for otolaryngologists ( p = 0.04) ( Table 6 and Supplemental Table S7 ) .
Ventral Hernia
Four CPT codes, accounting for 57,324 open ventral hernia repair procedures, were reviewed. Demographic data for these procedures are shown in Supplemental Table S8 . Over the period studied, general surgery performed 98.2% of the procedures ( n = 56,305) with increasing case volumes over the years. By contrast, plastic surgeons performed 0.6% of the cases ( n = 326) with steady case volumes over the study period ( Fig. 4 ).
Year on year surgical volumes for selected ventral hernia procedures by operative specialty. The Y axis represents number of cases. ( A ) Repair recurrent incisional or ventral hernia; reducible. ( B ) Repair recurrent incisional or ventral hernia; incarcerated or strangulated. ( C ) Repair initial incisional or ventral hernia; reducible. ( D ) Repair initial incisional or ventral hernia; incarcerated or strangulated.
Comparing plastic surgeons with general surgeons, the median operative times in minutes were 138 versus 51 for reducible ventral hernia repair ( p < 0.01), 115 versus 49 for incarcerated/strangulated ventral hernia repair ( p < 0.01), 132 versus 74 for recurrent ventral hernia repair ( p < 0.01), and 184 versus 75 for recurrent and incarcerated/strangulated ventral hernia repair ( p < 0.01) ( Table 7 ). Comparisons to other specialties were also significant with results in Table 7 .
In general, complication rates for each included specialty tended to be inversely proportional to case volumes; these are shown in Table 8 and Supplemental Table S9 .
Peripheral Nerve
Five CPT codes, accounting for 317 peripheral nerve procedures, were reviewed. Corresponding demographic data are shown in Supplemental Table S10 . Three procedures were excluded from further analysis due to less than 10 cases performed by one of the specialties that were compared. Approximately 21.1% of all reviewed procedures were performed by plastic surgeons ( n = 67). Moreover, 57.1 and 18.8% of brachial plexus neuroplasty procedures were performed by vascular surgeons and neurosurgeons, respectively ( Fig. 5 ).
Year on year surgical volumes for selected peripheral nerve procedures by operative specialty. The Y axis represents number of cases. ( A ) Neuroplasty, major peripheral nerve, arm or leg, open; brachial plexus. ( B ) Suture of major peripheral nerve, arm or leg, except sciatic, including transposition.
There were no significant differences between plastic surgery and other specialties in either operative time or complications ( Table 9 and Supplemental Table S11 ) .
Microsurgery
Three CPT codes accounting for 2,469 microsurgical procedures were reviewed. Corresponding demographic data and comorbidity analysis are shown in Supplemental Tables S1 and S12 . Plastic surgeons performed 97.0% free tissue transfers for breast reconstruction ( n = 2062) as compared with 2.9% that were performed by general surgeons ( n = 61). Approximately 73.3% of non-breast free tissue transfers were performed by plastic surgeons ( n = 252) as compared with 20.3% that were performed by otolaryngologists ( n = 70) ( Fig. 6 ). In the years 2010 and 2020, plastic surgeons performed 89.3% versus 94.6% of selected microsurgical procedures ( p = 0.25).
Year on year surgical volumes for selected microsurgical procedures by operative specialty. The Y axis represents number of cases. ( A ) Breast reconstruction with free flap (e.g., fTRAM, free transverse rectus abdominus myocutaneous flap; DIEP, deep inferior epigastric perforator flap; SIEA, superficial inferior epigastric artery flap; GAP, gluteal artery perforator flap). ( B ) Free muscle or myocutaneous flap. ( C ) Free fascial flap.
Comparing plastic surgeons with otolaryngologists, the median operative time in minutes were 422 versus 487 ( p = 0.03) for free muscle or myocutaneous flaps and 329 versus 448 ( p = 0.04) for free fascial flaps ( Table 10 ). Regarding complications, the only significant difference was bleeding requiring transfusion following breast free tissue transfers, with complication rates of 15 and 6.6% for general surgeons and plastic surgeons, respectively ( p = 0.01) ( Table 11 and Supplemental Table S13 ) .
Discussion
This study serves as a review of case volumes, operative times, and complication rates of select procedures that are performed by both plastic surgeons and surgeons of other specialties over a recent 10-year span in the ACS-NSQIP. We have examined whether plastic surgeons continue to perform common reconstructive breast, hand, adult craniofacial, ventral hernia, peripheral nerve, and microsurgery procedures in meaningful numbers and whether patient outcomes are associated with case volumes. A condensed summary of the results can be found in Table 12 . An analysis of rates of smoking, diabetes, and average BMI was performed with significant differences between specialties only found for three CPT codes ( Supplemental Table S1 ).
Our findings demonstrate that plastic surgeons continue to perform an overwhelming majority of reconstructive breast and microsurgery procedures. Although other areas of interest were more commonly performed by other surgical specialties, the proportion of cases performed by plastic surgeons did not significantly decrease over the study period for any of these. Moreover, as a general rule, complication rates and operative times varied between specialties and were inversely proportional to case volumes. Although operative times longer than a certain cutoff value have previously been associated with postoperative complications in specific clinical scenarios, 11 12 our findings are not sufficient to show such associations.
Reconstructive breast procedures, a traditional area of focus for plastic surgeons, have remained so both in terms of volume and performance metrics. All selected breast procedures were mainly performed by plastic surgeons with lower operative times and complication rates except gynecomastia excision, which was mainly performed by general surgeons. As mentioned above, case volume discrepancies might explain the differences in lower operative times and complication rates.
Modern hand surgery has deep multidisciplinary roots in the plastic and orthopedic surgical communities. In contemporary hand practice, there are greater numbers of orthopedic providers as compared with plastic surgery providers. In the first decade of the 21st century there were almost four times greater hand fellows with an orthopedic background as compared with a plastic surgical. 13 Perhaps unsurprisingly, this is reflected in our findings with orthopedic surgeons performing the majority of every reviewed procedure. Interestingly, the difference of involvement by orthopedic versus plastic surgery was smaller for soft tissue procedures than for bony procedures. These soft tissue procedures were the only ones that plastic surgeons performed significantly faster. With regards to complications the differences in complication rates for intercarpal or carpometacarpal procedures as well as distal radial fracture fixation of three or more fragments were inversely proportional to the case volumes.
Facial trauma is an area of shared responsibility between plastic surgeons, otolaryngologists, and oral surgeons, with facial trauma call often shared by these specialties at many institutions. Oral surgery is currently not included as a specialty in ACS-NSQIP; therefore, it was not included in the analyses. Our findings demonstrated similar case volumes for included procedures among otolaryngology and plastic surgery. In general, there were few differences in operative times and complication rates for otolaryngology and plastic surgery with otolaryngologists performing faster zygoma fracture fixations and plastic surgeons having lower operative times for forehead flaps as well as lower rates of wound dehiscence for mandibular fracture repairs.
Although the component separation approach for ventral hernias was developed by the plastic surgeon Oscar M. Ramirez, 5 fewer plastic surgeons enter the specialty via the independent pathway and obtain adequate exposure to intra-abdominal procedures, even for open ventral hernia repair as analyzed here. As such, most of the ventral hernia repairs were found to be performed by general surgeons with significantly shorter operative times and lower complication rates. On the other hand, involvement of plastic surgeons did not significantly differ between the years 2010 and 2020. Although the component separation was an important historical milestone in hernia repair, refined novel techniques such as posterior component separations have been developed by minimally invasive surgeons. Since ACS-NSQIP does not include metrics for case complexity for ventral hernia repairs, no further conclusions could be made.
Relative to other areas of practice, peripheral nerve procedures were fewer in number both in total and among plastic surgeons. Vascular surgeons, who commonly perform first rib resections and scalenectomies, accounted for the highest volume of brachial plexus neuroplasties while nerve repairs were more frequently performed by plastic and orthopedic surgeons. Due to the low case numbers, no conclusions could be drawn regarding operative times or complication rates. Additionally, CPT codes for neuroplasty do not distinguish between the types of procedures typically performed by vascular surgeons as compared with plastic and orthopedic surgeons.
Plastic surgeons continue to contribute to microsurgery, as demonstrated by the increasing microsurgical case volumes, both in general and by plastic surgeons. Plastic surgeons continued to perform the majority of microsurgical breast reconstruction. On the other hand, case volumes of non-breast free tissue transfers performed by otolaryngologists have also increased during the study period. This is likely due to the evolution of the head and neck surgeon into both the extirpative and reconstructive surgeon. 14 15 16 Free flap reconstruction is variable by nature, resulting in a wide range of operative times. Although operative times for both muscular/myocutaneous and fasciocutaneous flaps by plastic surgeons were found to be lower, only limited conclusions can be drawn from this as otolaryngologists do not normally perform reconstruction outside of the head and neck unlike plastic surgeons.
Limitations
There are multiple limitations of this study. Cases in ACS-NSQIP are meant to be a representative subset of surgeries performed across the United States; this confines the generalizability of our findings to a single healthcare system. The areas of selected procedures are also not comprehensive. This is for multiple reasons; first, the ACS-NSQIP only includes 12 specialties with notable exclusions including dermatology or oral surgery, making comparisons relating to skin cancer surgery or maxillofacial surgery difficult. Relatedly, the NSQIP database does not collect additional information regarding surgeon training including fellowship or cross-specialty training. Second, only adult patients are included; therefore, we cannot make any conclusions regarding pediatric hand or craniofacial procedures. Similarly, socioeconomic data are not included for patients and so it is impossible to account for this. Third, we included CPT codes but not diagnostic codes (e.g., ICD-10 codes); therefore, accurate cross-specialty comparisons for specific diagnoses such as burns could not be made, and this patient group was therefore excluded. Fourth, reviewed procedures were limited to cases with only one CPT code. Complex surgeries involving multiple procedures, such as oncologic resections followed by reconstruction, were excluded to avoid factors that would confound the operative times or complications. Fifth, since plastic surgeons frequently work in conjunction with other services, the numbers included for analysis are naturally lower than the true numbers of procedures. This low number of cases can make cross-specialty comparisons difficult when two specialties are seen to greatly differ in case volume, such as seen between plastic surgery and general surgery for breast reconstruction. Related to this, specialties with under 10 procedures or CPT codes without sufficient total volume were excluded from analysis. This was done to limit the study only to specialties that contribute robustly to practice and procedures that are performed frequently. This has the limitation of excluding rare, but clinically significant, cases. Overall year-by-year volume comparisons were limited to simple trend comparisons due to these considerations and the simplicity of NSQIP data and future studies would benefit from more sophisticated data gathering and analysis. It is also not possible to stratify cases in the ACS-NSQIP database on the basis of complexity. Although the same CPT code is used for all breast free tissue transfers, there is significant variability in case complexity when different free flaps are used, or even on a patient-to-patient basis. Similar examples apply to all the areas examined. Thus, it is difficult to compare the complexity of cases undertaken by one specialty versus another. Furthermore, since it is a pooled dataset, individual characteristics of practitioners or hospitals such as experience level, institutional volumes of surgery, and hospital location are not collected. Additionally, although p -value adjustment methods could be beneficial for the comparison of complication rates or frequencies of procedures to reduce the risk of type-I errors, we did not utilize such methods due to the low number of complication events in relevant comparisons, as well as the possible increase in type-II error risk that could be introduced by such methods for the comparisons of procedure frequencies. Finally, since the ACS-NSQIP only includes complications from the first 30 days following surgery, long-term complications and outcomes could not be analyzed.
Conclusions
Plastic surgeons are trained to operate on various tissues and organs all over the human body. As a result, overlaps with other specialties are inevitable and this invites comparison between specialties regarding case volumes and complications. In those areas where plastic surgeons perform the largest volume of cases, operative times and complication rates were found to be lower compared with other surgical specialties. Those areas in which plastic surgeons have more complications and longer operative times represent opportunities for quality improvement by cross-specialty trainee education. Two easily identifiable areas are hand surgery and ventral hernia surgery, in which expanded trainee rotations would provide more robust education. Additionally, although more detailed analysis is necessary, these data suggest that hospitals should closely examine the relationship between volumes and outcomes across specialties and the relationship of these with referral systems. Plastic surgeons should continue to direct efforts toward ongoing collaboration. Such collaborations have already given rise to multi-disciplinary approaches in many areas including limb salvage, advanced prosthetics, and transgender care. 17 18
The reference list from the paper itself. Each links out to its DOI / PubMed record.
- 1Mc Gregor I A Morgan G Axial and random pattern flaps Br J Plast Surg 197326032022134580012 10.1016/0007-1226(73)90003-9 · doi ↗ · pubmed ↗
- 2Taylor G I Daniel R K The free flap: composite tissue transfer by vascular anastomosis Aust N Z J Surg 19734301134200573 10.1111/j.1445-2197.1973.tb 05659.x · doi ↗ · pubmed ↗
- 3Daniel R K Taylor G I Distant transfer of an island flap by microvascular anastomoses. A clinical technique Plast Reconstr Surg 197352021111174578998 10.1097/00006534-197308000-00001 · doi ↗ · pubmed ↗
- 4Taylor G I Palmer J H The vascular territories (angiosomes) of the body: experimental study and clinical applications Br J Plast Surg 198740021131413567445 10.1016/0007-1226(87)90185-8 · doi ↗ · pubmed ↗
- 5Ramirez O M Ruas E Dellon A L“Components separation” method for closure of abdominal-wall defects: an anatomic and clinical study Plast Reconstr Surg 199086035195262143588 10.1097/00006534-199009000-00023 · doi ↗ · pubmed ↗
- 6Ikuta Y Kubo T Tsuge K Free muscle transplantation by microsurgical technique to treat severe Volkmann's contracture Plast Reconstr Surg 19765804407411959415 10.1097/00006534-197610000-00002 · doi ↗ · pubmed ↗
- 7Komatsu S Tamai S Successful replantation of a completely cut-off thumb: case report Plast Reconstr Surg 19684204374377
- 8Murray J E Merrill J P Harrison J H Kidney transplantation between seven pairs of identical twins Ann Surg 19581480334335913571912 10.1097/00000658-195809000-00004 PMC 1450810 · doi ↗ · pubmed ↗