CellCraft: an extensible visual programming application for gene regulatory network inference
Dongmin Shin, Jeonghwan Henry Kim, Rakbin Sung, Junil Kim, Daewon Lee

TL;DR
CellCraft is a web-based tool that simplifies the analysis of gene regulatory networks from single-cell RNA sequencing data using an intuitive interface.
Contribution
CellCraft introduces a visual programming interface and modular architecture for streamlined and extensible GRN inference.
Findings
CellCraft integrates multiple GRN tools into a unified web application with a graphical user interface.
The visual programming interface enhances accessibility and interpretation of complex GRN analyses.
The modular design allows for easy incorporation of new single-cell analysis algorithms.
Abstract
Reconstructing gene regulatory networks (GRNs) from single-cell RNA sequencing (scRNA-seq) data is fundamental for understanding cellular dynamics at the molecular level but requires sophisticated workflows. Here, we introduce CellCraft, a web-based application designed to streamline GRN inference. CellCraft integrates multiple GRN reconstruction tools, including TENET, within a unified web application featuring an intuitive graphical user interface. Notably, CellCraft provides a visual programming interface that simplifies the design and execution of complex multistep analyses, thereby enhancing accessibility and facilitating the visualization and interpretation of computational experiments. Furthermore, its modular plugin architecture ensures extensibility, enabling the incorporation of newly developed single-cell analysis algorithms. Consequently, CellCraft provides a user-friendly…
Genes, proteins, chemicals, diseases, species, mutations and cell lines named across the full text — each resolved to its canonical identifier and authoritative record.
Click any figure to enlarge with its caption.
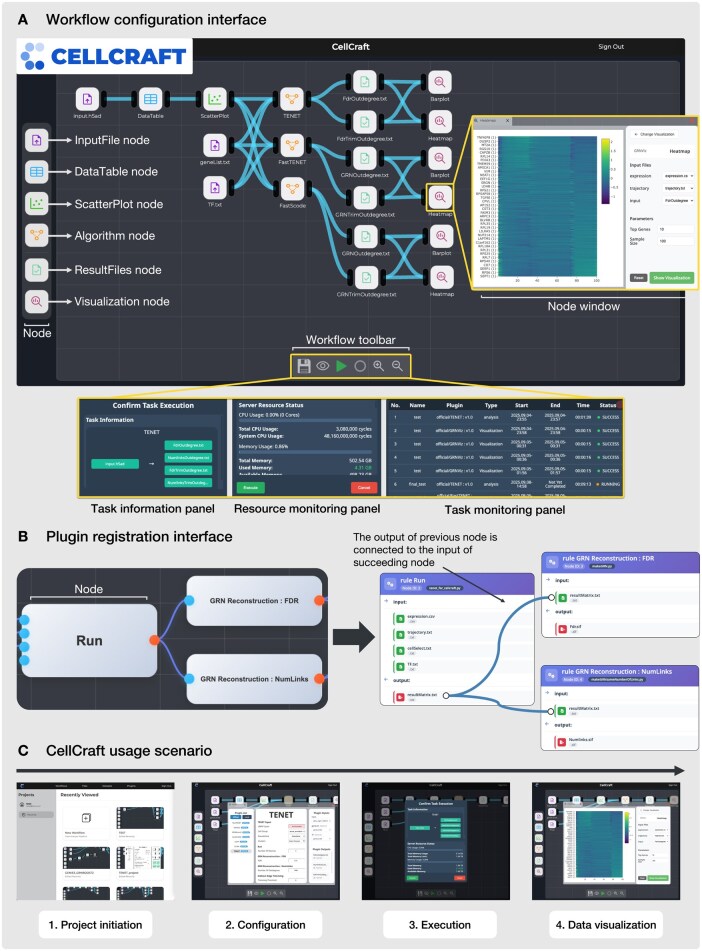 Figure 1
- —National Research Foundation of Korea10.13039/501100003725
- —Korea government
Peer Reviews
No public reviews on file for this paper yet. If you reviewed it on a platform where reviews are public (OpenReview, ICLR, NeurIPS, ICML), you can paste yours below so the community can read it here.
Videos
No videos yet. Explain this paper in a talk, walkthrough, or lecture? Add one.
Taxonomy
TopicsSingle-cell and spatial transcriptomics · Gene Regulatory Network Analysis · CRISPR and Genetic Engineering
1 Introduction
Inferring gene regulatory networks is essential for understanding the regulatory interactions underlying various cellular processes and diseases. Recent advancements in high-throughput transcriptomic measurement techniques have facilitated systematic extraction of regulatory relationships from gene expression profiles, enabling the development of advanced GRN inference methods for single-cell datasets (Kim et al. 2023). These methods use mathematical and statistical frameworks to reconstruct accurate regulatory networks, elucidating the relationships between genes and their regulators (Pratapa et al. 2020, Kim et al. 2024). SCENIC uses regression coefficients and information from the transcription factor (TF) binding motif to infer regulatory networks and their target genes based on machine learning techniques (Aibar et al. 2017). TENET uses the transfer entropy (TE) of information theory to infer causal relationships from scRNA-seq datasets (Kim et al. 2021), and has successfully identified critical regulators across diverse biological contexts (Kim et al. 2022).
The rapid expansion of single-cell omics has resulted in a wealth of open-source tools dedicated to the in-depth analysis of GRNs (Kim et al. 2023). However, integrating and utilizing these tools within integrative software remains challenging due to several limitations. First, steep learning curves often arise from complex user interfaces presenting an overwhelming number of functionalities. Second, architectural constraints hinder scalability and the integration of new methods. Third, ensuring the reproducibility of multistep computational workflows and managing software dependencies can be inadequate or opaque. Collectively, these issues impede user accessibility and restrict the flexibility required for the analysis of large-scale GRNs.
To facilitate efficient inference and exploration of GRNs, we have developed CellCraft, a web-based visual programming application designed specifically for GRN analysis. CellCraft provides an intuitive graphical user interface (GUI) that simplifies complex bioinformatics workflows and substantially reduces the reliance on manual scripting, enabling biomedical researchers without extensive computational expertise to readily perform detailed GRN analysis. Moreover, the plugin system of CellCraft allows straightforward incorporation of external computational tools, further expanding its applicability to diverse research contexts. The current version of CellCraft provides several preinstalled GRN inference tools through its plugin system, such as GENIE3 (Huynh-Thu et al. 2010), GRNBOOST2 (Moerman et al. 2019), LEAP (Specht and Li 2017), Scribe (Qiu et al. 2020), FastSCODE (Matsumoto et al. 2017, Sung et al. 2025), and TENET (Kim et al. 2022, Sung et al. 2024).
2 Design and features
2.1 System architecture
User requests are initiated from a web client built on (You 2014, https://github.com/vuejs/core), which relies on Drawflow (Soler 2020, https://github.com/jerosoler/Drawflow) for visual programming and Plotly (Plotly Technologies Inc. 2015) for data visualization (Fig. 1, available as supplementary data at Bioinformatics online). The user requests are routed through an NGINX (Reese 2008) web server to a backend API server implemented with FastAPI (Ramírez 2018, https://github.com/fastapi/fastapi). The FastAPI-based backend serves as the central component of the system, managing user authentication, workflow validation, task execution, and data processing. It stores and retrieves essential information such as user accounts, plugin metadata, workflow configurations, and results from a PostgreSQL (PostgreSQL Global Development Group 1996, https://www.postgresql.org) database via SQLAlchemy (Bayer 2012).
Overview of CellCraft. (A) Interactive visual programming interface for workflow design and execution. (B) Visual interface for registering and managing custom plugins. (C) Representative usage scenario consisting of four steps.
CellCraft uses a distributed task queue system (Figs 1 and 2, available as supplementary data at Bioinformatics online). When a user initiates workflow execution, the backend API compiles the user-defined workflow and associated parameters into an executable Snakefile (Mölder et al. 2021). This Snakefile is then dispatched as a job via RabbitMQ (RabbitMQ Team 2007, https://www.rabbitmq.com) to a Celery (Solem2009, https://github.com/celery/celery) task processing server. Celery workers execute the workflow via Snakemake, which coordinates the execution of individual tasks according to the workflow’s directed acyclic graph (DAG). Throughout the execution process, task status and output files are continually stored in the database. Once workflow execution is complete, the results are accessible through the web client via API requests to the backend. The entire system is containerized with Docker (Merkel 2014) to ensure consistent deployment and reproducibility across diverse computing environments.
2.2 Visual programming
Visual programming has been adopted in bioinformatics as an approach to manage analytical complexity and improve the accessibility through intuitive user interfaces. Taverna enables researchers to visually compose workflows by integrating local applications or remote web services, emphasizing reproducibility and facilitating the sharing of scientific protocols (Oinn et al. 2004). KNIME is an open-source visual analytics platform that enables users to build data analysis pipelines by assembling nodes for data integration, processing, machine learning, and visualization, facilitating data mining tasks without extensive programming expertise (Berthold et al. 2007). Galaxy is an actively maintained web-based platform providing an intuitive visual interface for executing diverse bioinformatics tools, highlighting reproducible and collaborative research (Abueg et al. 2024).
Compared to general-purpose platforms such as Taverna, KNIME, and Galaxy, CellCraft provides a lightweight visual programming environment dedicated to GRN inference (Fig. 1A). By focusing on essential GRN-related functions, CellCraft maintains a simple and user-friendly design, lowering the learning curve and installation overhead. Consequently, researchers can quickly adopt CellCraft without encountering usability barriers, enabling them to effectively focus on biological insights rather than technical complexities. The visual programming capabilities of CellCraft are implemented by integrating the Drawflow flowchart library for the GUI with the Snakemake workflow management system. In other words, the integration of the Drawflow frontend with the Snakemake backend explicitly defines task dependencies and utilizes the parallel execution capabilities inherent in the DAG structure of the workflow. In the workflow editor, users can interact with nodes that allow direct inspection of data frames (tables), visualization of analysis results, on-the-fly parameter adjustments, and management of input and output files within the visual workflow (Fig. 1A). A key advantage of CellCraft is its visual plugin registration process. Users define inputs, outputs, and parameters for each plugin based on predefined rules. Once registered, each plugin can be incorporated into customizable workflows as a node that represents an executable analysis unit.
2.3 Plugin system
The plugin system of CellCraft is designed to provide flexibility and accessibility for researchers aiming to integrate their own computational methods. In typical plugin architectures, users are required to implement plugins using a specific programming language closely tied to the system’s underlying architecture. For example, in Java-dependent software, plugins must be implemented in Java, requiring users unfamiliar with the language to first learn it before adding new plugins (Shannon et al. 2003, Berthold et al. 2007). In contrast, the CellCraft plugin system simplifies this process substantially by allowing users to register plugins through clearly defined rules specifying inputs, outputs, execution commands, and parameters via a visual plugin registration interface (Fig. 1B and Notes 2.3, available as supplementary data at Bioinformatics online). This visual approach provides clear guidance and immediate feedback, facilitating rapid plugin development and reliable deployment, thus helping researchers concentrate primarily on analysis tasks.
2.4 Usage scenario
A common usage scenario of CellCraft for GRN inference consists of four steps: (i) Project initiation, (ii) Configuration, (iii) Execution, and (iv) Data visualization (Fig. 1C, Figs N1–N4, available as supplementary data at Bioinformatics online).
At the project initiation stage, users upload their own data files via the “Files” page. Users can also utilize the preuploaded datasets in the “Datasets” section. Upon creating a new workflow project, users can either select a template corresponding to a specific GRN inference method or start with an empty project. The template workflow comprises preconfigured nodes with default parameters, serving as a readily executable example that can be further customized as required.
During the configuration stage, users specify input data settings and execution parameters for each node in the workflow. Input data can be explored using “DataTable” and “ScatterPlot” nodes. For instance, users can interactively select subsets of cells using the lasso tool within a 2D UMAP plot. The workflow can then be further expanded by incorporating additional algorithm and visualization nodes.
After initiating the task via the “Run” button, users can monitor task progress in real-time through the “Task” monitoring panel, which displays states such as running, success, failed, or revoked. The execution process of a task can be examined in detail by monitoring the execution status and stepwise logs. Once the task is completed successfully, the data analysis and visualization stage begins. The GRN inference results are automatically loaded into corresponding “ResultFiles” nodes, and users can select the result file they want to analyze. This result file can be connected to visualization nodes and used as an input when generating plots. CellCraft provides built-in visualization options through the “GRNViz” plugin, including interactive bar plots ranking key regulators by out-degree, pseudo-time heatmaps illustrating gene expression dynamics, and network graphs depicting the inferred GRN structure. All result and configuration files can be downloaded for subsequent in-depth analysis using external computational tools.
3 Conclusion
CellCraft is a web-based application specifically designed to simplify GRN inference. By integrating various tools through a lightweight visual programming environment and a modular plugin system with a visual registration interface, CellCraft makes sophisticated GRN analysis accessible to researchers regardless of their computational expertise. These features significantly reduce complexity, installation barriers, and the need for extensive programming skills, while empowering users to easily integrate, customize, and deploy analysis workflows suited to their research objectives.
Supplementary Material
btaf684_Supplementary_Data
The reference list from the paper itself. Each links out to its DOI / PubMed record.
- 1Abueg LAL , Afgan E, Allart O et al The Galaxy platform for accessible, reproducible, and collaborative data analyses: 2024 update. Nucleic Acids Res 2024;52:W 83–94.38769056 10.1093/nar/gkae 410PMC 11223835 · doi ↗ · pubmed ↗
- 2Aibar S , González-Blas CB, Moerman T et al SCENIC: single-cell regulatory network inference and clustering. Nat Methods 2017;14:1083–6.28991892 10.1038/nmeth.4463 PMC 5937676 · doi ↗ · pubmed ↗
- 3Solem A. Celery. 2009. https://github.com/celery/celery (8 May 2025, date last accessed).
- 4Bayer M. SQL Alchemy. The Architecture of Open Source Applications (Volume II) 2012. https://aosabook.org/en/v 2/sqlalchemy.html (8 May 2025, date last accessed).
- 5Berthold MR , Cebron N, Dill F et al KNIME: The Konstanz Information Miner. In: Studies in Classification, Data Analysis, and Knowledge Organization. Heidelberg: Springer; 2008, 319–26.
- 6Huynh-Thu VA , Irrthum A, Wehenkel L et al Inferring regulatory networks from expression data using tree-based methods. P Lo S One 2010;5:1–10.10.1371/journal.pone.0012776 PMC 294691020927193 · doi ↗ · pubmed ↗
- 7Kim D , Kim J, Yu YS et al Systemic approaches using single cell transcriptome reveal that c/ebp regulates autophagy under amino acid starved condition. Nucleic Acids Res 2022;50:7298–309.35801910 10.1093/nar/gkac 593PMC 9303372 · doi ↗ · pubmed ↗
- 8Kim D , Tran A, Kim HJ et al Gene regulatory network reconstruction: harnessing the power of single-cell multi-omic data. NPJ Syst Biol Appl 2023;9:51.37857632 10.1038/s 41540-023-00312-6PMC 10587078 · doi ↗ · pubmed ↗