Transcriptome profiling indicates varied gene responses to Pasteurella multocida mutant infections in cattle
Hao Ma, Fred M. Tatum, Robert E. Briggs, Rohana P. Dassanayake, Tasia M. Kendrick, Eduardo Casas

TL;DR
This study examines how cattle respond to different mutant strains of Pasteurella multocida, identifying gene expression patterns and potential vaccine candidates.
Contribution
The study introduces new insights into gene responses and evaluates live-attenuated vaccine candidates for bovine respiratory disease.
Findings
Mutant strains caused less lung lesions compared to the sham group, indicating potential vaccine efficacy.
Transcriptome analysis revealed significant differences in gene expression in blood and liver tissues.
The fhaB2 mutant showed promise as a vaccine candidate based on reduced lesions and gene expression patterns.
Abstract
Pasteurella multocida is a pathogen that causes bovine respiratory disease, and the development of an effective vaccine is important for improving animal health. Live-attenuated vaccines induce a long-lasting immune response with minimal side effects. The objective of this study was to evaluate potential live vaccine candidates from three P. multocida mutants produced by separately disrupting the genes of filamentous hemagglutinin 2 (fhaB2), hydrogenase-1 operon (hyaE), and n-acylneuraminate-9-phosphatase (nanP) of a serogroup 3 strain (P1062, WT) by clinical testing and transcriptome analysis. Challenge with WT and the three mutants conferred protection against P. multocida, with less lung lesions (4.7–6.2%) compared to 22.4% in the sham group. Transcriptome analysis identified 807 differentially expressed protein-coding transcripts (DETs) in the blood and 6473 DETs in the liver…
Genes, proteins, chemicals, diseases, species, mutations and cell lines named across the full text — each resolved to its canonical identifier and authoritative record.
Click any figure to enlarge with its caption.
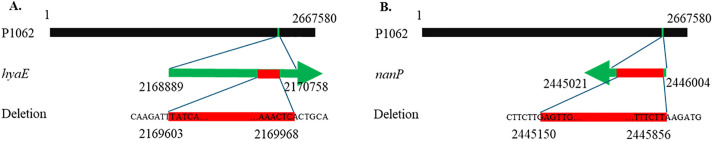 Fig 1
Fig 1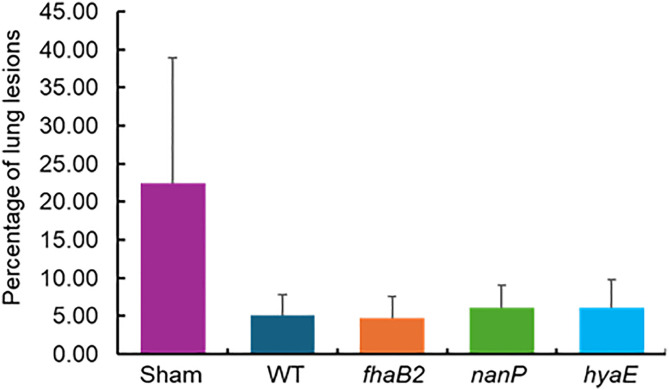 Fig 2
Fig 2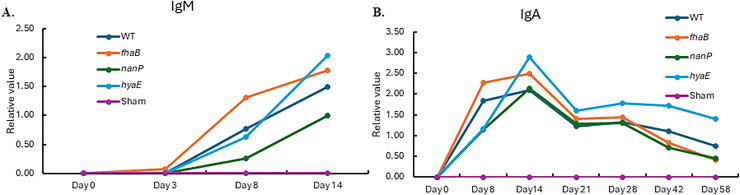 Fig 3
Fig 3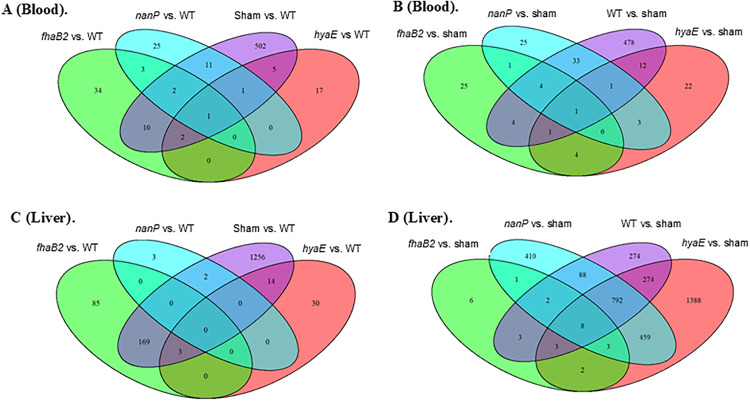 Fig 4
Fig 4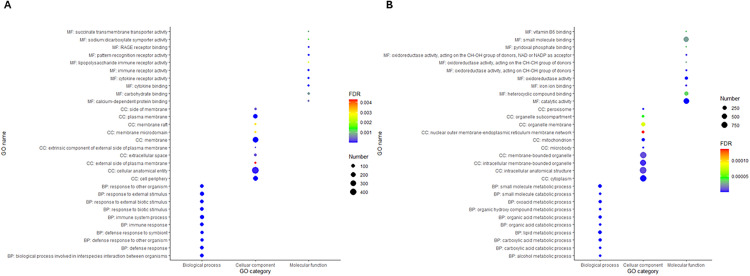 Fig 5
Fig 5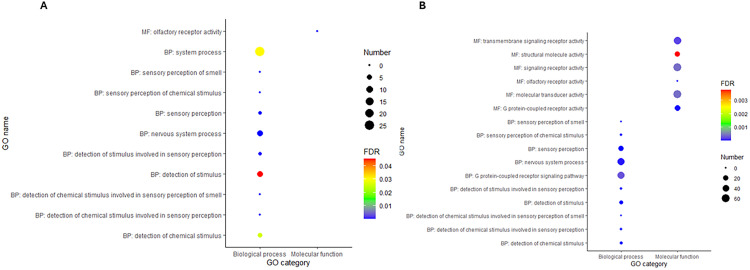 Fig 6
Fig 6Peer Reviews
No public reviews on file for this paper yet. If you reviewed it on a platform where reviews are public (OpenReview, ICLR, NeurIPS, ICML), you can paste yours below so the community can read it here.
Videos
No videos yet. Explain this paper in a talk, walkthrough, or lecture? Add one.
Taxonomy
TopicsMicrobial infections and disease research · Animal Virus Infections Studies · Animal Disease Management and Epidemiology
Introduction
Bovine respiratory disease (BRD) is a leading cause of morbidity and mortality in the dairy and beef industries, with an annual cost of approximately one billion dollars in the United States [1,2]. Pasteurella multocida is a bacterial pathogen that, in conjunction with multiple other factors such as viral infections and environmental and host factors, leads to compromised immune systems and triggers the development of BRD [3]. Strategies to control and prevent the onset of animal illness include decreasing stressors that contribute to the development of the disease, optimizing nutrition, increasing immunity, and administering antimicrobials [4]. The shortcomings of antimicrobial agents include their high cost, low efficacy, and the potential for microbes to develop antibiotic resistance [2,5]. The identification of a safe and effective vaccine candidate against P. multocida is critical for improving livestock health [6].
Transcriptome profiling has been extensively explored as one of the most important approaches to investigate the biological functions of diseases and pathogens. It has been used to uncover the protective mechanisms of vaccines by analysis of host immune responses [7–9]. Furthermore, many differentially expressed genes have previously been identified by RNA sequencing (RNA-seq) analysis as biomarkers for diagnostics and as a strategy to develop methods for their therapeutic targeting [10–13]. With recent advances in sequencing technology, in addition to protein coding genes, non-coding RNAs such as microRNAs (miRNAs) and long non-coding RNA (lncRNAs) have been identified as potential biomarkers and regulators at transcriptional and post-transcriptional levels [14,15]. MiRNAs are endogenous non-coding RNA molecules approximately 22 nucleotides in length. MiRNAs have been reported to negatively and positively regulate target gene expression [16–19]. As biomarkers, miRNAs are associated with various pathogenic infections [20–25]. LncRNAs are RNA polymerase II transcripts with a length greater than 200 nucleotides and low coding potential capacity. Extensive studies on the response of lncRNAs to diseases have been reported in several species, including porcine [26], bovine [27], rabbits [28], and chickens [29].
The interactions among genes, miRNAs, and LncRNAs were reported in many publications. Furthermore, studies on transcriptome changes in response to pathogenic infections have indicated that substantial temporal variations exist for different pathogens or isolated infections [30]. Shared and specific differentially expressed transcripts have been observed in different tissues of animals infected with the same pathogen [31,32]. Blood is important for maintaining homeostasis and is critical for immunity to defend the body against diseases. The liver is an essential metabolic organ that plays an important role in the innate immune response during infection by activating the cells residing in the liver [33,34]. The objective of the current study was to assess the clinical observations and differential expression of transcript variations in the blood and liver in response to P. multocida challenge in calves previously exposed to mutants with a potential virulence factor gene disrupted, to provide a foundation for potential vaccine candidate selection.
Materials and methods
Generation of P. multocida mutants
Pasteurella multocida strain P1062 (serotype A:3) was isolated from the pneumonic lung of a Holstein–Friesian calf that died from respiratory disease; its genome was sequenced in 2015 [35]. Three putative virulence factors were selected in the experiment, two of which, hydrogenase-1 operon protein (hyaE) and n-acylneuraminate-9-phosphatase (nanP), were partially deleted from the P1062 strain genome with 366 and 708 bp, respectively (Fig 1). Another one, filamentous hemagglutinin 2 gene (fhaB2) was described below.
A schematic diagram of the relative location of the deletions to generate hyaE and nanP mutants.Panel A: hyaE deletion; Panel B: nanP deletion. The black lines represent the P1062 strain genome; the green lines represent the potential virulent factor genes; red represents the deleted fragment.
DNA fragments containing the hyaE gene of P1062 were amplified with primer pairs (S1 Table) to produce an approximately 1,870-bp fragment containing the hyaE coding sequence. The polymerase chain reaction (PCR) product was cloned into the plasmid pCR2.1 (Invitrogen, La Jolla, CA, USA) and amplified in Escherichia coli Top10 (Invitrogen) cells, from which plasmid DNA was isolated using Spin-preps (Qiagen Inc. Valencia, CA). The hyaE sequence carried on pCR2.1 was subjected to PCR with deletion primers to produce a linear product with pCR2.1, flanked by upstream and downstream arms containing a deletion within hyaE. Linear DNA was treated with T4-DNA ligase, and the re-circularized plasmid was introduced into E. coli cells by electroporation and cultured for plasmid amplification. Following plasmid isolation, the purified plasmid was digested with EcoRV (sites contained in the PCR primers) and ligated to produce a deletion fragment, resulting in the removal of hyaE amino acids 239–359 and the substitution of isoleucine for leucine at the former 360 position. The hyaE fragment was transferred to a temperature-sensitive (Ts) plasmid derived from the endogenous plasmid, M. haemolytica pD70. The Ts plasmid and its application in producing gene replacements have been described in detail in a previous publication [36].
The nanP replacement arms used to generate the mutation in P. multocida P1062 were obtained by PCR using the primers listed in S1 Table. The primer sequences in red were hybridized with P. multocida nanP whereas those in black were included for cloning purposes. The PCR product was subjected to BamH1 and Sal I digestion and inserted into the corresponding sites of the pBCSK plasmid (Stratgene, Inc., La Jolla, CA, USA). An in-frame deletion within nanP was introduced following digestion with EcoRI, which produced a 708 bp in-frame deletion within the nanP gene.
The P1062 gene fhaB2 was inactivated using a temperature-sensitive (Ts) replacement plasmid and inserted with KanRTn903 element into a unique Bgl II site in the gene fragment. The detailed description of the P1062 insertion mutant following the same procedure as we did previously in P1059 [37]. All the mutants we generated were sequence verified.
Experimental design
Animal care and sample collection were done according to the management protocol approved by the Institutional Animal Care and Use Committee of the National Animal Disease Center, in Ames, IA, United States (protocol no. ARS-23–1160).
Twenty, 8-wk-old commercial calves of 54–91 kg were housed in the Animal biological safety level 2 (ABSL2) facility at the National Animal Disease Center, Ames, IA, USA. The calves were randomly assigned to five groups, each with four animals. One animal in the control group (sham) was euthanized because of torsion that caused bloating. All calves were housed in 10 rooms under similar conditions, with two calves per room and measures in place to prevent the spread of pathogens between rooms and groups. The animals were fed a combination of Timothy hay cubes and a pelleted Growena ration (Purina Mills, Mills Summit, MO). Calves were allowed to acclimate to the space for approximately 1 wk prior to treatment application. At day zero, 10 ml of Earle’s Balanced Salt Solution (EBSS) containing 2.0–2.3 × 10^9^ colony forming units (cfu) P. multocida P1062 (WT) or each of the three mutants was delivered to nares and palatine tonsils (S1 Fig). The control group received only EBSS. On days 58 (half of the animals) and 59 (the other half), all animals were intratracheally administered 100 ml EBSS containing 2.2 × 10^9^ cfu of WT P1062 strain with a stable plasmid containing chloramphenicol acetyltransferase to the lungs, and the inoculum was then washed with an additional 100 ml of sterile EBSS. After 5 d of the WT challenge, the animals were euthanized by intravenous administration of sodium pentobarbital, and the liver samples were collected.
Enzyme-linked immunosorbent assay and confirmation of infection
About 5 ml of jugular venous blood samples were collected weekly, and sera were tested for antibodies against P. multocida whole cells. P. multocida P1062 hyaE was grown to an optical density (OD)600nm of 0.6 then diluted 1:10 with carbonate–bicarbonate buffer (C3041, Sigma-Aldrich, Inc. St. Louis, MO). A total of 100 µL of culture was used to coat the wells in 96-well plates. The plates were coated overnight at 4°C. The plates were washed once and blocked for 1 h with TBS-T20 (Sigma T9039) containing 0.5% fish gelatin and 1% horse serum. Serum was diluted 1:50 in TBS-T20 and loaded in quadruplicate (pools) or duplicate (individual). The plate was incubated for 2 h at 20–22°C and then washed three times with blocking buffer. Sheep anti-bovine IgA and IgM alkaline phosphatases (Sigma-Aldrich, Inc., St. Louis, MO, USA) were diluted 1:1000 in TBS-T20 buffer and incubated for 1 h. The plates were washed three times with blocking buffer. Alkaline phosphatase activity was detected using SigmaFast pNPP (N2770) (Sigma-Aldrich, Inc., St. Louis, MO, USA), and plates were read for 6–8 min at 405 nm using SpectraMax250 (Molecular Devices LLC., San Jose, CA). Serum samples from P. multocida-exposed calves diluted to 1:10, 1:40, 1:160, and 1:640 were used as standard positive controls for plate variation.
All of the calves were monitored daily for clinical signs of respiratory infection. Nasal bacterial shedding was assessed by taking a nasal swab, which was collected by inserting an individual 15-cm swab into each nostril until it was sufficiently saturated. Palatine tonsils were evaluated using an oral speculum and modified pipettes. Palatine tonsil washes were performed by flushing each crypt with 3 ml EBSS and immediately collecting the liquid. Samples were collected on arrival, on D0 (day of exposure), D3, and then weekly through to week 7. Nasal and tonsil swabs were directly plated (undiluted) on Columbia blood agar plates containing 5% defibrinated bovine blood. Additionally, nasal and tonsil samples were diluted ten-fold in EBSS, and 100 µL of each dilution was spread onto a blood agar plate (BAP). All plates were incubated overnight at 37 °C and growth was quantitated. The hyaE was the only mutation with an observable phenotype of less mass and slimier compared to the WT, nanP, and fhaB2 because of the disruption of the capsule biosynthetic gene (S2 Fig) [37]. Confirmation of the strains was performed using PCR for each mutant and wild-type strain using the primers listed in S1 Table.
Confirmation of lung infection and lesion evaluation
Infection in the lungs was confirmed using lung specimens diluted in a 1:10 weight:volume in EBSS. The specimens were homogenized using a Tekmar Tissumizer SDT1810 (TZ Supplies, Fleetwood, Pennsylvania, USA). Suspension and ten-fold dilutions were prepared in EBSS. The dilutions of 100 µL were spread in duplicate onto BAPs containing 5% defibrinated bovine blood with chloramphenicol and incubated overnight at 37 °C; strain growth was then quantified [38].
Lung lesion scores were estimated visually and by palpation in each lung lobe, including both consolidated areas and volumes that appeared grossly atelectatic. The total lung lesion scores were calculated as the sum of the eight individual lobe scores, where the estimated percentage of each lobe’s lung lesion volume was multiplied by an approximation of its contribution to air exchange as: right cranial lobe, 6%; cranial half of the right middle lobe, 5%; caudal half of the right middle lobe, 7%; right caudal lobe, 35%; accessory lobe, 4%; left cranial lobe, 4%; left middle lobe, 6%; and left caudal lobe, 32% [39].
RNA isolation and sequencing
Total RNA was extracted from blood and liver samples collected at necropsy using the MagMAX^TM^ mirVana^TM^ Total RNA Isolation Kit (ThermoFisher Scientific, Waltham, MA, USA) and eluted in 100 μl of RNase-free water. The concentration and quality of small RNAs in each sample were determined using a 10–40 nucleotide gate on an Agilent 2100 Bioanalyzer Small RNA chip (Agilent Technologies, Santa Clara, CA, USA). Purified RNA extracted from each sample with RNA integrity number (RIN) of at least 7.5 was used to prepare individual libraries using the NEBNext Multiplex Small RNA Library Prep Kit (New England Biolabs, Ipswich, MA, USA). Library concentration and purification were performed using the QIAquick PCR Purification Kit (QIAGEN, Germantown, MD, USA). Each library between 135 and 170 bp was run on an Agilent 2100 Bioanalyzer High-Sensitivity DNA chip (Agilent, Santa Clara, CA, USA) to determine the quality and quantity of the prepared library. Then, 30 ng of each library was pooled, and the size was selected using AMPure XP beads (Beckman Coulter, Indianapolis, IN, USA). Following size selection, library pools were concentrated using a QIAquick PCR purification kit (QIAGEN, Germantown, MD, USA) and eluted in RNase-free water. An Agilent 2100 Bioanalyzer high-sensitivity DNA chip was used to determine the concentration of each library pool. The library pool was sequenced as single-end 50-bp reads using the Illumina HiSeq 3000 System (Illumina, San Diego, CA, USA).
For messenger RNA (mRNA) sequencing, individual libraries each with 1 µg and RIN > 7.5 were constructed using the NEB Next Ultra RNA Library Kit for Illumina and the NEBNext PolyA Magnetic Isolation Module (NEB, Ipswich, MA, USA). The library was enriched with 9 PCR cycles. After final clean-up with Agencourt AMPure XP Beads, 1 μl of the libraries were run on an Agilent 2000 bioanalyzer using the high sensitivity DNA chip to measure the quality and quantity of the libraries. Based on average size and concentration, individual libraries were pooled to an equal molar concentration (1.5 nm) and sequenced using an Illumina HiSeq 3000 sequencer at paired-end 2 × 100 bp at the Iowa State University DNA Sequencing Facility (Ames, IA, USA).
Identification of differentially expressed miRNAs and transcripts
The bovine reference genome was downloaded from Ensembl Genes 102 (https://uswest.ensembl.org/info/data/ftp/index.html) and the miRNA precursor and mature sequences were downloaded from miRBase (http://www.mirbase.org, Release 22.1). FastQC (version 1.11.5) was used to evaluate blood and liver small non-coding RNA raw sequences [40], and Cutadapt (version 1.16 with Python 2.7.13) was used with Q30 to select high-quality sequences and remove adaptors and highly-presented junk sequences [41]. Known and novel miRNA sequences from blood and liver were quantified using miRDeep2 (version 0.1.3) as described previously [42,43]. The predicted novel miRNAs were presented in at least six samples among blood, liver, bronchial lymph node, palatine tonsil, and retropharyngeal lymph node tissues. The counted blood and liver miRNA reads were then used to identify differentially expressed miRNAs (DEmiRNAs) using the DESeq2 package in R (version 3.6.1) [44] with a false discovery rate of <0.05. Comparisons were conducted in the blood and liver between the treatments of fhaB2 and WT, hyaE and WT, nanP and WT, sham and WT (or WT vs sham), fhaB2 and sham, hyaE and sham, and nanP and sham. The small RNA sequences are available in the NCBI SRA under the BioProject accession number, PRJNA1241202.
Blood and liver sequencing reads were selected and evaluated in a manner similar to that of small non-coding RNA, as described above. Reads were mapped against the bovine reference genome using STAR aligner (version 2.7.2b) with the settings of outFilterMultimapNmax 30, alignSJoverhangMin 5, alignSJDBoverhangMin 3, outFilterScoreMinOverLread 0.50, and outFilterMatchNminOverLread 0.50 [45]. Raw transcript sequences were sorted using Samtools (version 1.9) [46] and then counted using RSEM (version 1.3.0) [47]. Raw counts were analyzed using the DESeq2 package [44] to identify differentially expressed protein-coding transcripts (DETs) with the criteria of Log_2_FC =>|1| and false discovery rate <0.05. Raw RNA-seq data were deposited in the NCBI SRA database under the BioProject accession number, PRJNA1241202.
Target gene prediction
The bovine 3′ untranslated regions (UTR) were obtained by running the R package, “biomartr” (Version 0.9.0) [48]. Target genes of the differentially expressed miRNAs were separately predicted by miRanda (aug2010) and PITA [49,50]. The criteria to determine target transcripts are ΔG ≤ −15 kcal/mol for miRanda and energetic score ≤ −10 kcal/mol for PITA, where ΔG is the free energy of duplex formation from a completely dissociated state which was calculated using the Vienna package (version 1.0.125) [49]. The reported target genes were predicted using both programs.
Based on chromosomal coordinate information, the “cis-” interacted DETs of differentially expressed lncRNA (DElncRNA) were determined as those that were located adjacent to the DElncRNAs within 100-kb upstream and downstream on the same chromosome [27,35,51,52]. As three to four animals were used for each treatment, it was not appropriate to reliably predict trans-acting lncRNAs based on correlation coefficients.
Gene functional analyses and statistical test
The transcripts listed in Ensembl Genes 102 were used as reference. Gene Ontology (GO) analysis of the transcripts of interest was performed using OmicsBox version 3.2.0 (www.biobam.com). Gene set enrichment was tested using Fisher’s exact test and Benjamini-Hochberg procedure was used for multiple testing corrections. The Fisher’s exact test for the number of DETs identified from each comparison, Wilcoxon signed-rank test for DEmiRNA and targeted gene, and Spearman correlation coefficients of the number of DElincRNAs and DETs were estimated using R (version 3.6.1) [53–55].
Results
Pathogen colonization, lung lesions, and immunoassay
P. multocida colonization test showed that the pathogens were detected in nares and palatine tonsil with a 50–100% rate for the animals inoculated with the WT and each of the mutants on day 3 post infection (Table 1). As expected, all animals in the sham group showed no P. multocida throughout the observation period. Pathogen localization was tested until day 42, which showed that the pathogens were identified in the nares from nasal swabs of at least half of the animals in the WT and nanP groups and 25% of the animals in the fhaB2 group. In the palatine tonsils, fhaB2 was detected in all animals from days 3–42; WT and nanP were identified in palatine tonsil washes in 0–100% and 25%−100% of the animals, respectively, whereas hyaE was undetectable after day 28 in the nares and after day 14 in the palatine tonsils.
Table 1: Percentage of animals with detected respective Pasteurella multocida WT or mutant strains in nares and palatine tonsils, post immunization.
All the animals, including the sham, were challenged intratracheally with P. multocida WT (chloramphenicol resistant). Within 48 hours of challenge, a pronounced clinical signs development was observed in the sham group compared to other groups such as fever, drooping ears, reduced feed intake and reduced response. The measurement of lung lesions after all animals were challenged with WT indicated that the protective effects of WT and the three mutants were substantially higher than in the sham group (Fig 2). The percentage of lung lesions was 22.43% in animals challenged with the sham and 4.75–6.16% in animals challenged with WT, fhaB2, hyaE, and nanP mutants.
The percentage of lung lesions estimated for the animals treated with sham, wild type, fhaB2, nanP2, and hyaE.Error bar is the standard error of the mean.
Like colonization, IgM levels increased after day three in serum of the animals in the WT and mutant groups. IgA levels also increased after inoculation and reached a maximum on day 14, after which they decreased gradually (Fig 3).
Immunoassay of serum with IgM and IgA for the animals challenged with sham, fhaB2, nanP, hyaE, and wild type.Panel A: IgM antibody; Panel B: IgA antibody.
RNA sequencing
RNA sequencing of samples derived from the blood and liver of 19 animals generated an average of 61,337,572 raw reads, 61,326,291 cleaned reads, 52,943,364 uniquely mapped reads, and 3,424,118 multiple-mapped reads per sample (S2 Table). The average number of identified transcript was 18,984 from blood, and 21,756 from liver. Small-RNA sequencing produced an average of 16,854,619 raw reads, 16,696,252 clean reads, and 14,957,301 mapped reads per sample (S3 Table). The average numbers of identified mature and novel miRNA were 465 and 150 from blood, and 478 and 47 from liver respectively.
Differentially expressed mRNAs, miRNAs, and lncRNAs
The raw reads were used to test the differences of the transcripts for each comparison between two groups of the animals. The analysis identified a greater number of DETs in the liver (6473) than in the blood (807) (Table 2 and S3 Fig). Similarly, 64 and 15 DEmiRNAs and 74 and 12 differentially expressed lncRNAs (DElncRNAs) were identified in the liver and blood samples, respectively. Shared and unique DETs are shown in Fig 4. The sham vs. WT contrast in the blood and liver showed an increased number of DETs compared to the mutant vs. WT. Fisher’s exact test showed extremely significant difference between the number of the DETs identified from sham vs. WT and each of the mutants vs. WT for both blood and liver (P-value < 2.2e^-16^). Blood and liver samples showed differences in the number of identified DETs, DElncRNAs, and DEmiRNAs.
Table 2: Number of differentially expressed transcript (DET), miRNA (DEmiRNA), and lncRNA (DELncRNA).
Venn diagram of differentially expressed transcripts in blood and liver.Comparison between each of the four treatments and wild type in blood (A) and liver (C); Comparison between each of the four treatments and sham in blood (B) and liver (D).
In liver, the number of DETs from fhaB2 vs. WT was significantly smaller than that from sham vs. WT, but larger than that from hyaE vs. WT or nanP vs. WT (P-value <0.05), which indicated that fhaB induced relatively fewer changes in gene expression after the calves were infected by the WT and the mutants. The numbers of DETs from hyaE vs. WT and nanP vs. WT were smaller than those from fhaB2 vs. WT, indicating that host responses to hyaE and nanP infections were closer to those of the WT. This result was consistent with the number of DETs from fhaB2 vs. sham, which was significantly smaller compared to those from sham vs. WT, hyaE vs. sham, and nanP vs. sham (P-value < 2.2e^-16^). These comparisons confirmed that fhaB2 caused less molecular variation than the WT, hyaE, and nanP. The number of DETs from all comparisons in blood showed a similar pattern as that in liver. In both blood and liver, a similar number of DETs were shared between fhaB2 vs. sham, hyaE vs. sham, and nanP vs. sham (Fig 4).
A similar pattern of DEmiRNAs and DElncRNA was observed in the blood and liver. A greater number of DElncRNAs were also identified in hyaE vs. sham [33], followed by sham vs. WT [21], and nanP vs. sham [15] in the liver. A larger number of DEmiRNAs [19] and DElncRNAs [71] were identified in the liver than in the blood (15 and 12, respectively). Of all comparisons in the liver, more DEmiRNAs and DElincRNAs were found in hyaE vs. sham, nanP vs. sham, fhaB2 vs. WT, and sham vs. WT, with 25, 12, 11, and 8 DEmiRNAs, and 33, 15, 4, and 21 DElncRNAs, respectively.
Functional analysis of DETs
Functional gene analysis of the DETs in blood resulted in 598, 147, 8, and 1 significantly enriched gene ontology terms (GOs) for sham vs. WT, nanP vs. sham, fhaB2 vs. WT, and fhaB2 vs. sham comparisons, respectively (Table 3). In the liver, 383, 212, 201, 21, and 3 GOs were significantly enriched for hyaE vs. sham, nanP vs. sham, WT vs. sham, fhaB2 vs. WT, and fhaB2 vs. sham, respectively. Although the comparisons showed a similar pattern of significantly enriched GOs in the blood and liver, excluding hyaE vs. sham, the over-enriched GO terms in the three GO categories varied greatly between the two tissues. Similar to the sham vs. WT comparison with over-enriched GOs under biological processes, only seven GOs were shared for a total of 458 in blood and 98 in the liver; for molecular function, only two were shared for a total of 41 in both blood and liver. In the cellular component category, only one was shared, with 28 in the blood and 23 in the liver (S4 Table).
Table 3: Total number of significantly enriched gene ontology terms in blood and liver.
In the blood, the most significantly over-enriched GOs associated with the DETs from sham vs. WT (based on adjusted p-values) were immune and defense responses and response to biotic stimulus, which were processed over membranes, cellular anatomical entities, and extracellular space (Fig 5 and S4 Table). The molecular functions of the enriched GOs were mainly involved in the activities of the immune system, cytokine receptor, pattern recognition receptor, succinate transmembrane transporter, sodium:dicarboxylate symporter, lipopolysaccharide immune receptor, binding of carbohydrates, cytokines, calcium-dependent proteins, and RAGE receptors. All the top enriched GOs were from the DETs, which were highly expressed in the sham compared to the wild-type group, which indicated that the downregulated DETs did not contribute to the enrichment of the top enriched GO terms. The top over-enriched GOs in all three categories were the same as those identified in the nanP vs. sham comparison (S4 Table).
Top 10 significantly over enriched gene ontology terms associated with the DETs from sham vs. WT in blood and liver.Panel A: Blood; panel B: Liver. BP-Biological process; MF-Molecular function; CC-Cellular component.
In contrast to the over-enriched GO terms in blood, as described above, the liver showed considerably higher GO enrichment in the DETs identified from sham vs. WT, hyaE vs. sham, and nanP vs. sham, which were metabolic and catabolic processes of small molecules, lipids, oxoacids, organic acids, carboxylic acids, organic hydroxy compounds, and alcohols. The molecular functions of the DETs were catalytic and oxidoreductase activities, as well as small molecules, heterocyclic compounds, iron ions, pyridoxal phosphates, and vitamin B6 binding in the cytoplasm, mitochondria, organelle sub-compartments, peroxisomes, microbodies, intracellular anatomical structures, membrane-bound organelles, and organelle membranes. DETs contributed to the GO enrichment were highly expressed in WT, nanP, and hyaE animals compared to those in the sham group.
In contrast to the over-enriched GOs, the most under-enriched GOs of the DETs from sham vs. WT in the blood were also shared in the liver for sham vs. WT, hyaE vs. sham, and nanP vs. sham (Fig 6). These GOs include the detection of chemical stimuli, which are involved in sensory perception, nervous system processes, and the sensory perception of smell. The only under-enriched GO associated with molecular functions was olfactory receptor activity. For the shared GOs in blood and liver, the expression of the corresponding genes was suppressed in WT compared to sham in blood; however, in the liver, some transcripts associated with the GOs in the calves treated with sham, WT, nanP, and hyaE were suppressed, whereas other transcripts were highly expressed.
Top 10 significantly under enriched gene ontology terms associated with the DETs from sham vs. WT in blood and liver.Panel A: Blood; panel B: Liver. BP-Biological process; MF-Molecular function.
The interaction of DEmiRNA, DElncRNA, and targeted DETs
To understand the possible associations between DEmiRNAs and DETs, the average percentages of target DETs within each comparison of DEmiRNAs were estimated (Table 4). The DEmiRNAs with Log_2_FC < 0 targeted more DETs within the comparisons than those out of the comparisons (Wilcoxon signed rank test, P-value = 0.0199); however, for DEmiRNAs with Log_2_FC > 0, there were no differences in the number of DETs targeted within each comparison and the DETs not in the comparison (P-value = 0.9102). The target difference for DEmiRNAs with Log_2_FC < 0 mainly arose from a higher percentage of targeted DETs with Log_2_FC < −1 (P-value = 0.0841) (Table 5). There were no obvious associations between DEmiRNAs and target DETs within each comparison in both the blood and liver because DEmiRNAs with Log_2_FC < 0 or >0 targeted DETs with both Log_2_FC < −1 and >1. These results indicate that DE miRNAs were associated with some DETs.
Table 4: Both PITA and MiRanda predicted percentages of target differentially expressed transcripts by the differentially expressed microRNAs.
Table 5: PITA and MiRanda predicted percentages of target differentially expressed transcripts by the differentially expressed microRNAs within each comparison.
The Spearman correlation coefficient estimated by the number of DElncRNAs and DETs in the blood and liver in all comparisons were highly significant (R_Spearman_ = 0.8694**). However, based on the localization of the lncRNAs and transcripts, the cis-regulation of the DElncRNAs on the DETs were different for the comparisons. In the blood, only sham vs. WT showed DElncRNAs that cis-regulated 12 of the DETs from the same comparison; in the liver, DElncRNAs from fhaB2 vs. WT, sham vs. WT, hyaE vs. sham, and nanP vs. sham cis-regulated 170 of the DETs (S5 Table). Of all the DElncRNAs and DETs, only 37 DElncRNAs were localized to approximately 180 DETs within 100 kb. Based on the log_2_ FC values, 35 of the DElncRNAs and 167 DETs were in the same direction (positive–positive, or negative–negative), whereas 24 DElincRNAs and 32 DETs were in opposite directions.
Discussion
The host–pathogen interactions clearly showed that there were dynamic processes from P. multocida invasion to dissemination. As the first line of defense against pathogens [56], IgA assay values increased immediately after P. multocida infection, reached a maximum on day 14, and then decreased gradually. However, the antibodies produced by the calves could recognize and neutralize the pathogen effectively until the challenge with the WT. Similar to clinical signs in which sham group showed the pronounced clinical responses, most lung lesions were observed in the animals in sham group. Approximately 22% lung lesions were in the sham group and about 4–6% lung lesions in the other four groups. Consistent with this, sham vs. WT in the blood and liver had an increased number of DETs compared to each mutant vs. the WT. This is a contrast between naïve animals and animals exposed to pathogens; therefore, the differences in gene expression are not surprising. Therefore, the animals were infected with each of the mutants, and the hosts developed resistance to the WT bacteria, causing the number of DETs from nanP vs. WT, hyaE vs. WT, and fhaB2 vs. WT to be small.
Blood not only delivers necessary substances and removes waste, but it also performs coagulation, defense, and homeostasis maintenance [57,58]. The liver is important in the production of blood serum proteins, other critical proteins, and immune factors [33,34,59,60]. A larger number of DETs, DElncRNAs, and DEmiRNAs were identified in the liver than in blood, which may be related to the physiological functions of the two tissues [61]. The greatest number of DETs and significantly enriched GOs were identified in the liver by hyaE vs. sham (Tables 2 and 3), which was not only due to the specificity of the liver compared to blood, but was also caused by hyaE encoding the hyaluronic acid capsule, increasing adhesion and immune evasion of P. multocida [37]. The greatest number of unique DETs and enriched GOs from the hyaE vs. sham comparison was aligned with the difficulty of the mutant to colonize both the nares and palatine tonsils after 14 d of challenge (S1 Table and Fig 4D).
Recently, researchers have focused on identifying transcriptome changes in blood that might mirror changes in the liver; some genes involved in mitochondrial and immunological functions are co-regulated [61]. In a heat-stress study utilizing Sprague–Dawley rats, more DETs were identified in the liver than in the blood [62]. A similar result was reported in the present study by the genes suppressed in both tissues in WT with under-enriched GOs (Fig 5 and S4 Table); however, additional DETs in the liver were found to be significantly overexpressed in WT and shared the same biological processes and functions as the DETs in both blood and liver, which were suppressed in WT and overexpressed in sham. These results indicate the importance of the liver in response to pathogen infection.
There were more shared DETs in fhaB2 vs. WT and sham vs. WT, which may indicate similar responses of calves to fhaB2 and sham treatments (Fig 4C); however, the differences shown by the unique DETs between the two comparisons were still large. The unique DETs identified from the comparisons of nanP vs. sham, hyaE vs. sham, and WT vs. sham indicated that nanP, hyaE, and WT infections caused the animals to use different pathways to overexpress these genes. Nevertheless, the animals still had many common pathways, as reflected by the numerous shared DETs in the three comparisons (Fig 4). Based on shared and unique DETs from different comparisons, the responses to nanP and hyaE mutants were closer to the WT than fhaB2.
The miRNA and lncRNA have been known to regulate gene expression [14,15,63]. Regulation of gene expressions by miRNA and lncRNA has been widely reported [16–19,64–67]. PITA and miRanda were used for in silico prediction of target genes. For lncRNA targets, only cis-target genes have been reported as lncRNA trans-interacting genes were determined using correlation coefficients in many previous publications [27,68,69]. A limited number of calves were included in this study; therefore, a robust correlation was not guaranteed. These results support the association of DEmiRNAs and DElncRNA with DETs in both positive and negative directions. Similar to DElncRNAs, DEmiR-targeted DETs showed positive and negative relationships in different comparisons. With the dynamic changes in the transcriptome in response to pathogenic infections [9,25,30,31,70,71], future studies should focus on the profiling and interactions among mRNAs, miRNAs, and lncRNAs within different time frames and tissues after infection with each mutant and WT.
Conclusion
Transcriptome analysis identified a greater number of differentially expressed transcripts, microRNAs, and long non-coding RNAs from the comparisons performed in the liver than in the blood for the calves inoculated with sham, WT, and the three generated mutants. The responses of calves infected with nanP and hyaE mutants were more similar to those of WT infected calves which supported by small number of DETs and not significantly enriched GOs identified by nanP vs. WT and hyaE vs. WT. In contrast, infection with fhaB2 mutant resulted in fewer DETs from fhaB2 vs. sham but more DETs from fhaB2 vs. WT, indicating that fhaB2 caused fewer transcriptomic changes than the other two mutants and elicited a response closer to sham animals. Together with the distinct transcriptomic profiles observed in blood and liver, as well as the reduced lung lesions and colonization, these findings suggest that fhaB2 mutant could be a promising candidate vaccine for controlling P. multocida infections in cattle.
Supporting information
S1 FigOverview of timeline showing the interventions and sampling timepoints.(TIF)
S2 FigPhenotypic difference of the hyaE compared to the WT, nanP, and *fhaB2.*The bacteria were grown on Trypticase™ Soy Agar (TSA II™) with 5% Sheep Blood (Fisher scientific, Waltham, Massachusetts, USA) overnight at 37°C.(TIF)
S3 FigVolcano plot of expressed genes with different comparisons in blood and liver.Panel A: Seven comparisons in blood; Panel B: Seven comparisons in liver.(TIF)
S1 TablePrimers used for Pasteurella multocida mutant generation and confirmation of colonization.(CSV)
S2 TableMessenger RNA sequencing statistics.(CSV)
S3 TableSmall RNA sequencing statistics.(CSV)
S4 TableSignificantly enriched gene ontology terms in blood and liver.(CSV)
S5 TableA list of differentially expressed LncRNA and closely localized differentially expressed transcript from each comparison.(CSV)
The reference list from the paper itself. Each links out to its DOI / PubMed record.
- 1Kamel MS, Davidson JL, Verma MS. Strategies for Bovine Respiratory Disease (BRD) diagnosis and prognosis: a comprehensive overview. Animals (Basel). 2024;14(4):627. doi: 10.3390/ani 14040627 38396598 PMC 10885951 · doi ↗ · pubmed ↗
- 2Mostaan S, Ghasemzadeh A, Sardari S, Shokrgozar MA, Nikbakht Brujeni G, Abolhassani M, et al. Pasteurella multocida vaccine candidates: a systematic review. Avicenna J Med Biotechnol. 2020;12(3):140–7. 32695276 PMC 7368114 · pubmed ↗
- 3Dabo SM, Taylor JD, Confer AW. Pasteurella multocida and bovine respiratory disease. Anim Health Res Rev. 2007;8(2):129–50. doi: 10.1017/S 1466252307001399 18218157 · doi ↗ · pubmed ↗
- 4Nickell JS, White BJ. Metaphylactic antimicrobial therapy for bovine respiratory disease in stocker and feedlot cattle. Vet Clin North Am Food Anim Pract. 2010;26(2):285–301. doi: 10.1016/j.cvfa.2010.04.006 20619185 · doi ↗ · pubmed ↗
- 5Andrés-Lasheras S, Jelinski M, Zaheer R, Mc Allister TA. Bovine respiratory disease: conventional to culture-independent approaches to studying antimicrobial resistance in North America. Antibiotics (Basel). 2022;11(4):487. doi: 10.3390/antibiotics 11040487 35453238 PMC 9025279 · doi ↗ · pubmed ↗
- 6Ran X, Meng X-Z, Geng H-L, Chang C, Chen X, Wen X, et al. Generation of porcine Pasteurella multocida ghost vaccine and examination of its immunogenicity against virulent challenge in mice. Microb Pathog. 2019;132:208–14. doi: 10.1016/j.micpath.2019.04.016 30980881 · doi ↗ · pubmed ↗
- 7Eshraghisamani R, Facciuolo A, De Buck J. Oral paratuberculosis vaccine efficacy and mucosal immunity in cattle. Vaccine. 2024;42(26):126447. doi: 10.1016/j.vaccine.2024.126447 39423453 · doi ↗ · pubmed ↗
- 8Artigas-Jerónimo S, Villar M, Estrada-Peña A, Alberdi P, de la Fuente J. Subolesin knockdown in tick cells provides insights into vaccine protective mechanisms. Vaccine. 2024;42(11):2801–9. doi: 10.1016/j.vaccine.2024.03.006 38508929 · doi ↗ · pubmed ↗