Longitudinal Changes in Left Ventricular Geometry After Kidney Transplantation and Their Implications on Cardiovascular Risk
Dong-Hyuk Cho, Jun Gyo Gwon, Jimi Choi, Cheol Woong Jung, Tai Yeon Koo, Se Won Oh, Sang-Kyung Jo, Kyo Won Lee, Kyu Ha Huh, Han Ro, Seung-Yeup Han, Jang-Hee Cho, Sik Lee, Jaeseok Yang, Seong-Mi Park, Myung-Gyu Kim

TL;DR
This study shows that while kidney transplantation improves heart structure, increased heart wall thickness is linked to higher cardiovascular risk, emphasizing the need for metabolic control.
Contribution
The study identifies that relative wall thickness increase after kidney transplantation independently predicts cardiovascular events, offering new insights into post-transplant cardiac risk management.
Findings
Improved hemodynamic parameters correlate with reduced left ventricular size after kidney transplantation.
Increased relative wall thickness independently predicts major adverse cardiovascular events.
Better metabolic control is associated with improved left ventricular wall thickness.
Abstract
Kidney transplantation (KT) alleviates the hemodynamic burden in chronic kidney disease on dialysis. However, cardiovascular disease remains the leading cause of death after KT. This study evaluated the metabolic and hemodynamic burden and its impact on myocardial remodeling and clinical outcomes after KT. Multicenter observational prospective cohort study. 600 patients who underwent echocardiography before and 3 years after KT from 8 university hospitals in Korea. Changes in metabolic parameters (glycosylated hemoglobin [HbA1C] and triglyceride [TG] levels) and hemodynamic parameters (hemoglobin [Hb] and systolic blood pressure [SBP]) from baseline to 3 years after KT. Primary outcome was major adverse cardiovascular events (MACE). Secondary outcomes included left ventricular geometry changes. Cox proportional hazards models were used to assess the association between…
Genes, proteins, chemicals, diseases, species, mutations and cell lines named across the full text — each resolved to its canonical identifier and authoritative record.
Click any figure to enlarge with its caption.
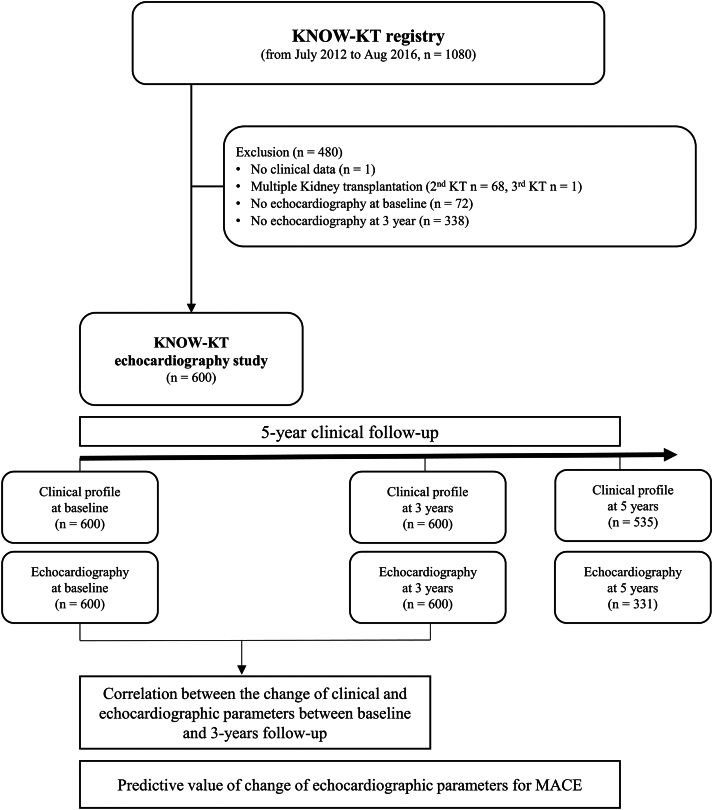 Figure 1
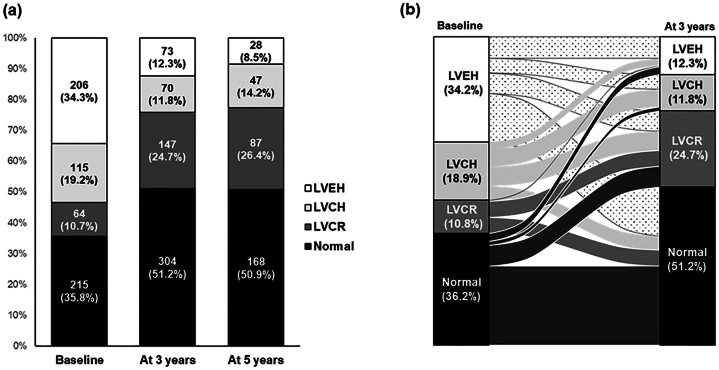 Figure 2
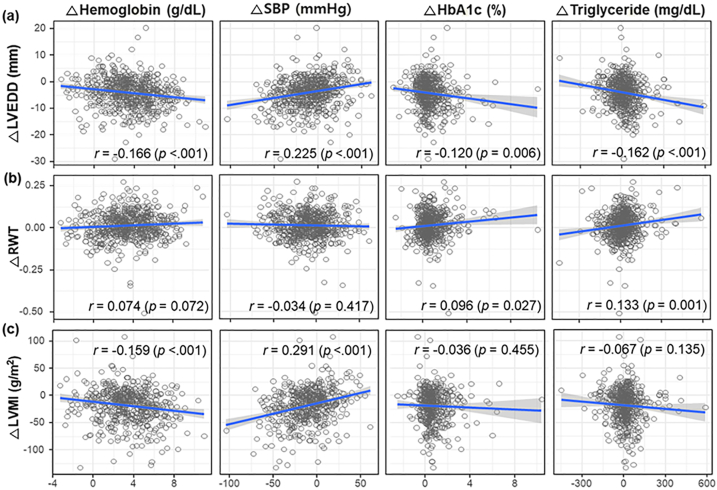 Figure 3
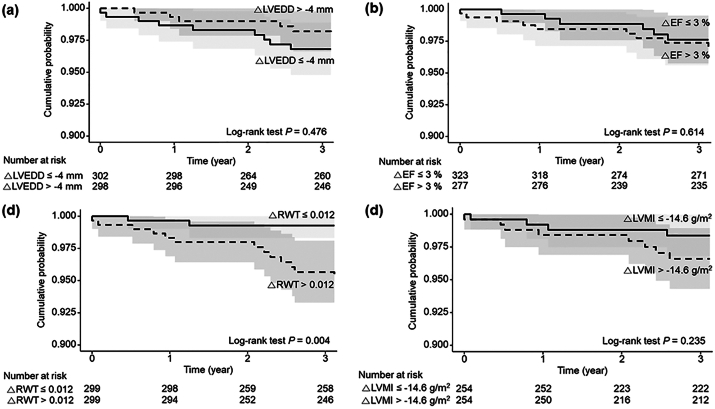 Figure 4
Peer Reviews
No public reviews on file for this paper yet. If you reviewed it on a platform where reviews are public (OpenReview, ICLR, NeurIPS, ICML), you can paste yours below so the community can read it here.
Videos
No videos yet. Explain this paper in a talk, walkthrough, or lecture? Add one.
Taxonomy
TopicsCardiovascular Function and Risk Factors · Renal and Vascular Pathologies · Transplantation: Methods and Outcomes
Introduction
Kidney transplantation (KT) significantly improves the patient's quality of life by alleviating uremia, anemia, electrolyte imbalance, and fluid overload. However, chronic cardiovascular alterations, such as atherosclerosis, vascular calcification, and fibrosis, that are associated with chronic kidney disease (CKD) may not improve after transplantation. Furthermore, metabolic conditions, such as dyslipidemia, obesity, insulin resistance, and posttransplant diabetes mellitus, owing to the use of immunosuppressants, anabolic energy metabolism, increased appetite, and weight gain after KT, can negatively affect vascular health. As a result, cardiovascular diseases (CVDs) remain the leading cause of morbidity and mortality among patients receiving KTs after the transplantation.1, 2, 3
Echocardiographic imaging of structural and functional changes can provide valuable information regarding the risk of CVDs. Several studies have reported longitudinal changes in echocardiographic parameters after KT. The results of cardiac remodeling are inconsistent, although KT can improve cardiac dysfunction and some structural changes in patients with CKD. Cardiac structural abnormalities, including abnormalities in the interventricular septum, left ventricular (LV) end-diastolic dimension (LVEDD), and LV mass, have been reported to normalize within 7 years after KT in pediatric patients with a relatively short duration of CKD.4 However, other studies have demonstrated that cardiac function can improve after KT without leading to major changes in ventricular morphological features.5 Additionally, KT has been reported to be associated with improved cardiac function with little or no change in LV geometry.6 Differences in cardiac remodeling following KT may influence the onset or exacerbation of CVDs, subsequently affecting KT outcomes differently; however, our understanding of these details is limited.
This large prospective cohort study involving patients receiving KTs aimed to investigate (1) longitudinal changes in eccentric and concentric myocardial remodeling and cardiac function, (2) clinical factors associated with these longitudinal changes, and (3) the impact of these longitudinal changes on CVDs and KT outcomes.
Methods
Database and Study Design
This observational, prospective cohort study was conducted at 8 centers in the Republic of Korea. A total of 1,080 patients who underwent KT were enrolled in the Korean Cohort Study for Outcome in Patients with KT (KNOW-KT) from July 2012 to August 2016, and 600 patients who underwent 2 conventional echocardiographies at baseline and follow-up were included in the present study. Detailed protocols of the KNOW-KT registry were previously described.7 Briefly, consecutive patients aged >18 years old, who received KT from 8 university hospitals, were enrolled. Patients with simultaneous multiple organ transplantation, en bloc KT, liver cirrhosis, or interstitial lung disease were excluded. Patients were followed up for 5 years or until their death, graft failure, or dropout. KNOW-KT was approved by the Institutional Review Committee of each participating center, and written informed consent was obtained from all patients. The procedures performed in this study were in accordance with the institutional guidelines and regulations.
Clinical Variables
Baseline clinical variables, such as demographic data, underlying medical disease history, medications, information about renal replacement therapy, and smoking history, were obtained during the pretransplant screening period. Frailty was assessed using the age-adjusted Charlson comorbidity index.8 Baseline laboratory tests were performed before KT; however, serum urea nitrogen and creatinine values were evaluated 4 weeks later, after KT, because of their variability in the immediate postdialysis period before KT. All the patients fasted for at least 8 h before blood sampling. The levels of hemoglobin (Hb), creatinine, glycosylated Hb (HbA_1c_), total cholesterol, triglycerides (TGs), low-density lipoprotein cholesterol (LDL-C), and high-density lipoprotein cholesterol (HDL-C) were measured using blood tests. The estimated glomerular filtration rate was calculated using the CKD-EPI equation. All variables and values collected at baseline admission and every follow-up year were recorded in an electronic case report form.
Echocardiographic Parameters
All patients underwent conventional echocardiographies using a commercially available echocardiographic system to assess LV geometry and function. Chamber quantification was performed using 2-dimensional or M-mode imaging techniques following the guidelines of the American Society of Echocardiography and the European Association of Cardiovascular Imaging.9 LV geometries were evaluated by measuring LVEDD, the interventricular septum, and the posterior wall thickness. Relative wall thickness (RWT) was calculated as (2 × posterior wall thickness)/LVEDD, and LV mass index (LVMI) was calculated using formulas recommended by the American Society of Echocardiography.10 LV ejection fraction (LVEF) was calculated using the biplane Simpson method from apical 4- and 2-chamber views.
Clinical Outcomes
The primary outcome of the study was major adverse cardiovascular events (MACE), which were defined as a composite of new-onset coronary artery disease, cerebrovascular disease, peripheral arterial disease, and cardiovascular mortality. The diagnosis was confirmed using the KNOW-KT registry survey conducted at each center. The specific diagnosis for each disease group was rechecked to ensure diagnostic accuracy. Coronary artery disease included angina pectoris, myocardial infarction, and silent myocardial ischemia, whereas cerebrovascular disease included acute neurogenic injury resulting from ischemic cerebral infarction. Hemorrhagic cerebrovascular disease was excluded because it may have a different pathophysiology compared with ischemic cerebrovascular disease, which is primarily caused by atherosclerosis. Follow-up was conducted for a period of 5 years after KT (Fig 1).Figure 1. Study algorithm. Abbreviations: KNOW-KT, Korean Cohort Study for Outcome in Patients with KT; KT, kidney transplantation; MACE, major adverse cardiovascular events.
Statistical Analysis
All variables collected were presented as frequencies (percentages) for categorical variables or as mean ± standard deviation or median (interquartile range) for continuous variables according to the distribution of the variables. The changes in clinical parameters or cardiac indices over time were analyzed using a paired t test or the Wilcoxon signed-rank test for continuous variables and the McNemar’s test for binary variables. The linear correlation between changes from baseline to 3 years in clinical and echocardiographic variables was determined using Pearson’s correlation analysis. We estimated the cumulative incidence of the outcomes according to quartile groups of key echocardiographic variables (LVEF, LVMI, LVEDD, and RWT) using the Kaplan-Meier curves and performing the log-rank test to evaluate the effect of these changes on the clinical outcomes. The effect of changes from baseline to 3 years in echocardiographic parameters on the MACE was evaluated using the multivariable Cox proportional regression models, with the results presented as hazard ratios per 1 standard deviation of changes and 95% confidence intervals. Adjusted variables included in the model were age, sex, value of baseline parameters, and statistically significant covariates based on univariable analysis of age, sex, donor type, donor age, diabetes, hypertension, dyslipidemia, smoking, dialysis duration, use of tacrolimus, changes from baseline, and 3-year in clinical parameters (body mass index [BMI, kg/m^2^], waist-to-hip ratio, Hb level, estimated glomerular filtration rate, HbA_1c_ level, SBP, DBP, LDL-C level, TG level, HDL-C level, and TG/HDL-C ratio change) for MACE (Table S1). All statistical analyses were performed using SAS 9.4 software (SAS Institute), and a P value < 0.05 was considered statistically significant.
Results
Baseline Characteristics of the Study Population
The mean age of the study population was 46.2 ± 11.4 years, and 62% of patients were men. Living- and deceased-donor transplantations were performed in 512 (85.3%) and 88 (14.7%) patients, respectively. The causes of end-stage kidney disease were diabetes, hypertension, glomerulonephritis, polycystic kidney disease, and unknown in 128 (21.3%), 122 (20.3%), 188 (31.3%), 34 (5.7%), and 96 (16.0%) patients, respectively. Patients received steroids (600, 100%) and tacrolimus (571, 95.2%) as maintenance immunosuppressants after KT. Table S2 displays the patient characteristics.
Post-KT Longitudinal Changes in Clinical Parameters and Cardiac Structure and Function
The BMI increased significantly from 23.0 ± 3.4-23.4 ± 3.2 kg/m^2^ 3 years after KT (P < 0.001). Hb levels significantly increased from 10.5 ± 1.6-14.0 ± 1.9 g/dL (P < 0.001), and SBP and DBP decreased from 137.4 ± 19.2 and 83.5 ± 12.6-127.2 ± 14.5 and 78.2 ± 10.8 mmHg, respectively (both P < 0.001). However, the prevalence of diabetes mellitus and dyslipidemia increased from 25.7%-38.7% (P < 0.001) and 53.7%-86.3% (P < 0.001), representing 13% and 32.6% absolute increases in new-onset diabetes mellitus and dyslipidemia, respectively. HbA1c, LDL-C, and TG levels also increased from 5.6% ± 0.8%-6.3% ± 1.3% (P < 0.001), 83.8 ± 30.6-95.0 ± 29.7 mg/dL (P < 0.001), and 128.8 ± 85.7-141.1 ± 93.8 mg/dL (P = 0.002), respectively. Similar changes were observed after 5 years of KT (Table 1).Table 1. Changes in Clinical Parameters Between Baseline and Follow-upMean ± SD or n (%)Baseline (N = 600)At 3 y (N = 600)At 5 y (N = 535)PaPbBMI (kg/m^2^)23.0 ± 3.423.4 ± 3.223.6 ± 3.2< 0.001< 0.001WHR0.89 ± 0.060.88 ± 0.050.89 ± 0.060.4350.324SBP (mmHg)137.4 ± 19.2127.2 ± 14.5127.2 ± 13.5< 0.001< 0.001DBP (mmHg)83.5 ± 12.678.2 ± 10.878.0 ± 10.6< 0.001< 0.001Heart rate (bpm)77.2 ± 12.677.2 ± 12.678.4 ± 12.20.7130.156Comorbid conditions DM154 (25.7)232 (38.7)217 (40.6)< 0.001< 0.001 HTN553 (92.2)570 (95.0)511 (95.5)0.045< 0.001 Dyslipidemia322 (53.7)518 (86.3)440 (82.4)< 0.001< 0.001 CAD40 (6.7)53 (8.8)49 (9.2)0.161< 0.001 Stroke23 (3.8)29 (4.8)24 (4.5)0.3950.045 Heart failure13 (2.2)14 (2.3)13 (2.4)0.8460.317 Arrhythmia7 (1.2)14 (2.3)13 (2.4)0.1230.014 Liver disease36 (6.0)46 (7.7)42 (7.9)0.2530.001 Chronic lung disease6 (1.0)9 (1.5)10 (1.9)0.4360.045 Cancer23 (3.8)35 (5.8)38 (6.2)0.106< 0.001Modified Charlson comorbidity index, median (IQR)3 (2–4)1 (0–3)1 (0–3)< 0.001< 0.001Laboratory findings Hemoglobin level (g/dL)10.5 ± 1.614.0 ± 1.913.8 ± 2.0< 0.001< 0.001 Creatinine level (mg/dL)1.18 ± 0.441.21 ± 0.841.19 ± 0.580.3430.333 eGFR (mL/min/1.732m^2^)66.4 ± 19.466.6 ± 20.466.1 ± 21.10.8600.414 HbA1C level (%)5.6 ± 0.86.3 ± 1.36.4 ± 1.3< 0.001< 0.001 LDL-C level (mg/dL)83.8 ± 30.695.0 ± 29.792.2 ± 28.9< 0.001< 0.001 TG (mg/dL)128.8 ± 85.7141.1 ± 93.8145.6 ± 108.80.002< 0.001HDL-C level (mg/dL)45.1 ± 16.059.9 ± 18.060.2 ± 18.0< 0.001< 0.001TG/HDL-C ratio3.50 ± 3.492.85 ± 3.332.94 ± 3.91< 0.0010.001HTN medications540 (90.5)285 (57.9)268 (66.8)< 0.001< 0.001 RAS blockade312 (52.3)123 (25.0)97 (24.2)< 0.001< 0.001 Diuretics152 (25.5)20 (4.1)6 (1.5)< 0.001< 0.001 β-blocker278 (46.6)194 (39.4)129 (32.2)0.018< 0.001 CCB394 (66.0)164 (33.3)185 (46.1)< 0.001< 0.001Antithrombotics481 (80.2)90 (15.0)71 (17.7)< 0.001< 0.001Lipid-lowering agents191 (31.8)374 (62.3)268 (66.8)< 0.001< 0.001DM medications142 (23.7)220 (36.7)155 (38.7)< 0.001< 0.001 Insulin80 (13.3)120 (20.0)80 (20.0)0.0020.005OHA82 (13.7)178 (29.7)125 (31.2)< 0.001< 0.001Immunosuppressants Tacrolimus571 (95.2)577 (96.2)381 (95.0)0.3950.912Cyclosporin27 (4.5)18 (3.0)15 (3.7)0.1720.557Mycophenolate mofetil317 (52.8)295 (49.2)196 (48.9)0.2040.220 Myfortic acid181 (30.2)154 (25.7)89 (22.2)0.0820.005 Bredinine12 (2.0)55 (9.2)43 (10.7)< 0.001< 0.001 Sirolimus31 (5.2)44 (7.3)39 (9.7)0.1210.006 Everolimus15 (2.5)1 (0.2)1 (0.2)< 0.0010.005 Steroids600 (100)541 (90.2)362 (90.3)< 0.001< 0.001Abbreviations: BMI, body mass index; CAD, coronary artery disease; CCB, calcium channel blocker; DM, diabetes mellitus; eGFR, estimated glomerular filtration rate; HbA_1C_, glycosylated hemoglobin; HDL-C, low-density lipoprotein cholesterol; HTN, hypertension; IQR, interquartile range; LDL-C, low-density lipoprotein cholesterol; OHA, oral hypoglycemic agents; RAS, renin-angiotensin system; SD, standard deviation; TG, triglyceride; WHR, waist-to-hip ratio.aP-value for comparison between baseline and 3 years.bP-value for comparison between baseline and 5 years.
All 600 patients underwent conventional echocardiographies at baseline and 3 years, but only 331 patients underwent echocardiographies at 5 years. Baseline and follow-up echocardiographies revealed changes in LVEDD, LVEF, RWT, and LVMI at 3 and 5 years after KT. The LV chamber size, represented using LVEDD, improved significantly over 3 years (51.2 ± 5.6-47.1 ± 4.8 mm, P < 0.001). LV wall thickness and LVMI decreased significantly (LVSWT, 10.0 ± 1.6-9.7 ± 1.5 mm, P < 0.001; LV posterior wall thickness, 10.0 ± 1.6-9.5 ± 1.5 mm, P < 0.001; LVMI, 113.4 ± 31.8-94.4 ± 23.4 g/m^2^, P < 0.001). LV contractility, evaluated using LVEF, improved significantly from 61.4% ± 7.9%-64.8% ± 6.0% (P < 0.001). However, the parameter of LV concentricity, RWT, increased from 0.39 ± 0.07-0.41 ± 0.07 mm, reflecting that chamber size improved more than wall thickness in 3 years after KT (P < 0.001) (Table S3). Figure 2 demonstrates the longitudinal change in LV geometry after KT. The prevalence of normal LV geometry and LV concentric remodeling increased; however, both LV concentric and eccentric hypertrophy decreased.Figure 2. Changes in LV geometry after kidney transplantation. (A) Distribution of LV geometry at baseline and after 3 and 5 years. (B) Longitudinal changes in LV geometry at baseline and 3-year follow-up. Abbreviations: LV, left ventricular; LVEH, left ventricular eccentric hypertrophy; LVCH, left ventricular concentric hypertrophy; LVCR, left ventricular concentric remodeling.
Clinical Factors Associated With Structural and Functional Cardiac Changes
Clinical factors associated with structural and functional cardiac changes were analyzed using correlation analysis of changes in echocardiographic and clinical parameters. These results showed that a decrease in LVEDD was associated with an increase in Hb levels (r = −0.166, P < 0.001), a decrease in SBP (r = 0.225, P < 0.001), an increase in HbA_1c_ level (r = −0.120, P = 0.006), and an increase in TG level (r = −0.162, P = 0.001). Additionally, an increase in RWT was correlated with an increase in HbA_1c_ level (r = 0.096, P = 0.027) and TG level (r = 0.133, P = 0.001). Moreover, a decrease in LVMI was associated with an increase in Hb level (r = −0.159, P < 0.001) and a decrease in SBP (r = 0.291, P < 0.001). Furthermore, an increase in LVEF was associated with an improvement in estimated glomerular filtration rate (r = 0.105, P = 0.001) (Fig 3 and Table S4).Figure 3. Correlation between changes in clinical and echocardiographic parameters from baseline to 3 years. The correlation of clinical parameters, including hemoglobin level, SBP, HbA_1c_, and triglyceride, and echocardiographic parameters, including (a) LVEDD, (b) RWT, and (c) LVMI, was demonstrated. Abbreviations: HbA_1c_, glycosylated hemoglobin; LVEDD, left ventricular end-diastolic dimension; LVMI, left ventricular mass index; SBP, systolic blood pressure; RWT, relative wall thickness.
Impact of Structural and Functional Cardiac Changes on KT Outcomes
During the 5-year follow-up period, 30 MACE occurred (cumulative incidence: 5%). The breakdown of MACE included coronary heart disease (n=23, 3.8%), stroke (n=7, 1.2%), and cardiovascular death (n=5, 0.8%). The impact of echocardiographic parameters on KT outcomes was evaluated. However, no baseline echocardiographic parameters predicted the future development of MACE (Table S5). Among the parameters of change of echocardiographic parameters in the univariate analysis, only the change in RWT was related to the new development of MACE (log-rank P = 0.037), whereas changes in LVEF, LVMI, and LVEDD were not (Table S6).
In multivariate analysis, only an increase in RWT, but not other echocardiographic parameters, independently predicted the occurrence of MACE after adjusting for age, sex, and other baseline clinical and echocardiographic parameters (hazard ratio, 2.20; 95% confidence interval, 1.21-3.99; P < 0.01) (Table 2). Patients with increased RWT showed a statistically significantly higher rate of MACE for up to 5 years following the KT (log-rank P = 0.004). The Kaplan-Meier curves for the changes in key echocardiographic parameters are shown in Fig 4.Table 2. Impact of Changes in Echocardiographic Parameters on the Major Adverse Cardiovascular EventsParametersUnivariable analysisMultivariable analysisaHR (95% CI)PHR (95% CI)PLVEF change per 1SD0.86 (0.51, 1.45)0.5650.64 (0.32, 1.29)0.213LVMI change per 1SD1.49 (0.84, 2.66)0.1761.53 (0.75, 3.14)0.246LVEDD change per 1SD0.84 (0.51, 1.37)0.4740.63 (0.33, 1.23)0.178RWT change per 1SD2.11 (1.27, 3.50)0.0042.20 (1.21, 3.99)0.010Abbreviations: CI, confidence interval; HR, hazard ratio; LVEDD, left ventricular end-diastolic dimension; LVEF, left ventricular ejection fraction; LVMI, left ventricular mass index; RWT, relative wall thickness; SD, standard deviation.aadjusted by age, sex, and baseline clinical and echocardiographic parameters.Figure 4. Kaplan-Meier curves for study outcomes according to median value of change in (a) LVEDD, (b) EF, (c) RWT, (d) LVMI. Abbreviations: EF, ejection fraction; LVEDD, left ventricular end-diastolic dimension; LVMI, left ventricular mass index; RWT, relative wall thickness.
Discussion
KT recipients often display a complex CVD burden. Although preexisting CVD risk factors, such as volume overload, elevated blood pressure, anemia, and uremia, may improve after KT, other factors, such as dyslipidemia, glucose intolerance, and diabetes, can persist or even worsen caused to posttransplant alterations, including the use of immunosuppressant drugs, increased BMI, and posttransplant complications.3^,^11 Despite a recent decline in CVD-related deaths among transplant patients, it remains the leading cause of death in this population.1^,^2 Assessing the cardiovascular risk before KT, correcting modifiable abnormalities, and properly managing the dynamic cardiovascular risks that can arise posttransplant are important to reduce CVD risk.
Echocardiography can be a useful tool for assessing cardiac function and identifying patients at risk of CVD. Pretransplant LV geometric parameters can also be linked to cardiovascular risk, with some studies showing that concentric hypertrophy before transplant is associated with MACE after transplant.12 However, the relationship between LV geometry and transplant outcomes is complex and not fully understood. Successful KT leads to LV hypertrophy regression, and the longitudinal changes in LV geometry may affect the occurrence of CVDs differently. A recent multicenter study demonstrated that persistent LV hypertrophy was independently associated with allograft failure but not with cardiovascular morbidity or mortality.13 In another study, improvement in LVEF after KT, rather than structural changes, was associated with better long-term prognosis in patients with LV systolic dysfunction.6 However, most studies had retrospective designs with a small number of patients and different cohort structures in terms of race, comorbid condition, and CVDs, showing inconsistent results for the effect of LV geometry on KT outcomes. Conversely, this large prospective multicenter cohort study successfully determined the changes in LV remodeling during the KT and their effect on long-term clinical outcomes.
In this study, the prevalence of eccentric hypertrophy decreased, whereas concentric remodeling increased in the first 3 years after transplant. Improved anemia and blood pressure were strongly associated with a decrease in LVMI and eccentricity after KT, consistent with previous studies demonstrating that post-KT Hb levels and blood pressure are important predictors of LVEF or LVMI improvements.4^,^6 Additionally, increases in HbA_1c_ and TG levels were associated with increased RWT, suggesting that posttransplant metabolic changes may contribute to concentric hypertrophy. However, it is important to note that all individual cardiac structural parameters (LVEDD, wall thickness, and LVMI) improved after KT. The increase in RWT should therefore be interpreted as reflecting the relatively greater improvement in LV chamber size compared with wall thickness, rather than true worsening of cardiac geometry. In this context, a more mechanistically accurate interpretation would be that better control of diabetes and hyperlipidemia might be associated with more complete improvement in LV wall thickness parameters, leading to more balanced cardiac remodeling. This enhanced structural improvement could potentially translate to further reduction in MACE occurrence in patients receiving a kidney transplant because our results demonstrate that incomplete LV remodeling (reflected by increased RWT) independently predicts adverse cardiovascular outcomes.
A previous study found that myocardial TG level independently predicted myocardial concentricity in patients with diabetes as a potential driver of concentric remodeling; however, blood pressure was not correlated with concentric remodeling.14 Although the mechanism of LV concentric remodeling remains unclear, it is suggested to be caused by excessive accumulation of TGs in myocytes. Several animal and clinical studies have demonstrated an association between lipotoxicity and concentric myocardial changes.15, 16, 17, 18 Notably, glucose intolerance has also been associated with increased LV posterior wall thickness, interventricular septum, RWT, and impaired function, particularly diastolic function.19
In the posttransplant setting, weight gain and insulin resistance cause hyperinsulinemia and increased lipolysis, leading to increased free fatty acid uptake in the liver. Steroids also increase free fatty acid synthase and acetyl coenzyme A carboxylase levels, resulting in the overproduction of TGs and very LDL-Cs.20, 21, 22, 23 After KT, metabolic alterations, such as glucose intolerance, hyperlipidemia, and obesity, may contribute to cardiac steatosis, leading to concentric remodeling and hypertrophy. The counterintuitive association between metabolic parameters (HbA_1c_ and TG levels) and LVEDD improvement likely reflects the complex interplay between hemodynamic recovery and metabolic burden in the posttransplant setting. Although hemodynamic factors remained the primary drivers of LVEDD changes, metabolic control appeared to modulate the extent of cardiac structural recovery, suggesting that patients with better metabolic management might achieve more complete cardiac remodeling.
In our study, we also found an increase in the BMI, together with an increase in LDL-C and TG levels after KT. An increase in the number of patients presenting with concentric hypertrophy suggests that these metabolic changes may negatively affect cardiac structure, acting as an important risk factor for MACE compared with the overall improvement in eccentric hypertrophy after KT. Indeed, a change in RWT was significantly associated with the MACE incidence after KT. The group with increased RWT had a higher MACE, even in a multivariate analysis adjusted for classical risk factors of CVDs. Importantly, although baseline echocardiographic parameters before KT were not associated with post-KT outcomes, only changes in RWT after KT could predict MACE, indicating that changes in cardiac structure and function after KT may be more important in cardiovascular risk stratification than cardiac abnormalities before KT.
Studies conducted in patients with a hypertensive population also reported that LV geometry can be a predictor of cardiovascular morbidity and mortality. In particular, among the changes, the changes in LV geometry during antihypertensive treatment, cardiovascular morbidity, and mortality were significantly greater in concentric than in eccentric geometry.24 A study in the general population has shown that increased RWT and abnormal LV geometry independently predict adverse cardiovascular events, suggesting that RWT serves as an important cardiovascular risk marker across diverse patient populations.25 However, regarding the interaction between LV remodeling and allograft outcomes, a recent study observed that persistent LV hypertrophy was strongly associated with an increased risk of graft failure but not with cardiovascular outcomes.13 In our large multicenter prospective transplant cohort, we examined the effects of changes in LV geometry on KT outcomes and found that LV hypertrophy, particularly concentric hypertrophy, was linked to new-onset MACE, differing from these retrospective results. The close association between concentric geometry and MACE could be explained using features such as reduced myocardial contractility, severe diastolic dysfunction, increased risk of arrhythmias, and sudden death, although our findings cannot explain the exact mechanism of concentric geometry that may predispose patients to MACE.26, 27, 28
This study had some limitations. First, certain cardiovascular risk factors, such as allograft dysfunction, immunosuppressant dosage, posttransplantation complications, and economic situations, were not investigated. Second, other cardiac diseases, such as pulmonary hypertension, valvular heart disease, and arrhythmia, were not evaluated, although various echocardiographic parameters were analyzed. Third, our study included only patients who underwent both baseline and follow-up echocardiography (600 out of 1,080 total KNOW-KT participants), which may introduce selection bias as patients without follow-up echocardiography could have different clinical characteristics, disease severity, or outcomes. Fourth, the absence of detailed information on steroid dosing and rejection treatment protocols limited our ability to assess their potential impact on metabolic complications and cardiac remodeling. Finally, the participants were mainly from Korea, and hence, the results may not apply to other racial groups.
Conclusion
This large-scale multicenter prospective study evaluated the changes in metabolic and hemodynamic burden and cardiac structure and function for more than 3 years. Although KT improved LV structural parameters overall, the relatively greater improvement in LV chamber size compared with wall thickness resulted in increased RWT. Hemodynamic improvements were associated with decreased LV size, whereas better metabolic control was associated with greater wall thickness improvement. An increase in RWT independently predicted MACE occurrence. These findings suggest that optimizing metabolic control to promote more balanced LV structural improvement could enhance cardiovascular outcomes in patients receiving KTs, highlighting the importance of comprehensive metabolic management in posttransplant care.
The reference list from the paper itself. Each links out to its DOI / PubMed record.
- 1Methven S.Steenkamp R.Fraser S.UK Renal Registry 19th Annual Report: Chapter 5 survival and causes of death in UK adult patients on renal replacement therapy in 2015: National and centre-specific analyses Nephron 137Suppl 1201711715010.1159/00048136728930724 · doi ↗ · pubmed ↗
- 2Wyld M.L.R.De La Mata N.L.Masson P.O'Lone E.Kelly P.J.Webster A.C.Cardiac mortality in kidney transplant patients: a population-based cohort study 1988-2013 in Australia and New Zealand Transplantation 1052202141342210.1097/TP.000000000000322432168042 · doi ↗ · pubmed ↗
- 3Birdwell K.A.Park M.Post-transplant cardiovascular disease Clin J Am Soc Nephrol 161220211878188910.2215/cjn.0052012134556500 PMC 8729500 · doi ↗ · pubmed ↗
- 4de Verteuil I.Fitzpatrick J.Alvarez Elias A.C.Longitudinal changes in cardiac structure and function in pediatric kidney transplant recipients Hypertension 79820221680168910.1161/HYPERTENSIONAHA.121.1748335652352 · doi ↗ · pubmed ↗
- 5Lim K.Ting S.M.S.Hamborg T.Cardiovascular functional reserve before and after kidney transplant JAMA Cardiol 54202042042910.1001/jamacardio.2019.573832022839 PMC 7042833 · doi ↗ · pubmed ↗
- 6Hawwa N.Shrestha K.Hammadah M.Yeo P.S.D.Fatica R.Tang W.H.W.Reverse remodeling and prognosis following kidney transplantation in contemporary patients with cardiac dysfunction J Am Coll Cardiol 661620151779178710.1016/j.jacc.2015.08.02326483101 PMC 4615582 · doi ↗ · pubmed ↗
- 7Yang J.Lee J.Huh K.H.KNOW-KT (Korea N cohort study for outcome in patients with kidney transplantation: a 9-year longitudinal cohort study): study rationale and methodology BMC Nephrol 1520147710.1186/1471-2369-15-7724884405 PMC 4022441 · doi ↗ · pubmed ↗
- 8Charlson M.Szatrowski T.P.Peterson J.Gold J.Validation of a combined comorbidity index J Clin Epidemiol 471119941245125110.1016/0895-4356(94)90129-57722560 · doi ↗ · pubmed ↗