Evaluating the methodological suitability of partial dependence plots and Shapley additive explanations for population-level interpretation of machine learning models in total joint arthroplasty
Kole Joachim, Othneil Sparks, Amanda Perrotta, Adrian Lin, Brandon Gettleman, Christopher Hamad, Sumin Jeong, Ezekiel Dingle, Alexandra Stavrakis, Alexander B. Christ

TL;DR
This study compares two methods for interpreting machine learning models in joint replacement surgery, finding that partial dependence plots are better for creating population-level clinical guidelines.
Contribution
The study evaluates PDPs and SHAP for population-level interpretation in TJA risk prediction, highlighting PDPs' suitability for clinical guideline development.
Findings
PDPs showed 97.8% agreement with SHAP in directional trends, validating their comparison.
PDPs revealed actionable thresholds for preoperative hematocrit, operative time, and feature interactions like age × ASA classification.
Interaction effects accounted for nearly half of the model's influence, emphasizing the importance of complementary relationships.
Abstract
Total joint arthroplasty (TJA) complications necessitate the development of accurate risk prediction models; however, interpretability in machine learning remains a challenge. While Shapley Additive Explanations (SHAP) offers insights at the individual level, partial dependence plots (PDPs) may provide a better understanding at the population level for developing clinical guidelines. This study compared PDPs and SHAP in explaining machine learning-based 30-day complication risk prediction following TJA. We conducted a retrospective cohort study using the American College of Surgeons National Surgical Quality Improvement Program (NSQIP) database (2019–2023), including 517,826 primary TJA cases. Binary classification models (Random Forest, Gradient Boosting) predicted composite 30-day complications based on 20 clinical predictors. A comprehensive interpretability analysis employed…
Genes, proteins, chemicals, diseases, species, mutations and cell lines named across the full text — each resolved to its canonical identifier and authoritative record.
Click any figure to enlarge with its caption.
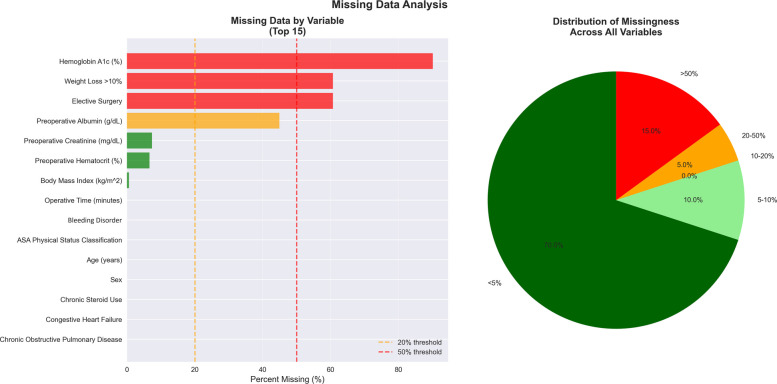 Figure 1
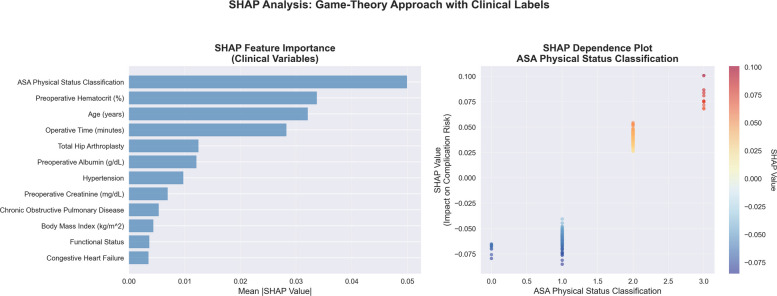 Figure 2
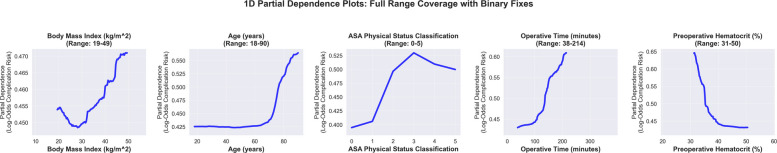 Figure 3
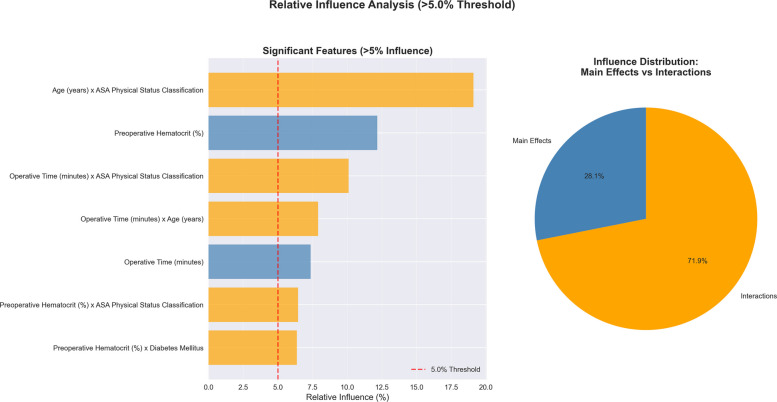 Figure 4
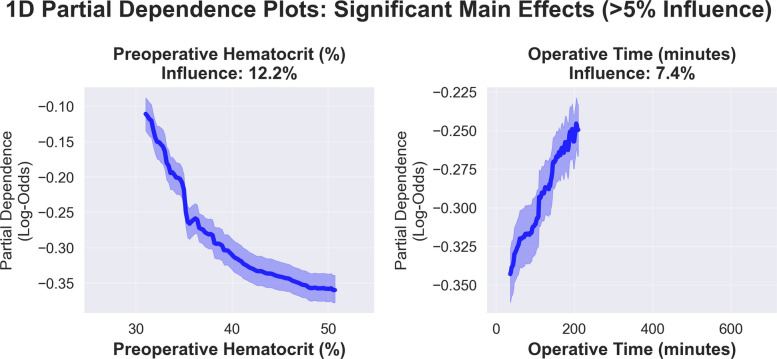 Figure 5
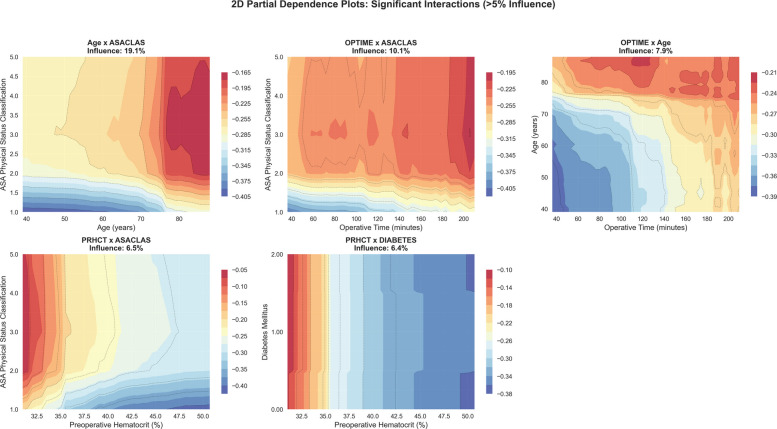 Figure 6
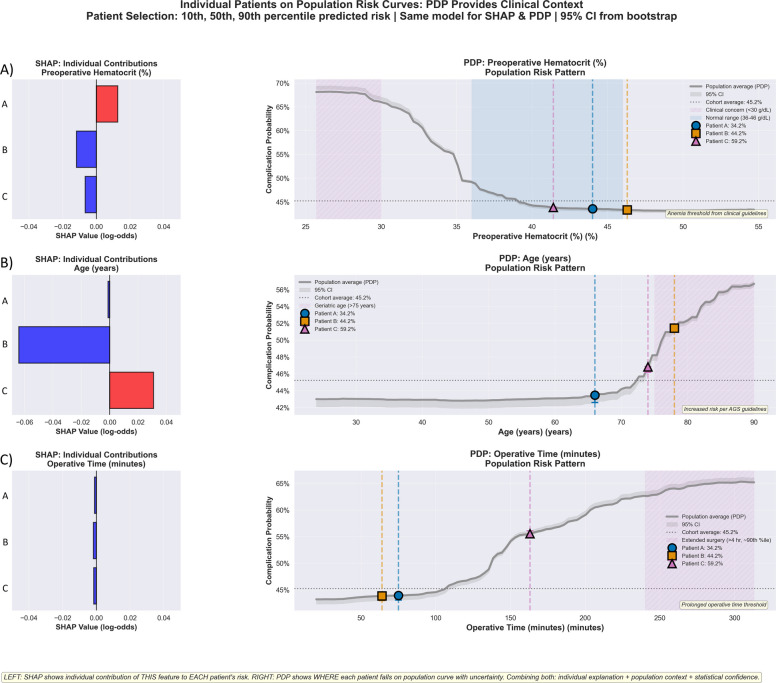 Figure 7
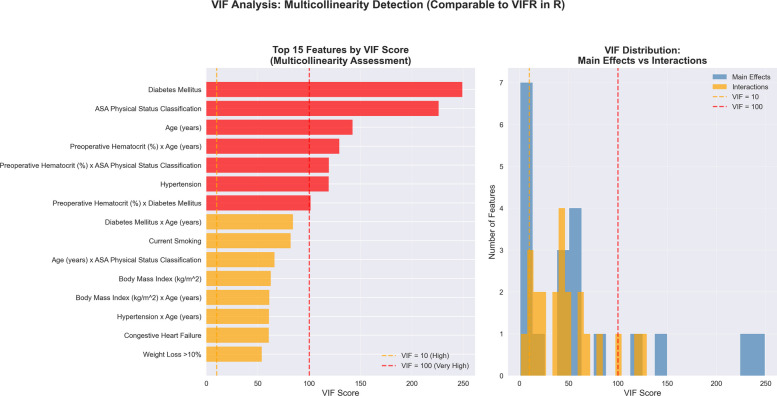 Figure 8
Peer Reviews
No public reviews on file for this paper yet. If you reviewed it on a platform where reviews are public (OpenReview, ICLR, NeurIPS, ICML), you can paste yours below so the community can read it here.
Videos
No videos yet. Explain this paper in a talk, walkthrough, or lecture? Add one.
Taxonomy
TopicsExplainable Artificial Intelligence (XAI) · Artificial Intelligence in Healthcare and Education · Advanced Causal Inference Techniques