Quality of life changes in cluster headache: Convergent validity, responsiveness, and interpretability of the Cluster Headache Quality of Life scale as a patient‐reported outcome measure
Willemijn C. Naber, Paulien J. van Tilborg, Roemer B. Brandt, Julia J. Jansen, Leopoldine A. Wilbrink, Wim M. Mulleners, Erkan Kurt, Willemijn Leen, Frank J. P. M. Huygen, Denise Bijlenga, Rolf Fronczek

TL;DR
This study validates a quality of life scale for cluster headache patients, showing it effectively tracks changes and highlights mental health and daily activity as key factors.
Contribution
The CHQ scale is validated as a reliable patient-reported outcome measure for tracking quality of life changes in cluster headache patients.
Findings
The CHQ has high convergent validity and responsiveness for measuring quality of life changes.
Mental health and activity restrictions correlate more strongly with quality of life than attack frequency.
A change of ≤−3.5 points indicates clinically relevant improvement in quality of life.
Abstract
Cluster headache (CH) significantly impacts patients' quality of life (QoL). We aim to validate the Cluster Headache Quality of Life scale (CHQ) for measuring QoL changes in patients with CH. In this multicenter, prospective, longitudinal psychometric validation study, participants, all with chronic CH (CCH), completed the CHQ at a 3‐monthly interval alongside headache diaries and general QoL questionnaires (36‐item Short Form [SF‐36], Hospital Anxiety and Depression Scale [HADS], and EuroQol 5 Dimensions [EQ‐5D]). CHQ's ability to measure changes was validated in three steps following COSMIN guidelines: (1) convergent validity, (2) responsiveness, and (3) interpretability. Baseline scores were used for step 1; change scores for steps 2 and 3 (Δ baseline—follow‐up). Twelve correlation hypotheses were formulated and tested for steps 1 and 2. Validity was rated by % rejected hypotheses…
Genes, proteins, chemicals, diseases, species, mutations and cell lines named across the full text — each resolved to its canonical identifier and authoritative record.
Click any figure to enlarge with its caption.
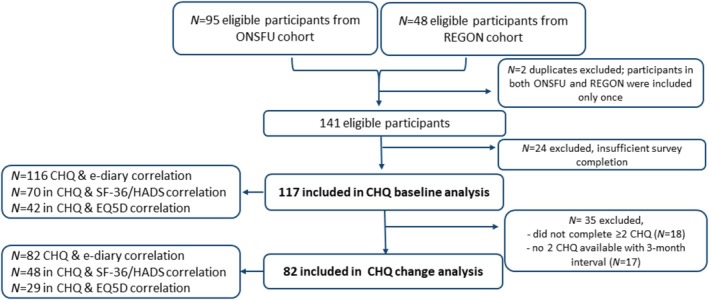 FIGURE 1
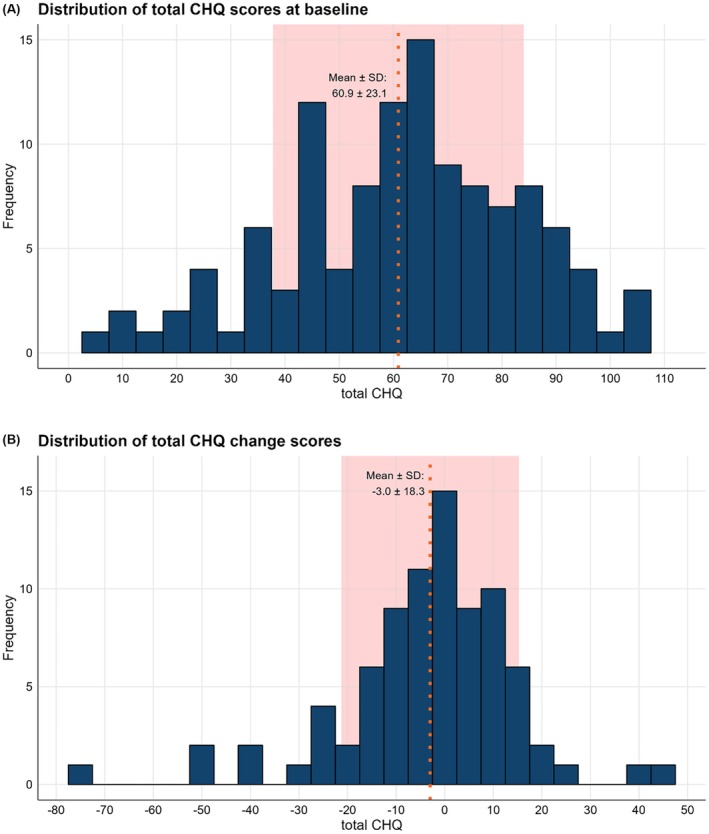 FIGURE 2
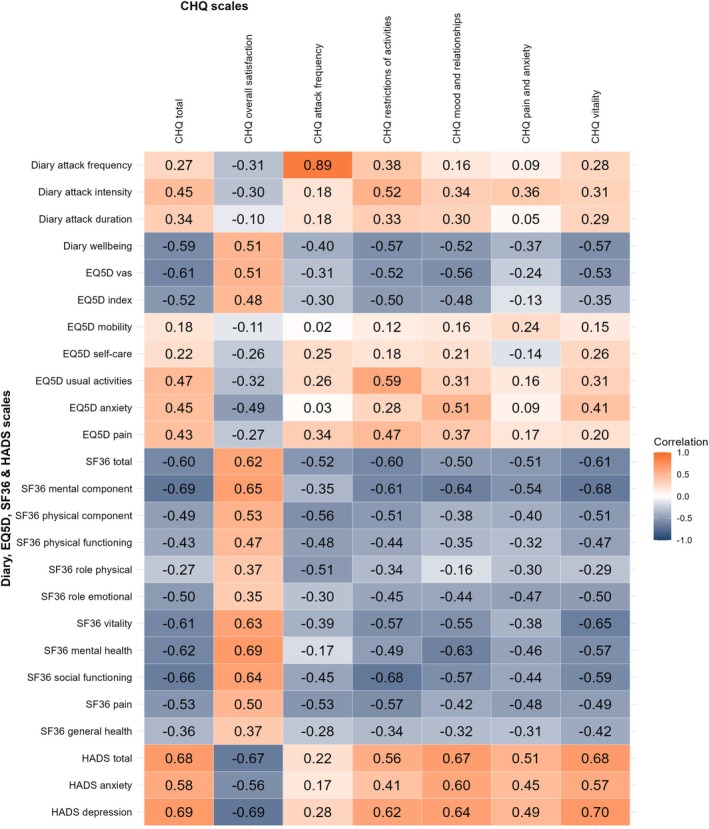 FIGURE 3
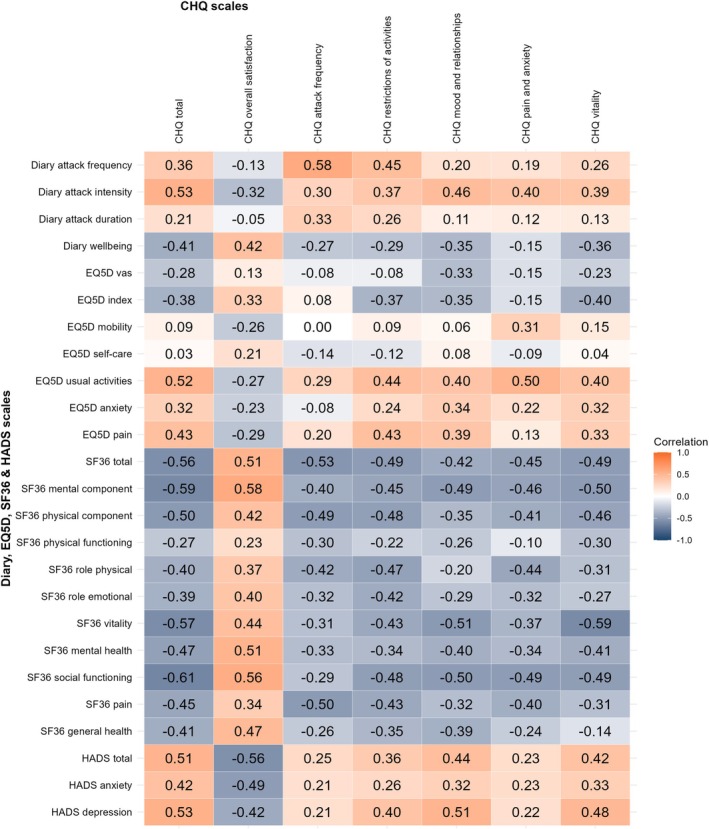 FIGURE 4
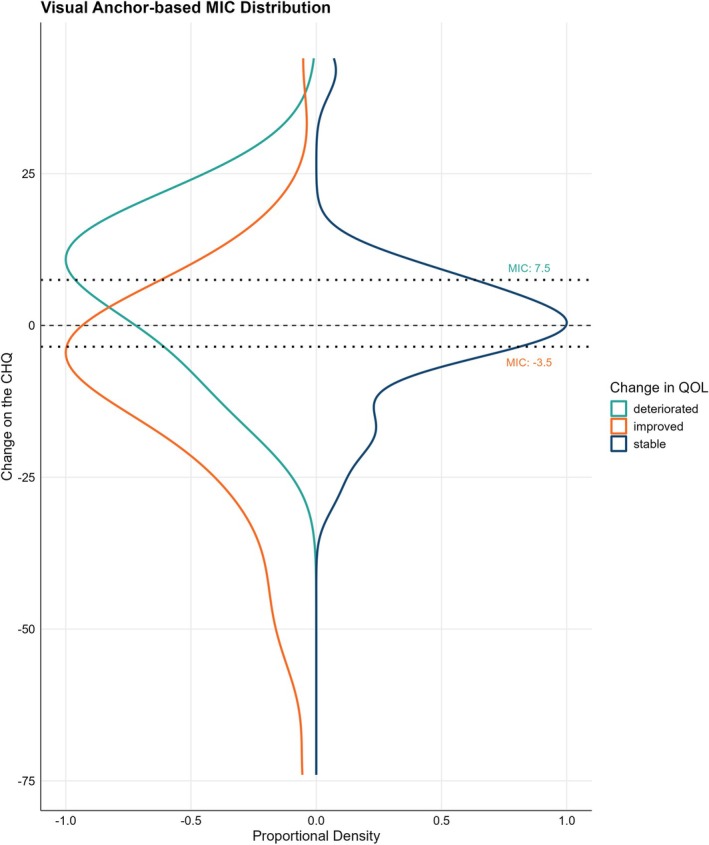 FIGURE 5
| Hypotheses | Hypothesis confirmed or rejected | Comments |
|---|---|---|
|
The CHQ total score has a | Confirmed |
ONSFU |
|
The CHQ total score has a | Confirmed |
ONSFU |
|
The CHQ total score has a | Confirmed |
ONSFU |
|
The CHQ total score has a | Confirmed |
ONSFU |
|
The CHQ total score correlates stronger with the EQ‐5D, SF‐36, and HADS, than with the attack frequency | Confirmed |
Attack frequency: ONSFU ✓, REGON ✓ (Supporting Information |
|
None of the CHQ subscales (excluding the overall QoL question) have a | Rejected |
1/72 with ONSFU ✗, REGON ✓ (Supporting Information |
|
The overall QoL of the CHQ correlates stronger than the other CHQ subscales to the subscales of the SF‐36, EQ‐5D, and HADS. | Rejected |
Overall QoL of the CHQ correlates mostly similar to the other subscales. ONSFU ✗, REGON ✗ (Supporting Information |
|
The CHQ mood subscale correlates stronger than the other subscales (excluding the overall QoL question) with subscales of the SF‐36, EQ‐5D, and the HADS. | Rejected |
EQ5D: in 4/5 strongest correlation; SF‐36: in 1/8 strongest correlation; HADS: in 0/3 strongest correlation; ONSFU ✗, REGON ✗ (Supporting Information |
|
At least 50% of CHQ subscales have a | Confirmed | 2/4 of CHQ subscales correlate ≥ −0.39 with the SF‐36 physical functioning subscale. ONSFU ✓, REGON N.A. |
|
The majority of CHQ subscales have a | Confirmed |
3/4 of CHQ subscales correlate ≥ −0.39 with the SF‐36 general health subscale. ONSFU ✓, REGON N.A. (Supporting Information |
|
The majority of CHQ subscales have a | Confirmed |
4/4 of CHQ subscales correlate ≤0.29 with the EQ‐5D mobility subscale. ONSFU N.A, REGON ✓(Supporting Information |
|
The majority of CHQ subscales correlate at least negative | Confirmed |
4/4 of CHQ subscales correlate ≤ −0.30 with the SF‐36 mental health subscale. ONSFU ✓, REGON N.A. (Supporting Information |
| Total number of hypotheses that were rejected | 3/12 | |
| Percentage of hypotheses that were rejected | 25% |
Validity:
Poor: ≥ 50% rejected (≥7/12) |
| Hypotheses | Hypothesis confirmed or rejected | Comments |
|---|---|---|
|
The change on the CHQ total score has a | Confirmed |
ONSFU |
|
The change on the CHQ total score has a | Confirmed |
ONSFU |
|
The change on the CHQ total score has a | Confirmed |
ONSFU |
|
The correlation between the change scores of the diary attack frequency and the CHQ total score is stronger than the correlation between the baseline scores of the total CHQ and the diary attack frequency ( | Confirmed |
ONSFU |
|
The change on the CHQ total score correlates stronger with the change on the SF‐36 and HADS, than with the change on the weekly attack frequency (diary) | Confirmed |
ONSFU REGON |
|
The majority of change scores of the CHQ subscales have a | Confirmed |
3/4 have a ONSFU N.A., REGON ✓ (Supporting Information |
|
The majority of change scores of the CHQ subscales correlate at least negative | Confirmed |
4/4 have a ONSFU ✓, REGON N.A. (Supporting Information |
|
The change score of the CHQ monthly attack frequency has a | Confirmed |
ONSFU |
|
The change score of the CHQ vitality has a | Confirmed |
ONSFU |
|
The change score of the CHQ pain and anxiety has a | Confirmed |
4/5, only EQ‐5D usual activities has a stronger correlation: ONSFU N.A., REGON ✓ (Supporting Information |
|
The change score of the CHQ restriction of activities has a | Confirmed |
ONSFU |
|
The change score of the CHQ vitality has a | Confirmed |
ONSFU |
| Total number of hypotheses that were rejected | 0/12 rejected | |
| Percentage of hypotheses that were rejected | 0% |
Validity:
Poor: ≥50% rejected (≥7/12) |
| Parameter | Baseline population | ONSFU cohort | REGON cohort | Change population | ONSFU cohort | REGON cohort |
|---|---|---|---|---|---|---|
| Total ( | ( | ( | Total ( | ( | ( | |
| Age, years | 47.0 (34.0–57.0) | 47.0 (34.5–57.5) | 49.0 (34.5–54.0) | 48 (35; 57) | 47.0 (35.0–59.0) | 49.0 (36.0–52.0) |
| Male | 69 (59%) | 42 (56%) | 27 (64%) | 50 (61%) | 32 (60%) | 18 (62%) |
| Years since diagnosis | 12.0 (7.0–21.0) | 13.0 (8.0–21.5) | 9.0 (6.0–17.5) | 11.0 (6.0–21.0) | 16.0 (8.0–24.0) | 8.0 (6.0–18.0) |
| Smoker | 56 (49%) | 33 (45%) | 23 (55%) | 39 (49%) | 23 (45%) | 16 (55%) |
| Comorbid Headache | 21 (18%) | 11 (15%) | 10 (24%) | 16 (20%) | 8 (15%) | 8 (28%) |
| Attack frequency, weekly | 12.0 (4.4–25.1) | 11.8 (3.9–28.2) | 12.0 (7.8–20.3) | 11.8 (4.0–25.3) | 11.7 (3.8–28.3) | 12.0 (8.3–18.0) |
| Attack intensity, scale 0–10 | 7.4 (6.0–8.7) | 8.0 (6.0–9.5) | 7.0 (6.2–7.7) | 7.3 (6.0–8.5) | 7.3 (6.0–9.0) | 7.2 (6.3–8.0) |
| Attack duration, minutes | 30.0 (18.3–60.0) | 30.0 (20.0–61.7) | 28.3 (18.3–60.0) | 28.3 (18.3–60.0) | 28.3 (18.3–61.7) | 29.3 (18.3–60.0) |
| CHQ baseline score | 60.8 (±23.3) | 64.1 (±24.2) | 54.9 (±20.4) | 55.8 (±23.3) | 58.2 (±24.6) | 51.6 (±20.2) |
|
| ||||||
| ONSFU | 75 (64%) | 75 (100%) | 0 (0%) | 53 (65%) | 53 (100%) | 0 (0%) |
| REGON | 42 (36%) | 0 (0%) | 42 (100%) | 29 (35%) | 0 (0%) | 29 (100%) |
| Parameter | Baseline | Change | Directional | Improved QoL group | Deteriorated QoL group |
|---|---|---|---|---|---|
| scores | |||||
| scores | Non‐directional | scores | scores | ||
| CHQ |
|
|
|
|
|
| Total | 60.9 ± 23.1 | Δ8.0 (3.0; 16.0) | Δ −3.2 ± 18.3 | Δ −10.9 ± 21.5 | Δ 6.7 ± 11.4 |
| Restrictions of activities | 21.9 ± 8.8 | Δ4.0 (2.0; 7.0) | Δ −1.9 ± 7.4 | Δ −5.3 ± 8.5 | Δ 2.2 ± 5.0 |
| Impact on mood and relationships | 21.0 ± 10.3 | Δ4.0 (2.0; 7.0) | Δ −0.3 ± 7.3 | Δ −2.5 ± 8.0 | Δ 3.1 ± 6.6 |
| Pain and anxiety | 5.4 ± 2.0 | Δ2.0 (1.0; 3.0) | Δ −0.6 ± 2.1 | Δ −1.1 ± 2.4 | Δ 0.1 ± 1.5 |
| Lack of vitality | 12.6 ± 4.3 | Δ2.0 (1.0; 3.0) | Δ −0.5 ± 4.1 | Δ −2.1 ± 4.6 | Δ 1.4 ± 3.0 |
| Overall satisfaction, scale 0–10 | 5.4 ± 2.1 | Δ1.0 (0.0; 2.0) | Δ 0.1 ± 1.6 | Δ 0.7 ± 1.6 | Δ −0.9 ± 1.3 |
| Headache diary |
|
|
|
|
|
| Attack frequency | 12.0 (4.4; 25.1) | Δ3.6 (0.7;9.0) | Δ −1.1 ± 9.1 | Δ −3.1 ± 7.7 | Δ 2.7 ± 12.8 |
| Attack intensity, scale 1–10 | 7.4 (6.0; 8.7) | Δ0.8 (0.2;1.5) | Δ −0.2 ± 1.9 | Δ −0.9 ± 1.9 | Δ 0.8 ± 1.9 |
| Attack duration, minutes | 30.0 (18.3; 60.0) | Δ6.5 (1.0;15.0) | Δ −7.3 ± 46.6 | Δ −11.9 ± 55.3 | Δ 2.7 ± 21.2 |
| Overall wellbeing, scale 0–6 | 2.9 ± 1.2 | Δ0.8 (0.2;1.2) | Δ 0.1 ± 1.2 | Δ 0.7 ± 1.2 | Δ −0.6 ± 0.9 |
| EQ‐5D |
|
|
|
|
|
| VAS | 59.3 ± 20.1 | Δ17.0 (8.0; 25.0) | Δ 3.5 ± 20.6 | Δ 9.8 ± 22.2 | Δ−10.7 ± 9.1 |
| Index | 0.61 ± 0.23 | Δ0.18 (0.04; 0.30) | Δ 0.1 ± 0.2 | Δ 0.26 ± 0.17 | Δ −0.14 ± 0.10 |
| Mobility | 1.3 ± 0.7 | Δ0.0 (0.0; 0.0) | Δ −0.1 ± 0.6 | Δ −0.1 ± 0.6 | Δ 0.0 ± 0.6 |
| Self‐care | 1.1 ± 0.4 | Δ0.0 (0.0; 0.0) | Δ −0.1 ± 0.3 | Δ −0.1 ± 0.2 | Δ −0.1 ± 0.4 |
| Usual activities | 2.3 ± 1.1 | Δ1.0 (0.0; 1.0) | Δ −0.3 ± 1.1 | Δ −0.6 ± 1.1 | Δ 0.4 ± 0.8 |
| Anxiety | 2.1 ± 1.0 | Δ1.0 (0.0; 1.0) | Δ −0.4 ± 1.0 | Δ −1.0 ± 0.6 | Δ 0.4 ± 1.1 |
| Pain | 3.1 ± 1.1 | Δ1.0 (0.0; 1.0) | Δ −0.7 ± 1.2 | Δ −1.3 ± 1.1 | Δ 0.4 ± 0.8 |
| SF‐36 |
|
|
|
|
|
| Total | 46.7 ± 19.9 | Δ7.9 (2.6; 15.2) | Δ 0.1 ± 14.4 | Δ 12.1 ± 7.8 | Δ −16.4 ± 11.1 |
| Physical component | 50.0. ± 23.8 | Δ5.4 (2.8; 14.6) | Δ −1.0 ± 14.9 | Δ 10.3 ± 9.9 | Δ −16.1 ± 13.3 |
| Mental component | 44.6 ± 21.2 | Δ10.0 (2.9;20.0) | Δ 0.9 ± 18.3 | Δ 14.1 ± 15.2 | Δ −17.7 ± 14.6 |
| Physical functioning | 66.5 ± 25.8 | Δ5.0 (5.0; 15.0) | Δ −1.4 ± 12.2 | Δ 6.7 ± 11.4 | Δ −11.2 ± 10.0 |
| Role physical | 25.7 ± 39.3 | Δ0.0 (0.0; 28.1) | Δ −1.1 ± 40.1 | Δ 19.7 ± 31.0 | Δ −31.7 ± 47.7 |
| Role emotional | 50.2 ± 44.7 | Δ16.7 (0.0;66.7) | Δ 1.1 ± 48.7 | Δ 28.9 ± 35.9 | Δ −46.7 ± 46.8 |
| Vitality | 36.0 ± 21.6 | Δ5.0 (5.0; 11.3) | Δ −0.2 ± 15.1 | Δ 7.89 ± 15.3 | Δ −8.8 ± 14.2 |
| Mental health | 57.7 ± 21.9 | Δ8.0 (4.0, 16.0) | Δ 2.0 ± 18.6 | Δ 11.9 ± 20.1 | Δ −10.0 ± 16.9 |
| Social functioning | 20.8 ± 14.6 | Δ1.0 (0.0; 13.0) | Δ 0.2 ± 14.2 | Δ 9.5 ± 13.5 | Δ −11.1 ± 12.5 |
| Pain | 16.1 ± 14.5 | Δ7.6 (0.0, 13.0) | Δ 1.3 ± 12.7 | Δ 9.1 ± 12.3 | Δ −9.6 ± 10.3 |
| General health | 41.2 ± 23.5 | Δ5.0 (2.5, 15.0) | Δ 0.9 ± 13.3 | Δ 14.1 ± 15.2 | Δ −6.7 ± 12.5 |
| HADS |
|
|
|
|
|
| Total | 16.5 ± 9.5 | Δ4.0 (2.0; 7.0) | Δ −0.4 ± 7.6 | Δ −4.5 ± 7.3 | Δ 5.3 ± 7.5 |
| Anxiety | 8.1 ± 4.9 | Δ2.0 (1.0; 3.6) | Δ −0.6 ± 4.1 | Δ −2.3 ± 4.2 | Δ 2.1 ± 4.4 |
| Depression | 8.5 ± 5.4 | Δ2.0 (1.0; 4.0) | Δ 0.2 ± 4.1 | Δ −2.3 ± 3.7 | Δ 3.2 ± 3.8 |
| Parameter |
| 95% CI |
|
|---|---|---|---|
| Age, years | −0.17 | −0.50 to 0.12 | 0.222 |
| Sex, female | 2.47 | −5.50 to 10.45 | 0.540 |
| Years since diagnosis | −0.001 | −0.020 to 0.017 | 0.888 |
| Comorbid headache | −3.40 | −12.80 to 6.00 | 0.474 |
| Attack frequency, weekly | 0.27 | 0.02–0.53 |
|
| Attack intensity, scale 0–10 | 2.92 | 0.91–4.93 |
|
| Attack duration, minutes | 0.01 | −0.07 to 0.08 | 0.871 |
- —ZonMw10.13039/501100001826
Peer Reviews
No public reviews on file for this paper yet. If you reviewed it on a platform where reviews are public (OpenReview, ICLR, NeurIPS, ICML), you can paste yours below so the community can read it here.
Videos
No videos yet. Explain this paper in a talk, walkthrough, or lecture? Add one.
Taxonomy
TopicsMigraine and Headache Studies · Musculoskeletal pain and rehabilitation · Trigeminal Neuralgia and Treatments
INTRODUCTION
Cluster headache (CH) is a primary headache characterized by unilateral, extremely painful, headache attacks.1 In episodic cluster headache (ECH, 80% of cases) the attacks occur in episodes lasting weeks or months, with remission intervals of months to years.1 Patients with chronic cluster headache (CCH, 20% of cases) have headache attacks with less than 3 consecutive months of remission per year.2 Due to the severity of the disease, CH can lead to significant disability and a decreased quality of life (QoL).3 During clinical or research follow‐up, the burden of disease is mainly assessed by symptom severity and—especially—attack frequency. However, as is highlighted by discrepancies between attack frequency and patient‐reported treatment satisfaction in clinical trial results, attack frequency alone does not fully explain the perceived disease burden.
In recent years, there has been a growing focus on patient‐reported outcome measures (PROMs). Reflecting this, the revised clinical trial guidelines for cluster headache recommend incorporating these measures as clinical trial endpoints.4 Previously, no CH‐specific questionnaires were available and QoL was measured with generic scales (e.g., 36‐itme Short Form [SF‐36]). However, recently, cluster headache‐specific QoL questionnaires, such as the Cluster Headache Quality of Life scale (CHQ), have been developed.5 When implemented, these questionnaires will improve our understanding of the specific QoL domains affected in CH and bridge the gap between objective symptom severity and subjective patient‐reported QoL. This will facilitate more accurate assessment of disease burden in both clinical practice and research evaluations.
To accurately assess QoL in CH, it is essential to verify the reliability and validity of this disease‐specific instrument for use by researchers and clinicians. The COSMIN (COnsensus‐based Standards for the selection of health Measurement INstruments) guidelines underline that validation should not only address scores at a single time point but also the sensitivity and accuracy of capturing change in scores over time.6, 7 Change scores are used to draw conclusions about the effect of treatment on QoL and patient improvement, therefore ensuring reliability of these scores is essential. Responsiveness is the term that is used to describe the ability of an instrument to detect changes over time in the construct (the intended concept to be measured, here QoL) that it measures.7
The CHQ is a short, easy to use questionnaire relating to patients' daily activities. The scale was developed in consultation with people with cluster headache and clinicians in 2016 and has subsequently been validated, translated, and implemented in various Dutch clinical studies.5, 8 The CHQ has been established as reliable and its construct validity was excellent.5, 8 For convergent validity (correlation between measures of related topics), it has been shown that CHQ scores correlate with those of the SF‐36 and the EuroQol 5 Dimensions (EQ‐5D) when comparing them at a single timepoint. However, correlation between changes in scores of these questionnaires and CHQ's correlation to attack frequency or intensity have not yet been studied.5, 8 Additionally, validation of the responsiveness of the CHQ—its “sensitivity to change”—and the minimally clinically relevant change in the CHQ have not yet been investigated.5
We aim to validate the ability of the CHQ to measure QoL changes in CH in three steps: (i) convergent validity, (ii) responsiveness, and (iii) interpretability of the CHQ. Convergent validity will be assessed by exploring the impact of, and correlation between, factors influencing QoL in chronic cluster headache. Secondly, we aim to examine the responsiveness of the CHQ to validate whether it can accurately detect changes in CH symptoms and QoL over time, and lastly we aim to define guidelines for interpreting changes in CHQ scores. Overall, validating the CHQ can provide valuable insights into the burden of CH and facilitate its implementation in clinical practice and clinical trials, ultimately improving disease management and research outcomes.
METHOD
Design and participants
In this multicenter, prospective, longitudinal psychometric validation study, participants, all with chronic cluster headache, were included who completed the CHQ as part of two ongoing Dutch prospective CCH cohorts (ONSFU cohort, NL75958.058.20; REGON cohort, NCT 05324748) via three tertiary referral centers (Leiden University Medical Center, Canisius Wilhelmina Hospital, Zuyderland Medical Center). In the REGON cohort, a double‐blinded randomized clinical trial is conducted in which the intervention consists of repeated greater occipital nerve (GON) injections with either methylprednisolone (80 mg) or placebo (NaCl 0.9%). In the ONSFU cohort, an observational prospective study, the intervention involves implantation of an occipital nerve stimulator (ONS). The current study focuses on changes in QoL, as measured by the CHQ, irrespective of the intervention. Efficacy of the respective interventions of the REGON and ONSFU will be published separately upon completion of these studies.
Inclusion criteria for the current study were: diagnosis of chronic cluster headache as defined by the International Classification of Headache Disorders, third edition (ICHD3) criteria1 (thus active cluster headache during both measurements), age ≥ 16 years, proficient in Dutch to complete the questionnaires and e‐diaries. For the baseline analysis, all participants with sufficient survey compliance and completion of one or more CHQ were included. For change analysis, participants needed to have completed the CHQ twice or more with an interval of approximately 3 months. When possible, CHQ measurements surrounding pre‐ and post‐intervention (baseline and follow‐up) were selected. If preintervention data were unavailable, the first subsequently completed measurement was used as baseline assessment. This ensures that enough “change” in patients' cluster headache symptoms could be expected during the 3‐month interval. All participants provided written informed consent for trial‐participation and a waiver for use of secondary data for this study. Ethical approval was provided by the Medical Research Ethics Committee of the Leiden University Medical Center (METC‐LDD of LUMC; REGON: P22.022;ONSFU: P21.004). Data were collected between 9 December 2021 and 18 November 2024.
In order to have adequate power to perform a responsiveness analysis, the COSMIN guideline recommends to include at least 30 patients. No formal statistical power calculation was conducted prior to the study. Instead, the sample size was determined by available data from our clinical cohort. We verified that our sample size met the minimum COSMIN requirements before proceeding with the analysis.
Questionnaires
Participants completed the CHQ at 3‐monthly intervals. Headache diaries and QoL questionnaires that were completed during the same timeframe as the CHQ were collected. Both cohorts completed the CHQ and cluster headache diaries during their prospective follow‐up. The ONSFU cohort also completed the Hospital Anxiety and Depression Scale (HADS) and the 36‐item Short Form (SF‐36), where the REGON cohort completed the EQ‐5D 5 Levels (EQ‐5D‐5L) on top of the CHQ.
CHQ scale (CHQ)
The CHQ scale is a validated questionnaire that consists of 28 questions covering four domains related to QoL: “restriction of activities of daily living,” “impact on mood and interpersonal relationships,” “pain and anxiety,” and “lack of vitality” (Supporting Information S1).5, 8 Items are scored on a 5‐point Likert scale (Never = 0, Always = 4) with a minimum score of 0 and maximum score 112, where higher scores indicate poorer health related QoL. In addition, the CHQ also records the amount of cluster headache attacks in the previous month and a visual analogue scale (VAS) ranging from “not at all satisfied with life” to “very satisfied with life” is included. These last two items are not included in the total CHQ score.
CH diary
The CH diary is an electronic diary in which participants record the weekly attack frequency, duration, and intensity (11‐point Likert scales, ranging from ‘0 = No pain’ to ‘10= Worst pain imaginable’) and general well‐being (7‐point Likert scale, ranging from ‘0 = Very bad’ to ‘6 = Very well’).
HADS
The HADS is a validated questionnaire to screen for anxiety disorder and depression, that consists of 14 items that are answered on a 4‐point Likert scale (range 0–3).9 The subscales Depression and Anxiety are scored as the sum of the seven associated items with a score range of 0–21, with higher scores indicating more symptoms associated with anxiety and depression (cutoff scores are defined as: no (0–8), possible (8–10), or suspected (11–21) anxiety or depression disorder).
EQ‐5D
The EQ‐5D is a validated generic quality of life questionnaire that uses a descriptive system of five health domains (mobility, self‐care, usual activities, pain, and anxiety) and is scored on a 5‐point Likert scale ranging from no problem (1) to extreme problems (5).10 An index value can be derived that represents the health state ranging between −0.599 and 1 (1: best possible health state, 0 is death and negative values represent health states perceived as worse than dead).11 The EuroQol visual analogue scale (EQ VAS) scores general health on a scale from 0 (worst imaginable health state) to 100 (best imaginable health state). A change of 0.03 on the EQ‐5D index has been defined as the minimally important change (MIC).12, 13, 14
SF‐36
The SF‐36 is a generic QoL measurement with excellent reliability and validity that measures general health‐related QoL over the past 4 weeks.15 It measures functioning with eight subscales (Physical Functioning, Role Physical, Bodily Pain, General Health, Vitality, Social Functioning, Role Emotional, and Mental Health) and two component scores (Mental and Physical Component). All subscales and component scores are scored on a scale from 0 to 100 with higher scores indicating better QoL. A change of 3 points was defined as MIC.15, 16
Validation analyses
The ability of the CHQ to measure QoL changes in CH was validated in three steps:
- Convergent validity: the ability of the CHQ to measure QoL at baseline by evaluating correlation of the CHQ with other measurements.
- Responsiveness validity: the ability of the CHQ to detect change in QoL over time (i.e., following treatment).
- Interpretability: define guidelines for interpreting changes in CHQ scores by determining the MIC.
The recommendations for the reporting and validation of PROMS as stated by the COSMIN guidelines were followed.6, 7 For steps 1 and 2, a hypotheses‐driven correlation analysis was applied, as advised by the COSMIN guidelines in the absence of a gold standard for CH‐specific QoL outcomes.6 Specific hypotheses regarding correlations between CHQ, SF‐36, HADS, EQ‐5D, and headache diary outcomes were independently formulated by the authors (P.T., R.B., W.N.) and finalized in a consensus meeting, resulting in 12 hypotheses. Validity was considered high if 25% or less of the hypotheses were rejected, moderate if 26%–50% were rejected, and poor if more than 50% of the hypotheses were rejected, per recommendation by the COSMIN guidelines.17, 18 The hypothesis‐driven correlation analysis was applied twice: initially for correlations between baseline scores (step 1. convergent validation) and then for correlations between changes scores (step 2. responsiveness validity). A sensitivity analysis was performed to repeat correlation analysis of both steps stratified by cohort (ONSFU vs. REGON cohort) to address whether population heterogeneity has a significant effect.
Step 1. Convergent validity
The hypotheses‐driven correlation analysis was applied to validate convergent validity and the hypotheses proposed about correlations between the baseline scores of CHQ, SF‐36, HADS, EQ‐5D, and headache diary measurements are presented in Table 1. Hypotheses 2–4 and 6–12 pertain to correlations of the score of the CHQ and other QoL measurements. Hypotheses 1 and 5 pertain to correlations of the CHQ and disease activity as measured by headache diaries. In general, a higher correlation was expected between the CHQ (subscales) and items that overlap due to similar wording and items that focus on mental health. Argumentation for individual hypotheses can be found in Supporting Information S2.
Impact of baseline characteristics on the total score of the CHQ were explored using linear regression analysis.
Step 2. Responsiveness validity
Change scores for the CHQ, SF‐36, HADS, EQ5D, and headache diary measurements were calculated as the difference between baseline and 3 months follow‐up assessments.
A second hypotheses‐driven correlation analysis was used to validate responsiveness. New hypotheses, describing expected correlations between change scores across instruments, were postulated after the baseline analysis. Hypotheses 1–3 and 6–12 concerned correlations between changes in CHQ scores and other QoL measurements (Table 2), whereas hypotheses 4 and 5 concerned correlations between changes in CHQ scores and headache diary outcomes.
A stronger correlation was expected between change scores of overlapping domains, particularly those related to mental health or those demonstrating strong baseline correlations. Argumentation for individual hypotheses can be found in Supporting Information S3. Two secondary analyses explored these correlations (i) in a subpopulation of participants with impaired baseline QoL (SF‐36 score < 80 or EQ‐5D index <0.85, cutoff based normative data11, 15) and (ii) using relative rather than absolute change scores.
Step 3. Interpretability
We defined guidelines for interpreting changes in CHQ scores by determining the MIC. For this, we first described the proportion of participants who had an important change in their QoL. Participants were classified in three groups (deteriorated, stable, improved) using anchors: a change of ≥3 points in SF‐36 score or ≥0.03 points in EQ‐5D index indicated improvement or deterioration, respectively.12, 13, 14, 15, 16 Participants whose QoL change fell between −0.03 and +0.03 points (EQ‐5D) or −3 and +3 points (SF‐36), respectively, were classified as stable. Each participant contributed data from only one instrument (SF‐36 or EQ‐5D), as the cohorts were distinct and nonoverlapping (REGON: SF‐36; ONSFU: EQ‐5D), thereby avoiding any ambiguity. The sum of participants in the “deteriorated” and “improved” groups represented the proportion of participants with a clinically significant changed QoL.
The visual anchor‐based MIC distribution method was used to determine the MIC of the CHQ as proposed by the COSMIN guidelines.6, 19 First, the population was grouped based on the previously described anchors. Second, the distribution of change scores of each group was plotted using proportional frequencies to ensure equal areas under the curves for the three groups. Lastly, the optimal receiver‐operating characteristic (ROC) cutoff point that led to the least misclassified participants was determined based on the value where [1−sensitivity] + [1−specificity] is smallest; this ROC cutoff point was the MIC value. Separate MIC values were calculated for “improvement” and “deterioration,” as these scores are known to differ, in accordance with COSMIN guidelines.
Statistical analysis
All descriptive data were checked visually for distribution. They are presented as number (percentage) for categorical variables, mean ± standard deviation (SD) for symmetrically distributed continuous data, and median (interquartile range [IQR]) for skewed continuous data. Wilcoxon rank‐sum test and chi‐squared tests were used to compare population characteristics. Spearman's correlation was used to determine correlations between outcomes measures given the ordinal nature of the questionnaires (CHQ, HADS, SF‐36, EQ‐5D, and headache diary). The strength of Spearman's correlations was interpreted based on the absolute value of ρ (|ρ|): very strong, |ρ| ≥ 0.7; strong, 0.4 ≤ |ρ| < 0.7; moderate, 0.3 ≤ |ρ| < 0.4; weak, 0.2 < |ρ| ≤ 0.3; no or negligible relationship, 0 ≤ |ρ| < 0.2.20
The strength of Spearman's correlations was interpreted based on the absolute value of ρ (|ρ|): very strong (≥0.7), strong (0.4–0.69), moderate (0.3–0.39), weak (0.2–0.29), and negligible (<0.2).
The assumptions of linear regression—linearity, normality of residuals, and homoscedasticity—were evaluated using diagnostic plots from R (e.g., Q–Q plots and residualsversusfitted plots) generated for the model.
No missing data are expected for CHQ outcomes, as completion of the CHQ was part of the inclusion criteria. For the other patient‐reported outcome measures, missing data were handled using a complete‐case approach: patients with missing data for a specific instrument were excluded from the corresponding analyses.
Two‐tailed p values less than 0.05 were considered statistically significant. All analyses were performed using R (R Foundation for Statistical Computing, Vienna, Austria), version 4.3.1 in the RStudio Build 2023.6.1.524 environment (Posit PBC, Boston, MA, USA), using package pROC version 1.18.5.
RESULTS
Participants
A total of 141 eligible participants were identified in the prospective cluster headache cohorts. Of these, 117 were included in the baseline analysis to assess convergent validity (n = 70 for SF‐36/HADS analyses, n = 42 for EQ‐5D analyses); and 82 met the inclusion criteria for the change analysis determining responsiveness and interpretability (n = 48 for SF‐36/HADS analyses, n = 29 for EQ‐5D analyses, Figure 1). Participants were excluded due to insufficient survey completion at baseline (n = 24) or lack of 2 CHQs completed within a 3‐month interval for the change analysis (n = 35). Overall, missing data were limited. For the CHQ baseline analyses, e‐diary data were missing in 1 of 117 participants, and 5 of 75 participants had incomplete SF‐36 and/or HADS data, while EQ‐5D data were complete (0/42 missing). For the CHQ change analyses, no missing data were observed for e‐diary or EQ‐5D outcomes; however, 5 of 53 ONSFU participants had missing SF‐36/HADS data, corresponding to the same individuals with missing baseline data.
Study flowchart. In total 141 eligible participants were identified from two prospective CH cohorts (REGON and ONSFU cohort). Of those, 117 were included in the baseline analysis, and 82 met inclusion criteria for the change analysis. Participants were excluded due to insufficient survey completion at baseline (N = 24) or lack of 2 CHQs completed with an 3‐month interval for the change analysis (N = 35). For the CHQ baseline analyses, e‐diary data were missing in 1 of 117 participants, and 5 of 75 participants had incomplete SF‐36 and/or HADS data, while EQ‐5D data were complete (0/42 missing). For the CHQ change analyses, no missing data were observed for e‐diary or EQ‐5D outcomes; however, 5 of 53 ONSFU participants had missing SF‐36/HADS data, corresponding to the same individuals with missing baseline data. [Color figure can be viewed at wileyonlinelibrary.com]
Participants were on average 47.0 (IQR: 34.0 to 57.0) years old and the male‐to‐female ratio was 3:2 (Table 3). No differences between the included and excluded participants were observed (age, 47.0 vs. 49.0 years; sex, 59% vs. 50% males; all p > 0.050). Participants from the ONSFU cohort were comparable to those of the REGON cohort (i.e., age, 47.0 vs. 49.0 years; sex, 56 vs. 64% males; all p > 0.050).
Step 1. Convergent validity
Baseline QoL scores
All average baseline scores for the CHQ, SF‐36, EQ‐5D, and headache diaries are presented in Table 4. The mean total CHQ score was 60.9 ± 23.1 (SD) and CHQ score distribution did not show floor or ceiling effects (Figure 2). The median weekly attack frequency was 12.0 (IQR: 4.4 to 25.1). The mean EQ‐5D index was 0.61 ± 0.23 (SD), with Anxiety (2.1 ± 1.0 (SD)), Usual activities (2.3 ± 1.1), and Pain (3.1 ± 1.1) being the most affected domains. The mean SF‐36 total score was 46.7 ± 19.9 (SD), with Vitality (36.0 ± 21.6 (SD), Role physical (25.7 ± 39.3), Social functioning (20.8 ± 14.6), and Pain (16.1 ± 14.5) being the most affected subdomains. The mean HADS total score was 16.5 ± 9.5 (SD) with similarly high scores for the Anxiety and Depression subdomains (8.1 ± 4.9 and 8.5 ± 5.4, respectively).
Distribution of total CHQ baseline and change scores. Histograms depicting the distribution of (A) baseline scores and (B) change scores (Δ baseline—follow‐up) of the total CHQ. The orange dotted line and background depict the mean and SD range. [Color figure can be viewed at wileyonlinelibrary.com]
Influence of patient characteristics on the CHQ
The linear regression showed that participants with higher attack intensity and frequency had poorer QoL, reflected by higher CHQ scores (β = 2.92 (95% CI 0.91 to 4.93), p = 0.005; β = 0.27 (95% CI 0.02 to 0.53), p = 0.033; Table 5). Sex was not significantly associated with baseline CHQ scores (β = 2.47 (95% CI −5.50 to 10.45), p = 0.540).
Hypotheses‐driven correlation analysis
Figure 3 shows the heatmap correlation matrix for the baseline analysis. The convergent validity of the CHQ was high: 9/12 hypotheses were confirmed (≤25% rejected; Table 1). Strong correlations were observed between the total CHQ scores and those of the HADS, SF‐36, and EQ‐5D (respectively, ρ = 0.68, ρ = −0.60 and ρ = −0.52). A weak correlation was observed between attack frequency and total CHQ score (ρ = 0.27). The SF‐36 Pain subscale, the most severely impacted SF‐36 subscale at baseline, correlated strongly with all CHQ subscales (ρ = −0.42 to −0.57). The EQ‐5D subscales self‐care and mobility correlated weakly to negligibly with the total CHQ score (ρ ≤ 0.29). A sensitivity analysis where baseline analysis was stratified per treatment cohort (REGON and ONSFU cohort separately) did not find any major differences caused by population heterogeneity (Table 1, Supporting Information S4).
Heatmap depicting correlation coefficients of baseline CHQ scores with other patient reported outcomes. Heatmap depicting the spearman correlation coefficients of the baseline scores of the CHQ scales and other quality of life measurements (SF‐36, HADS, and EQ‐5D) or diary measurements. A darker color (either orange or blue) is associated with a stronger correlation. Spearman correlation interpretation: Very Strong, ρ ≥ 0.7; Strong, 0.4 ≤ ρ < 0.7; Moderate, 0.3 ≤ ρ < 0.4; Weak, 0.2 < ρ ≤ 0.3; No or negligible relationship, 0 ≤ ρ < 0.2. The CHQ and e‐diary were completed by all participants, the SF‐36/HADS only by the ONSFU cohort, and the EQ‐5D only by REGON participants (N = 117 participants in total, n = 70 for SF‐36/HADS analyses, n = 42 for EQ‐5D analyses). A sensitivity analysis of this analysis stratified per cohort (ONSFU and REGON cohort) can be found in Supporting Information S4. [Color figure can be viewed at wileyonlinelibrary.com]
Step 2. Responsiveness validity
Change scores for the CHQ, SF‐36, EQ‐5D, and headache diaries after a 3‐month follow‐up are presented in Table 4. The mean change in total CHQ score was Δ −3.0 ± 18.3 (Figure 2). For non‐directional changes this was Δ8 points (IQR: 3 to 16, = irrespective of ± Δ) for the CHQ (Table 4). The attack frequency changed by a median of Δ3.6 (IQR 0.7 to 9.0; non‐directional change) attacks/week. On average, the SF‐36 total score changed Δ7.9 (IQR: 2.6 to 15.2), the EQ‐5D index Δ0.18 (IQR: 0.04 to 0.30) and the HADS total Δ4.0 (IQR: 2.0 to 7.0, Table 4).
Figure 4 shows the heatmap correlation matrix for the change analysis. The responsiveness of the CHQ was high, with all 12 predefined hypotheses confirmed (≤25% rejected; Table 2). Strong correlations were observed between the total change scores of the CHQ and total change scores of the HADS and the SF‐36 (respectively, ρ = 0.51, ρ = −0.56). Moderate correlations were observed between change scores of the EQ‐5D and CHQ (ρ = −0.38) and between changes in attack frequency and CHQ (ρ = 0.36). In general, change scores showed weaker correlations than baseline scores, except for attack frequency (ρ = 0.36 vs. ρ = 0.27). A sensitivity analysis where change analysis was stratified per treatment cohort (REGON and ONSFU cohort separately) did not find any major differences caused by population heterogeneity (Table 2, Supporting Information S5).
Heatmap depicting correlation coefficients of CHQ change scores with other patient reported outcomes. Heatmap depicting the Spearman correlation coefficients of the change scores of the CHQ and other QoL measurements (SF‐36, HADS, and EQ‐5D) or diary measurements. A darker color (either orange or blue) is associated with a stronger correlation. Spearman correlation interpretation: Very Strong, ρ ≥ 0.7; Strong, 0.4 ≤ ρ < 0.7; Moderate, 0.3 ≤ ρ < 0.4; Weak, 0.2 < ρ ≤ 0.3; No or negligible relationship, 0 ≤ ρ < 0.2. The CHQ and e‐diary were completed by all participants, the SF‐36/HADS only by the ONSFU cohort, and the EQ‐5D only by REGON participants (N = 82 participants in total, n = 48 for SF‐36/HADS analyses, n = 29 for EQ‐5D analyses). A sensitivity analysis of this analysis stratified per cohort (ONSFU and REGON cohort) can be found in Supporting Information S5. [Color figure can be viewed at wileyonlinelibrary.com]
No differences were observed in secondary analyses when exploring these correlations in a poor QoL subpopulation or when using relative change scores (Supporting Information S6 and S7).
Step 3. Interpretability
An MIC in the general QoL was observed in 75% (n = 58/77) of the population, consisting of n = 34 (71%) with an important change on the SF‐36 and n = 24 (83%) with an important change in the EQ‐5D index. Attack frequency changed with ≥30% in half of the participants (n = 41/82).
Three months after initial CHQ completion, QoL had improved in 47% (n = 36/77, improved QoL group), remained stable in 25% (n = 19/77), and deteriorated in 29% (n = 22/77, deteriorated QoL group). The total CHQ score decreased in the improved QoL group with Δ−10.9 ± 21.5, whereas in the deteriorated QoL group it increased with Δ +6.7 ± 11.4 points (Table 4). The attack frequency in the improved QoL group decreased with Δ −3.1 ± 7.7 attacks/week, whereas in the group with deteriorated QoL it increased with Δ +2.7 ± 12.8 attacks/week (Table 4).
The visual anchor‐based MIC distribution method was applied resulting in a ROC curve. For QoL deterioration, the MIC of the CHQ score is a minimum increase of 7.5 points. For QoL improvement, the MIC of the CHQ score is a minimum decrease of 3.5 points (Figure 5; Supporting Information S8).
Visualization of the visual anchor‐based distribution method for MIC calculation. Visualization of the visual anchor‐based distribution method which is applied for MIC calculation. It depicts the distribution of change scores on the CHQ questionnaire of participants with an important improvement (n = 36, orange) or deterioration (n = 21, turquoise) compared with participants with no important change (=stable, n = 19, dark blue) on the anchors (SF‐36/EQ‐5D). The dotted lines indicate the ROC cutoff scores that are defined as MIC for an important deterioration (turquoise) or improvement (orange). MIC is defined as the optimal ROC threshold that minimizes misclassification, see Supporting Information S6 for the ROC curves. [Color figure can be viewed at wileyonlinelibrary.com]
DISCUSSION
This prospective observational study demonstrated high convergent validity and responsiveness of the CHQ, establishing it as a reliable tool for measuring changes in QoL in individuals with cluster headache. Overall QoL in chronic cluster headache was poor, with predominant impairments attributed to pain, anxiety, depression, restrictions in daily socio‐occupational activities, and reduced vitality. Although CH symptom severity (attack frequency, duration, and intensity) correlated to QoL, other factors (e.g., mental health and activity restrictions) demonstrated stronger correlations. Finally, we provide guidance for CHQ interpretation: a decrease of 3.5 points or more in the CHQ total score is considered a minimally important improvement, whereas an increase of 7.5 points or more is considered a minimally important deterioration.
Our results confirm previous findings of a high convergent validity of the CHQ in relation to other validated QoL scales (EQ‐5D, SF‐36), and extend them by demonstrating its correlation with HADS scores and attack characteristics.5 Furthermore, strong correlations between the QoL summary scores (SF‐36, EQ‐5D, HADS, and CHQ) were observed.5 The high responsiveness of the CHQ further establishes it as a reliable tool to detect changes in QoL across multiple time‐points. Few prospective studies in CH, mostly intervention‐based, have reported QoL changes. These often showed poor correlation between clinical improvement and QoL scores.3 This is possibly due to a combination of weak associations between symptom severity and QoL, and a potential limited responsiveness of general QoL scales in CH. The current findings show the ability of the CHQ to address these limitations, demonstrating a strong sensitivity to changes that were previously poorly detected.
Remarkably little research has focussed on QoL in CH, despite it being one of the most painful and disabling disorders.21 However, the available data are in line with our findings that QoL in CH is poor compared to the general population.3 We found that QoL impairments are mainly linked to pain, anxiety, depression, restrictions in daily socio‐occupational activities, and reduced vitality, aligning with the themes that were noted to influence QoL in patients with successful treatment with ONS.22 Although attack frequency and intensity significantly affected the CHQ total score, the correlation between attack frequency and the CHQ is weak. This finding resonates with clinical anecdotes in which apparent discrepancies between attack frequency and perceived CH burden are observed for example, a greatly improved QoL with only modest reduction of symptom severity during intervention trials.23 This also aligns with findings of a recent study focusing on the Fear Avoidance Model (FAM) that observed a stronger correlation between CH burden and fear of attacks than with attack frequency.24 They proposed the FAM model as explanation: This model suggests that dysfunctional cognitive responses to actual or anticipated pain could lead to a cascade resulting in increased functional impairment. Future research is necessary to investigate whether acceptance and commitment therapy, a cognitive behavior therapy based on this model, significantly reduces cluster headache burden, as has been proven for migraine.25
The poor correlation between attack frequency and QoL affirms the importance of focusing on QoL in addition to symptom severity during the follow‐up of cluster headache, both in the clinic and during research. If only symptom severity or QoL is measured in clinical trials, this results in an incomplete overview of the experienced cluster headache burden and a “skewed” interpretation of patients' condition. By relying solely on attack frequency as a trial outcome, improvements in QoL can be overlooked. A non‐significant change in attack frequency may lead to a negative trial outcome. As a result, interventions that are valued by patients for reducing their burden may be incorrectly deemed “ineffective” and not implemented. During the clinical follow‐up of patients with cluster headache, particular attention should be paid to impairments caused by severe pain, anxiety, depression, and socio‐occupational impairments in addition to attack frequency. Whereas improving a patient's well‐being typically centers on reducing symptom severity through medication, it would be valuable to explore interventions directly targeting QoL, such as coping strategies. Complementary strategies targeting both disease symptoms and mental health‐related factors could more effectively reduce the overall burden of CH.
With this relatively large, well‐defined, and prospective cohort, we validated the CHQ and additionally provide a unique insight into change of QoL in cluster headache. A more comprehensive understanding of QoL was gained by comparing both QoL measures and attack characteristics and assessing data multiple time‐points. Results are strengthened by our methodology in accordance with the COSMIN guidelines. This ensured appropriate reporting and innovative approaches to report inherently subjective outcome measures with greater objectivity. By applying hypotheses‐driven correlation analyses, a clear conclusion about validity was drawn despite the absence of a gold standard for direct CHQ validation.
The study design also has some limitations, as the prospective change data were collected as part of two ongoing clinical trials in CCH. A first consequence is that the CHQ was not formally validated in ECH. It is plausible that the same QoL domains are affected in the episodic subtype, but in a less pronounced manner due to its “milder” phenotype. Previous studies that included the episodic subtype found similar validity of the CHQ across subtypes. However, since formal validation is lacking, our results should not be directly applied to the general CH population. Another limitation of the study design, is that not all patients were comparable in terms of current received treatment (ONS; ONSFU cohort; GON block or placebo, REGON cohort), different additional comparator PROMs (ONSFU cohort, HADS and SF‐36; REGON cohort, EQ‐5D), or timeline (included at baseline or during follow‐up). We attempted to address this heterogeneity by presenting data for the total population as well as for the two treatment cohorts separately and stratifying our main outcomes per treatment cohort. This stratification did not reveal major differences between groups. Our primary aim was to measure changes in quality of life irrespective of their cause. Nevertheless, it is important to note that intervention type and study context could influence these changes. Although the CHQ was administered at fixed 3‐month intervals in both studies, the timing of these assessments in relation to the intervention varied between patients. For the majority of participants, we were able to select pre and postintervention assessments to capture sufficient “change,” but this was not possible for all. Consequently, a small proportion of patients had assessments outside the preferred timeframe, which may have introduced measurement bias. Furthermore, the timeline of the responsiveness analysis was limited to a single, short‐term follow‐up period of 3 months. While sufficient to capture immediate post‐intervention changes, this timeframe does not allow evaluation of the CHQ's ability to track the more variable, long‐term course of CH, which can fluctuate substantially over months or years.
The overall sample size was adequate for the study objectives, based on recommended minima from the COSMIN guidelines, ensuring sufficient precision in the analyses. However, it is important to notice that the EQ‐5D was completed by a smaller sample size than advised by the COSMIN guidelines (n = 29 instead of n ≥ 30), as it was only completed by the REGON cohort. The EQ‐5D correlated weaker than the SF‐36 with the CHQ. This could be due to less overlap in content, as we hypothesized in our correlation hypothesis, but this could also be consequence of the small sample size.
A broader implementation of the CHQ will generate more experience on its use and observed changes. Since QoL research in CH is an emerging field, current data serve to enable implementation of the CHQ. In particular, the MIC values provide an initial framework for interpreting meaningful change, but should be viewed with caution given certain limitations. These MICs were derived according to guidelines using a combination of anchor‐ and distribution‐based methods, resulting in estimates that are both statistically and clinically meaningful. Nonetheless, some methodological limitations should be acknowledged. In line with COSMIN guidelines, we did not apply a strict minimum anchor–correlation threshold of ρ = 0.5; as a result, the relatively weak correlation between ΔCHQ and ΔEQ5D (ρ = −0.38) may have introduced noise into the responsiveness analyses. Although previous work has shown good test–retest reliability for the CHQ, our study design did not allow assessment of stability, as this requires repeating the CHQ within a short, clinically stable interval (e.g., 3 days), which was not feasible with our data.5, 8 This should be considered when interpreting small changes in CHQ scores, as we cannot yet fully distinguish true clinical change from measurement error or random variability. Lastly, because no patient‐rated global scale or external criterion was available, the clinical relevance of the MIC remains circumstantial. External validation of the CHQ against real‐world outcomes such as work performance, social relationships, or suicide risk—a key concern in this population—would be highly valuable. Our findings should therefore be regarded as a preliminary step in characterizing the CHQ's measurement properties and responsiveness rather than as a definitive clinical validation. Further studies could revisit CHQ change scores and recalibrate the MIC as larger datasets and tools for external validation become available. Ideally, the distribution of change of the CHQ would be demonstrated in a more complete (CH as well as ECH) and bigger (>200) cohort to gain more in‐depth characterization of QoL changes in CH.
CONCLUSION
In conclusion, understanding of QoL in CH remains limited compared to the knowledge about attack frequency and intensity. We demonstrated that poor QoL in CCH is influenced by multiple factors, including mental health and activity restrictions, rather than attack frequency alone. Accordingly, clinical follow‐up of patients with CH should systematically address both attack frequency and QoL, with particular attention to impairments caused by severe pain, anxiety, depression, and restrictions in socio‐occupational activities. Although current treatment paradigms focus on indirectly improving QoL by reducing symptom severity, future research should explore interventions that directly target QoL as well, such as coping strategies. This dual approach, addressing both disease symptoms and mental health‐related factors, could more effectively reduce the overall burden of CH. The CHQ has been proven valid to measure (changes in) QoL and its implementation can lead to better insights in disease burden, enabling more targeted treatment strategies and thus improving overall disease management.
AUTHOR CONTRIBUTIONS
Willemijn C. Naber: Conceptualization; investigation; writing – original draft; writing – review and editing; visualization; validation; methodology; software; project administration; formal analysis; data curation. Paulien J. van Tilborg: Conceptualization; writing – original draft; methodology; validation; writing – review and editing. Roemer B. Brandt: Conceptualization; funding acquisition; writing – original draft; methodology; validation; writing – review and editing. Julia J. Jansen: Data curation; writing – review and editing. Leopoldine A. Wilbrink: Writing – review and editing; data curation. Wim M. Mulleners: Writing – review and editing; data curation. Erkan Kurt: Writing – review and editing; data curation. Willemijn Leen: Writing – review and editing; data curation. Frank J. P. M. Huygen: Writing – review and editing; data curation. Denise Bijlenga: Writing – review and editing; methodology; validation. Rolf Fronczek: Supervision; data curation; conceptualization; investigation; funding acquisition; writing – original draft; methodology; writing – review and editing.
FUNDING INFORMATION
Funding was received from ZonMw for the REGON study. The funders had no role in the study design, collection, analysis, and interpretation of data; in the writing of the report; and in the decision to submit the paper for publication.
CONFLICT OF INTEREST STATEMENT
The authors report no competing interests.
Rolf Fronczek reports consultancy and lecture fees from Novartis, Lundbeck, AbbVie, Lilly and TEVA, and independent support from the Dutch Brain Foundation, Leiden University Fund and Innovation Fund Dutch Healthcare Providers; Willemijn C. Naber, Paulien J. van Tilborg, Denise Bijlenga, Wim M. Mulleners, Julia J. Jansen, Willemijn Leen, Leopoldine A Wilbrink , and Roemer B. Brandt report no relevant conflict of interest.
Supporting information
Data S1: Supporting Information.
The reference list from the paper itself. Each links out to its DOI / PubMed record.
- 1Headache Classification Committee of the International Headache Society (IHS) The International Classification of Headache Disorders, 3rd edition. Cephalalgia. 2018;38(1):1‐211.10.1177/033310241773820229368949 · doi ↗ · pubmed ↗
- 2Fischera M , Marziniak M , Gralow I , Evers S . The incidence and prevalence of cluster headache: a meta‐analysis of population‐based studies. Cephalalgia. 2008;28(6):614‐618.18422717 10.1111/j.1468-2982.2008.01592.x · doi ↗ · pubmed ↗
- 3D'Amico D , Raggi A , Grazzi L , Lambru G . Disability, quality of life, and socioeconomic burden of cluster headache: a critical review of current evidence and future perspectives. Headache. 2020;60(4):809‐818.32108941 10.1111/head.13784 · doi ↗ · pubmed ↗
- 4Schoenen J , Snoer AH , Brandt RB , et al. Guidelines of the International Headache Society for controlled clinical trials in Cluster Headache. Cephalalgia. 2022;42(14):1450‐1466.36268950 10.1177/03331024221120266 · doi ↗ · pubmed ↗
- 5Abu Bakar N , Torkamani M , Tanprawate S , Lambru G , Matharu M , Jahanshahi M . The development and validation of the Cluster Headache Quality of Life scale (CHQ). J Headache Pain. 2016;17(1):79.27596922 10.1186/s 10194-016-0674-1PMC 5011462 · doi ↗ · pubmed ↗
- 6de Vet HCWTC , Mokkink LB , Knol DL . Measurement in Medicine—a Practical Guide. Cambridge University Press; 2011.
- 7Mokkink L , Terwee C , de Vet H . Key concepts in clinical epidemiology: responsiveness, the longitudinal aspect of validity. J Clin Epidemiol. 2021;140:159‐162.34116141 10.1016/j.jclinepi.2021.06.002 · doi ↗ · pubmed ↗
- 8Naber WC , Brandt RB , Figetakis DD , Jahanshahi M , Terwindt GM , Fronczek R . Translating the Cluster Headache quality of life questionnaire (CHQ) from English to Dutch with the TRAPD method. Neurol Sci. 2024;45(3):1217‐1224.37801235 10.1007/s 10072-023-07088-x PMC 10858103 · doi ↗ · pubmed ↗