MicroRNA-29a-5p contributes to neuroinflammation through TLR7
Hugo McGurran, Eugenio Graceffo, Victor Kumbol, Marina Jendrach, Lukas Hinkelmann, Mariam Brehm, Leandre Ravatt, Christina Krüger, Thomas Wallach, Alexander Haake, Susanne Wegmann, Frank L. Heppner, Markus Schülke, Seija Lehnardt

TL;DR
This study shows that miR-29a-5p, a microRNA linked to Alzheimer's disease, activates TLR7 in microglia, leading to neuroinflammation and neuronal injury.
Contribution
The study identifies miR-29a-5p as a TLR7 agonist that directly contributes to neuroinflammation and alters microglial signaling in Alzheimer's disease.
Findings
Extracellular miR-29a-5p activates TLR7 in microglia, inducing cytokine release and neuronal injury.
miR-29a-5p injection in mice leads to microglial accumulation and neuronal damage via TLR7.
RNAseq analysis shows downregulation of MAPK pathways in miR-29a-5p-treated mouse brains.
Abstract
MicroRNAs (miRNAs) canonically regulate post-transcriptional gene expression, but they can also serve as ligands for Toll-like receptors (TLRs). These receptors and their associated signalling pathways contribute to inflammatory responses involved in various central nervous system (CNS) diseases, including Alzheimer’s disease (AD). Here, we investigated the effects of extracellularly delivered miRNA in the context of neuroinflammation. We identified several miRNAs specifically dysregulated in AD and/or neuroinflammatory states, which directly activate the single-stranded RNA sensors mouse TLR7 and human TLR7/8. Among them, extracellular miR-29a-5p induced cytokine and chemokine release from murine primary microglia, altered expression of TLR signalling elements, and enhanced Aβ phagocytosis. Furthermore, this miRNA induced neuronal injury dependent on microglial TLR7 expression, but…
Genes, proteins, chemicals, diseases, species, mutations and cell lines named across the full text — each resolved to its canonical identifier and authoritative record.
Click any figure to enlarge with its caption.
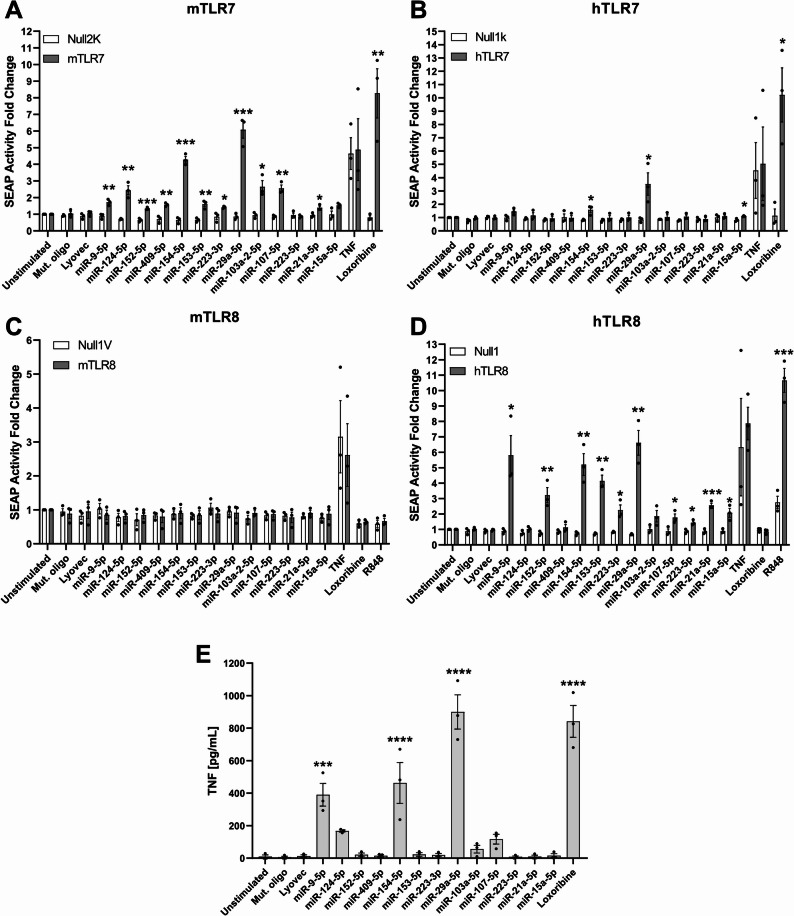 Figure 1
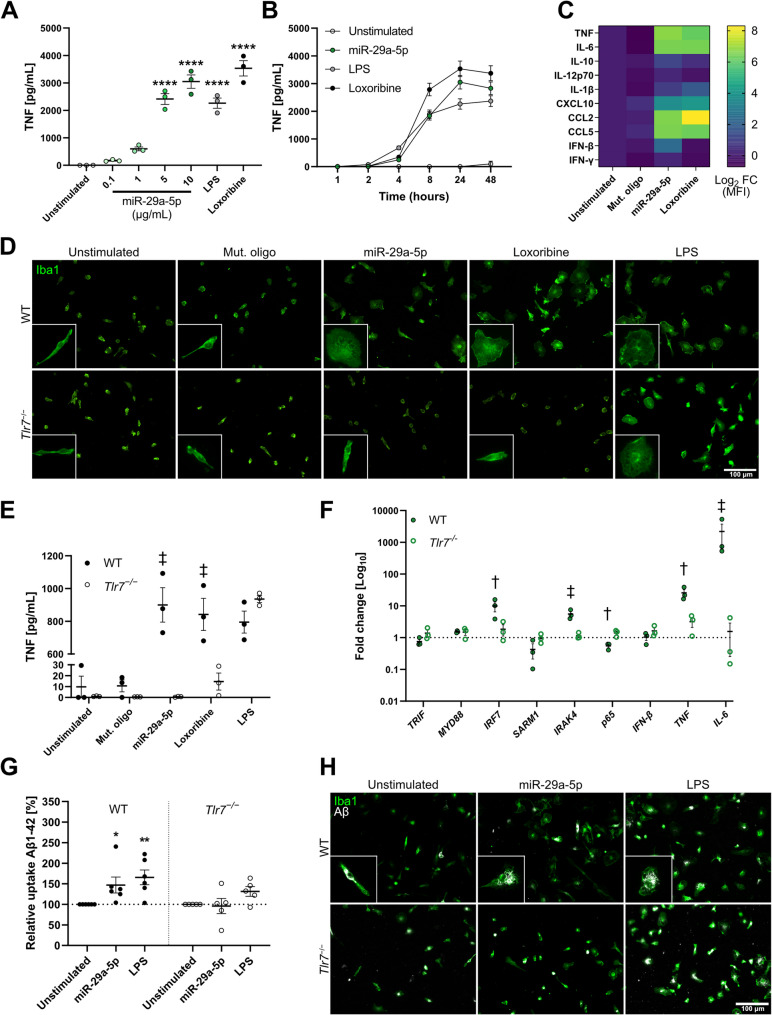 Figure 2
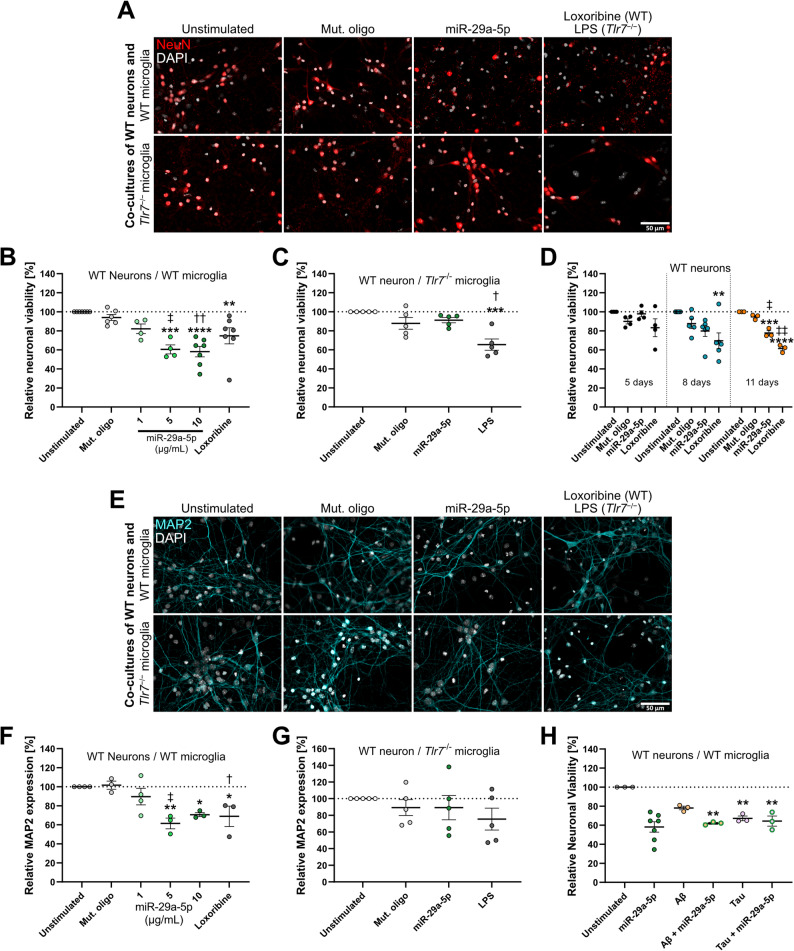 Figure 3
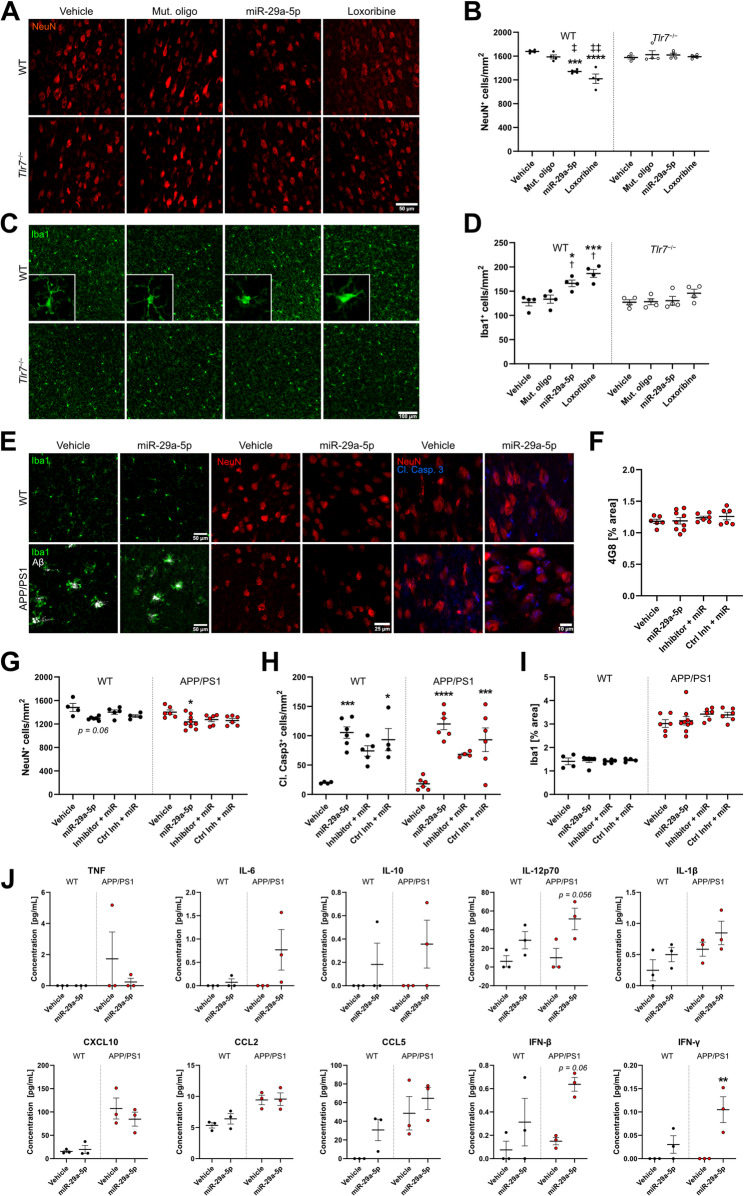 Figure 4
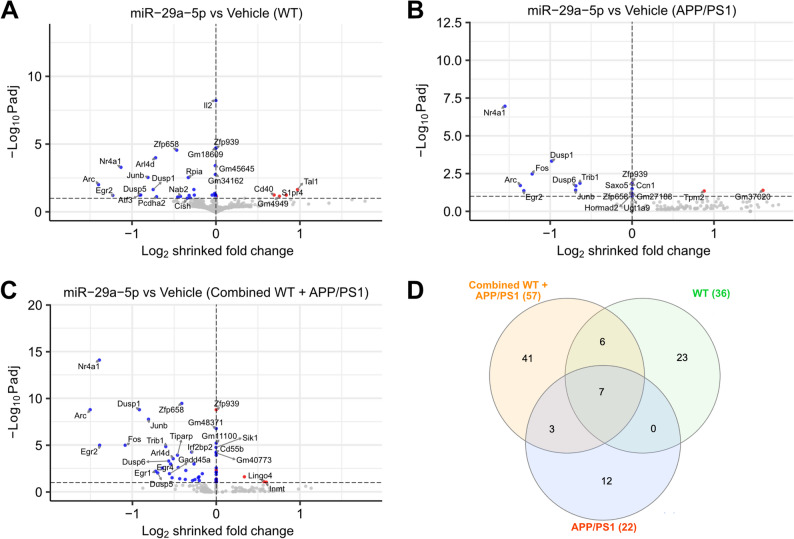 Figure 5
- —Charité - Universitätsmedizin Berlin (3093)
Peer Reviews
No public reviews on file for this paper yet. If you reviewed it on a platform where reviews are public (OpenReview, ICLR, NeurIPS, ICML), you can paste yours below so the community can read it here.
Videos
No videos yet. Explain this paper in a talk, walkthrough, or lecture? Add one.
Taxonomy
TopicsMicroRNA in disease regulation · Neuroinflammation and Neurodegeneration Mechanisms · Immune Response and Inflammation
Introduction
MicroRNAs (miRNAs) are fundamental regulators of gene expression that control diverse cellular pathways through mRNA degradation and translational repression. MiRNA dysregulation is associated with a wide range of diseases including cancer [1], cardiovascular [2], autoimmune [3], and neurological disease [4]. Consequently, miRNA dysregulation is intensely discussed with respect to identifying potential therapeutic or diagnostic targets for such diseases, including Alzheimer’s disease (AD) [5]. MiRNAs such as miR-120-5p, miR-320a, miR-204-5p, miR-146a/b-5p, and miR-29, among many others, are specifically dysregulated in AD patients [6–9]. This coincides with the recent discovery that, beyond regulating post-transcriptional gene expression, miRNAs act as ligands for innate immune receptors such as the single-stranded (ss) RNA-sensing Toll-like receptors (TLRs) 7 and 8 [10–13], though this miRNA function remains poorly understood.
TLRs form an essential part of the innate immune system, providing a first line of defence against pathogens. These receptors are predominantly expressed by immune cells including microglia but also certain non-immune cells, such as neurons and endothelial cells [14, 15]. TLR7 detects fragments of viral ssRNA and drives an inflammatory response upon activation. In contrast to other TLRs such as TLR2 and TLR4, which have long been associated with AD and investigated in various AD mouse models [16–18], TLR7 has been less in the spotlight. However, TLR7 expression is increased in AD patients and cerebrospinal fluid (CSF) from AD patients contains increased amounts of let-7b, a miRNA ligand of TLR7, suggesting a role for this receptor in AD pathology [12]. Furthermore, TLR7 signalling has been found to affect molecular and cellular processes involved in autophagy [19], cognitive dysfunction [20], apoptosis [21], and neuroinflammation [22].
In principle, inflammation is a highly dynamic process that in the central nervous system (CNS) is primarily driven by microglia and has been established as one of the earliest pathological changes and hallmark in AD [23]. Therefore, modulating neuroinflammation through TLR-associated pathways has been discussed as potential therapeutic options in AD, with multiple clinical trials now assessing its potential [24, 25]. However, inflammation has conflicting roles in AD. For instance, microglial activity, especially in early disease stages, can be beneficial by assisting with the removal of toxic amyloid beta (Aβ) protein, but over time, this inflammatory response can become deleterious, with excess cytokine release causing neurotoxicity and even propagating Aβ pathology [23, 26].
Here, we demonstrate that multiple AD- and/or neuroinflammation-associated miRNAs can act as endogenous ligands for TLR7/8. Among these miRNAs, extracellularly delivered miR-29a-5p potently activated microglia, induced cytokine/chemokine release, and improved phagocytosis of Aβ in vitro*.* Furthermore, miR-29a-5p reduced neuronal viability in the presence of microglia. Intrathecal injection of miR-29a-5p into APP/PS1 mice, a mouse model for AD, led to alterations in cytokine/chemokine expression, downregulation of the MAPK pathway, and resulted in neuronal injury. The observed effects, both in vitro and in vivo, required functional TLR7.
Methods
Literature search and Braindead analysis
A literature search on Pubmed was performed for peer-reviewed articles using the keywords “microrna microglia neuroinflammation” and “microrna microglia alzheimer”. All associated miRNAs were analysed using the machine-learning software Braindead (http://rna.informatik.uni-freiburg.de/ [27]) to determine the potential binding capacity of these miRNAs to TLR7/8. A cut-off value of ≥ 85% was placed to ensure high likelihood of binding. As we sought to identify novel TLR7-activating miRNAs associated with inflammation and AD, known TLR7-activating miRNAs were removed resulting in a final panel of 12 miRNAs (Table 1).
Table 1. MiRNA sequences and respective braindead scores. All MiRNAs have 5′ phosphorylation and phosphorothioate bonds in every basemiRNABraindead scoreSequencemiRbase IDhsa-miR-153-5p0.961GUCAUUUUUGUGACGUUGCAGCUMIMAT0026480hsa-miR-9-5p0.95UCUUUGGUUAUCUAGCUGUAUGAMIMAT0000441hsa-miR-152-5p0.938UAGGUUCUGUGAUACACUCCGACUMIMAT0026479hsa-miR-124-5p0.921CGUGUUCACAGCGGACCUUGAUMIMAT0004591hsa-miR-409-5p0.904AGGUUACCCGAGCAACUUUGCAUMIMAT0001638hsa-miR-223-5p0.893CGUGUAUUUGACAAGCUGAGUUGMIMAT0004570hsa-miR-154-5p0.89UAGGUUAUCCGUGUUGCCUUCGMIMAT0000452hsa-miR-223-3p0.877UGUCAGUUUGUCAAAUACCCCAMIMAT0000280hsa-miR-29a-5p0.876ACUGAUUUCUUUUGGUGUUCAGMIMAT0004503mmu-miR-107-5p0.87AGCUUCUUUACAGUGUUGCCUUGMIMAT0017048hsa-miR-21a-5p0.855UAGCUUAUCAGACUGAUGUUGAMIMAT0000076hsa-miR-15a-5p0.85UAGCAGCACAUAAUGGUUUGUGMIMAT0000068hsa-miR-103a-2-5p0.538AGCUUCUUUACAGUGCUGCCUUGMIMAT0009196Mut. oligo-UGAGGUAGAAGGAUAUAAGGAU-
Mice
C57BL/6 (WT), Tlr7^−/−^, and APP/PS1 mice were bred at the FEM, Charité-Universitätsmedizin Berlin, Germany. Tlr7^−/−^ mice were generously provided by S. Akira (Osaka University, Osaka, Japan). Animals were maintained according to the guidelines of the committee for animal care. All animal procedures were approved by the Landesamt für Gesundheit und Soziales (LAGeSo) Berlin, Germany.
MiRNA oligoribonucleotides
MiRNA oligoribonucleotides with 5′ phosphorylation and phosphorothioate bonds in every base were synthesised by Integrated DNA Technologies. The sequence for all miRNAs used can be found in Table 1. The control oligonucleotide (mut. oligo) is a mutated sequence of let-7b with reduced GU content by a six nucleotide exchange in the GU-rich core and has no known homology to any sequence in mouse or human [12]. For all experiments with microglia or HEK TLR reporter cells, miRNAs were complexed and transfected with LyoVec (Invivogen, #lyec-1), which improves uptake and reduces degradation of oligonucleotides [28], unless otherwise indicated. Enriched neuronal cultures were exposed to uncomplexed miRNAs as they do not require transfection for miRNA uptake, as previously described [12, 29]. Details for other chemicals including TLR agonists are provided in Table S1.
Aβ and tau preparation
HFIP-treated amyloid-beta (Aβ)1–42 (Bachem, 4090148) was reconstituted to 2.5 mM in dimethyl sulfoxide (DMSO). The reconstituted Aβ was diluted to a working concentration of 100 µM in PBS and left at 4 °C overnight prior to experimentation to promote oligomerisation [30–32]. Soluble full length human tau in buffer (25 mM HEPES, 10 mM NaCl, pH 7.4, 1 mM DTT) was produced in E. coli BL21 Star™ (Invitrogen) cells as previously described [33, 34] and diluted in PBS to indicated concentration. Both proteins were added directly to cell culture without complexation. Biochemical composition of Aβ and tau were not analysed prior to application in vitro, and protein aggregation, at least in part, cannot be ruled out.
HEK-blue TLR reporter cells
HEK-Blue™ Secreted Embryonic Alkaline Phosphatase (SEAP) cells (Invivogen, Table S1) expressing either human or mouse TLR7 or TLR8, along with their parental control lines (Null1-k, Null2-k, Null1, and Null1V) were cultured in Dulbecco’s Modified Eagle Medium (DMEM, Gibco, #41965062) supplemented with 10% heat-inactivated fetal calf serum (FCS, Gibco #10082–147), penicillin/streptomycin (100 U/mL; 100 µg/mL, Gibco #15140–122). For SEAP detection, 30,000 cells were seeded onto 96-well plates, and the following day, media was changed to 90% HEK-Blue detection reagent (Invivogen, #hb-det2) and 10% DMEM. Cells were incubated for 24 h with indicated miRNAs (10 µg/mL). LyoVec and mut. oligo served as negative controls. TNF (NF-κB/AP-1 promoter activation), loxoribine (TLR7), and R848 (TLR7/8) served as positive controls (Table S1). Conditions were performed in triplicate and absorbance measured at 655 nM using a SpectraMax iD3 (Molecular Devices). SEAP detection experiments were only performed on cells with < 20 passages to ensure cell line stability. Additionally, cells were further treated with Blasticidin, Zeocin, and Normocin according to manufacturer’s instructions to prevent bacterial, fungal, and mycoplasma growth.
Primary cell culture
Neurons
Primary neuronal cultures were generated from forebrains of embryonic day E17 C57BL/6 mice, as previously described [11]. In brief, meninges, superficial blood vessels, and cerebellum were removed from the cortices. Cortices were then manually homogenised and incubated with 2.5% trypsin (Gibco #15090046) for 20 min at 37 °C and quenched with FCS. The tissue was then treated with 100 µL DNase (Roche #1284932001) and washed thoroughly. The cell suspension was then centrifuged at 17 RCF, and the resulting supernatant was centrifuged at 264 RCF. The pellet was resuspended in neurobasal media (Gibco #21103049), and 5 × 10^5^ cells were added to PDL-coated glass coverslips in a 24-well plate. A half media change was performed the following day. Cells were then incubated at 37 °C in humidified air with 5% (v/v) CO_2_ for 3 d before experimentation.
Microglia
Primary microglia were generated from the cortex of P1-4 C57BL/6 or Tlr7^−/−^mice as previously described [11]. Briefly, the brain was removed. Cortices were manually homogenised and incubated with 2.5% trypsin for 25 min at 37 °C. Tissue was treated with 100 µL DNase and centrifuged at 264 RCF for 5 min. The pellet was resuspended in DMEM, passed through a 70 μm strainer, and added into T75 culture flasks. A full media change was performed the following day. Cells were then incubated for 10–14 d at 37 °C in humidified air with 5% (v/v) CO_2_. Microglia were removed by shaking on an orbital shaker at 200 rpm for 20 min.
Co-cultures of neurons and microglia
To generate co-cultures, neurons and microglia were prepared as described above. Once neurons had been in culture for 3 d, half of the neuronal media was removed and replaced with DMEM containing 60,000 microglia for an approximate ratio of 1:8 microglia to neurons. Experiments were conducted the following day. For conditioned media experiments, 60,000 microglia in 500 µL DMEM were stimulated with indicated condition for 24 h. Once neurons had been in culture for 3 d, half the neuronal media was removed and replaced with 250 µL of the conditioned DMEM for 5 d.
Tumour necrosis factor Enzyme-Linked immunosorbent assay (ELISA)
Thirty thousand primary mouse microglia were incubated with free or LyoVec-complexed miRNAs at indicated concentration, loxoribine (1 mM) or LPS (100 ng/mL) for the indicated duration. Supernatants of treated cells were analysed with a commercial TNF ELISA kit according to manufacturer’s instructions (Invitrogen, #88732488).
Multiplex immune and Aβ protein assays
For analysis of cyto- and chemokine expression, 30,000 primary mouse microglia were incubated with miR-29a-5p (10 µg/mL), mut. oligo (10 µg/mL), loxoribine (1 mM), or LPS (100 ng/mL) for 24 h. Supernatants were removed and stored at -70 °C until use. Tissue samples from WT and APP/PS1 mice were homogenised and lysed in RIPA buffer (Pierce, #89900) using the Precellys Evolution Touch homogeniser (Bertin Technologies). Lysates were centrifuged at 14,000 rpm for 20 min, and the supernatant was removed. A BCA assay (Pierce, #23225) was used to normalise total protein concentration in all samples. Samples were analysed using a custom U-plex multiplex kit according to manufacturer’s instructions (Meso Scale Diagnostics). For analysis of Aβ38, Aβ40, and Aβ42, tissue samples were homogenised followed by a three-step extraction first in TBS, then TX, and then in SDS to extract Aβ with different solubility. The TBS fraction containing soluble Aβ (undiluted) and the SDS fraction containing insoluble/plaque-associated Aβ (diluted at 1:500 with DTBS) were analysed with the V-PLEX Aβ Peptide Panel 1 (6E10) Kit (Meso Scale Discovery, #K15200E-1) using a Tecan Infinite^®^ 200 Pro (Tecan Life Sciences) and normalised on the protein content, which was measured with a BCA assay (BCA Protein Assay Kit (ThermoFisher, #23227). Multiplex assays were analysed using a Meso Sector S 600MM device.
Reverse transcription quantitative polymerase chain reaction (RT-qPCR)
Primary microglia or neurons were stimulated for the indicated time with miR-29a-5p (10 µg/mL), LPS (100 ng/mL), or loxoribine (1 mM). RNA was collected as per manufacturer’s instructions using a commercial kit (Qiagen, #74104). cDNA was synthesised using M-MLV reverse transcriptase (Promega, M1701), and SYBR-green qPCR performed. For quantification of miR-29a-5p expression in primary cells, microglia or neurons were stimulated for 24 h with miR-29a-5p mimic (10 µg/mL) or loxoribine (1 mM). For analysis of WT and APP/PS1 tissue samples, cortex tissue was homogenised using the Precellys Evolution Touch homogeniser (Bertin Technologies) in lysis buffer. RNA was collected as per manufacturer’s instruction using a commercial kit (Qiagen, #217084). cDNA was synthesised, and qPCR performed using a commercial kit (Qiagen, #339320). miR-29a-5p expression was normalised to endogenous control miR-103-3p. SYBR-green qPCR was performed using the StepOnePlus RT-qPCR system (Applied Biosystems). All data are expressed using 2^–∆∆Ct^. Conditions were performed in triplicate and averaged. Primers used are listed in Table S1.
Phagocytosis assay
5-FAM-amyloid-beta (Aβ)1–42 (Bachem, 4090151) was reconstituted to 2.5 mM in DMSO and subsequently diluted to a working concentration of 100 µM in PBS and left at 4 °C overnight prior to experimentation. To measure phagocytosis, 30,000 microglia were plated in a 96-well plate on coverslips and the following day, microglia were treated with miRNA or control alongside 500 nM of 5-FAM-Aβ1–42 for 24 h. Cells were then thoroughly washed and fixed in 4% PFA for 20 min before immunostaining with Iba1 antibody. Phagocytic capacity of stimulated cells was assessed by calculating the percent area of Aβ1–42 within Iba1-positive cells and normalised to the unstimulated control, as described previously [35].
Immunocytochemistry and immunohistochemistry
Cells grown on cover slips were thoroughly washed and fixed in 4% PFA for 20 min. Cells were stained with indicated primary antibodies (Table S1) in staining buffer (PBS, 2% NGS, 0.2% Triton-X) overnight at 4 °C. Cells were washed and incubated with secondary antibodies (Table S1) for 1 h at room temperature. Coverslips were then sealed with immumount (Epredia, 9990402). For TUNEL apoptosis assays (Roche, 11684795910, 12156792910), experiments were conducted following manufacturer’s instructions. For tissue staining, brains were fixed in 4% PFA and cut coronally at 14 μm thickness and thaw-mounted on glass slides. Prior to staining, tissue was treated with 4% PFA for 15 min, thoroughly washed, then treated with blocking buffer (PBS, 5% NGS, 0.2% Triton-X) for 1–3 h. Sections were stained with indicated primary antibodies in staining buffer overnight at 4 °C. Sections were washed and incubated with secondary antibodies for 1 h at room temperature and sealed with immumount.
Microscopy and imaging
For imaging of cell cultures stained with TUNEL assay or NeuN and MAP2 immunostaining, two coverslips per condition were analysed. Six images of each coverslip at 40× magnification were taken on an Olympus IX81 microscope. Data was normalised to unstimulated control. For imaging and quantification of NeuN and Iba1 immunostaining in the protocol describing intrathecal injection into mice after 3 d (see below), images of both the left and right hemisphere were taken at approximately an interaural distance of 1.9 mm on an Olympus IX81 microscope. Quantification was performed by two independent examiners and data were pooled for analysis. Imaging for neurofilament and MAP2 immunostaining 3 d post-injection was performed by taking 3 images of both the left and right hemisphere at approximately an interaural distance of 1.9 mm of the retrosplenial area, cingulum bundle, and dentate gyrus at 10× magnification. Imaging for GFAP immunostaining was performed using a Nikon widefield ti2 microscope at 10× magnification taking a stitched image of the entire left and right hippocampus at approximately interaural distance 1.9 mm. Imaging for neurofilament, MAP2, and caspase-3 immunostaining in long-term (3 monthly injections) WT and APP/PS1 experiments, 6 images of the cortex were taken at interaural distance of 1.9 mm on an Olympus IX81 microscope. Imaging of Iba1 and Aβ 4G8 immunostaining for APP/PS1 experiments was performed using a Nikon Widefield ti2 at 10× magnification taking a stitched image of the entire hemisphere of which the entire cortex of 5 sections per mouse was analysed at approximately interaural distances 6.6, 5.3, 3.9, 2.1, and 1.9 mm. Examiners were blinded, and all imaging was analysed with FIJI [36].
Analysis of miR-29a-5p uptake by microglia
Primary microglia were prepared as described above, and 1 × 10^5^ microglia were seeded onto PDL-coated coverslips. Cells were incubated with the endosomal marker pHrodo Red Dextran (20 µg/mL) and Alexa-488-labelled miR-29a-5p (10 µg/mL), and incubated at 37 °C for 4 h. Microglia were then washed with PBS, fixed with 4% PFA for 20 min, and stained with DAPI. Subsequently, cells were imaged on a Nikon CSU-X1 Spinning Disk Confocal microscope. Image stacks (0.5 μm step size) were acquired with a 100X objective. The fluorescence intensity along linear ROIs traversing endosomes were analysed in FIJI to confirm colocalization.
Intrathecal injection into mice
Intrathecal injection into mice was performed, as described previously [12, 37]. Briefly, 10 µg of miRNA or loxoribine (136 µg) in 40 µL water, or water alone as vehicle control was injected into the intrathecal space. For intrathecal injection into WT and Tlr7^−/−^ mice, 3 d post injection, mice were perfused with 4% PFA, and the whole brain was placed in a 30% sucrose solution, then cut coronally at 14 μm thickness, and thaw-mounted onto glass slides for analysis. For WT and APP/PS1 mice, the injection was carried out as described above every 30 d for a total of 3 injections. The locked nucleic acid (LNA) inhibitor and control inhibitor (Qiagen, YI04101188; YI00199006) were injected 16 h prior to miRNA injection. Mice were perfused with 4% PFA 30 d after the final injection. The brain was removed, and one hemisphere was cryoprotected in 30% sucrose solution, then cut coronally at 14 μm thickness, and thaw-mounted onto glass slides. The other hemisphere was snap-frozen in liquid nitrogen and kept at -70 °C for RNA and protein analysis.
Library preparation and sequencing
RNA was isolated from snap-frozen left hemispheres of all mice using a commercial kit according to manufacturer’s instructions (Qiagen, #74104). A minimum of 500 ng total RNA from each sample was sent to the Berlin Institute of Health Genomics facility using the Novaseq X plus platform generating 100 million 100 bp reads. Differentially expressed genes and mouse characteristics can be found in Table S2.
Bioinformatic analyses of RNA-seq data sets
Sequence quality was assessed using FastQC v0.11.8 (www.bioinformatics.babraham.ac.uk/projects/fastqc, accessed on 4 Oct 2024) and MultiQC v1.6 [38]. Reads were mapped to the EMBL mus musculus genome assembly GRCm39 (mm39, release 112) using the splice-aware aligner STAR v2.7.10a [39]. BAM files were sorted and indexed using SAMtools v1.9 [40]. StringTie v2.1.7 was used to generate the gene count matrix [41]. PCA, clustering and differential expression analysis were performed in R v4.3.2 with the DESeq2 v1.42.0 package and used to remove outliers that did not cluster to condition or genotype (outlier genotype: APP/PS1, condition: inhibitor + miR-29a-5p, n = 1. For all other groups and conditions, n = 3). For visualising purposes, LFC shrinkage using “apeglm” was performed [42]. Unless otherwise stated, a Padj (FDR) value < 0.1 was considered statistically significant in DE analysis. GO enrichment Analysis of Biological Processes was performed using the enrichGO function of the clusterProfiler v4.10.0 package.
Statistics
All data are expressed as the mean ± SEM. Normality was tested with the Shapiro-Wilk test. Statistical analyses comparing two groups were tested with Student’s t-test or by multiple t-tests with FDR (two-stage step-up method), as indicated. For comparison of multiple groups, a one-way ANOVA followed by Dunnett’s or Sidak’s test to account for multiple comparison was used. For experiments including WT, Tlr7^−/−^, and APP/PS1 mice a two-way ANOVA followed by Tukey’s test was performed. Statistics were calculated in Graphpad Prism 9.0 (Dotmatics).
Results
Identifying AD- and neuroinflammation-associated MiRNAs as endogenous TLR7/8 ligands
SsRNA fragments represent the natural ligands for TLR7 and TLR8. Also, certain miRNAs have been shown to directly activate TLR7 and TLR8 in a sequence-dependent manner [10, 27, 43]. We aimed to identify miRNAs associated with AD and/or neuroinflammation to evaluate their potential as signalling molecules for TLR7/8. To this end, we performed a literature search for relevant miRNAs whose expression is specifically dysregulated in AD and/or in neuroinflammatory states. We then leveraged the machine-learning software Braindead, which predicts the potential for small RNA molecules to serve as ligands for TLR7/8. Although this algorithm was originally trained on data from mouse microglia, it is capable of accurately predicting small RNAs that bind to both mouse and human TLR7/8 [27]. We identified a total of 12 miRNAs that had a high probability (≥ 85%) of being able to bind to TLR7/8 (see Table 1). An additional miRNA, hsa-miR-103a-2-5p as the closest human equivalent of mmu-miR-107-5p was included in the resulting candidate list, as this miRNA met the threshold in the Braindead analysis but did not have an exact human homologue. All other candidate miRNAs have identical human and mouse sequences.
To validate the in silico results described above, we conducted a screen approach using HEK reporter cells overexpressing either human or mouse TLR7 or TLR8. Supporting the Braindead results, 11 out of 13 of the screened miRNAs significantly activated mouse TLR7, with miR-29a-5p comparatively inducing the strongest receptor response, and with only miR-223-5p and miR-15a-5p failing to activate the receptor (Fig. 1A). Three miRNAs, namely miR-29a-5p, miR-154-5p, and miR-15a-5p, were able to activate human TLR7 (Fig. 1B), with miR-29a-5p and miR-154-5p activating both mouse and human TLR7. Mouse TLR8 was not activated by any miRNA candidates in extracellular form (Fig. 1C), an effect likely due to the mouse TLR8 receptor’s lack of or altered function in detecting ssRNA compared to the human receptor [44]. Finally, human TLR8 was activated by 10/13 candidates, including miR-29a-5p, with only miR-124-5p, miR-409-5p, and miR-103a-2-5p not doing so (Fig. 1D). A mutated control oligoribonucleotide (mut. oligo, hereafter), previously shown not to activate TLR7 or TLR8 [12], failed to induce a response from mouse or human TLR7 or TLR8, as expected.
Fig. 1AD- and neuroinflammation-associated miRNAs directly activate ssRNA-sensing TLRs. HEK TLR reporter cells expressing A) mouse TLR7, B) human TLR7, C) mouse TLR8, or D) human TLR8 were exposed to indicated miRNA (10 µg/mL) for 24 h. Unstimulated condition, mut. oligo (10 µg/mL), and the transfection agent LyoVec served as negative controls. Loxoribine (1 mM), R848 (100 ng/mL), and TNF (100 ng/mL) served as positive control for TLR7, TLR8, and reporter cell activation, respectively. Fold change calculated as change in absorbance from NF-κB-inducible SEAP compared to parental control line for each condition. E) C57BL/6 (wild-type, WT) microglia were exposed to indicated miRNA (10 µg/mL) for 24 h. TNF concentrations in the supernatant were assessed by ELISA. Significance determined by multiple t-test for HEK TLR cell analysis or one way ANOVA followed by Dunnett’s multiple comparison test for ELISA. *p < 0.05; **p < 0.01; ***p < 0.001; ****p < 0.0001. Error bars represent mean ± SEM. n = 3
To test the functional relevance of the miRNAs identified as activators of TLR7 and TLR8, C57BL/6 (WT) primary mouse microglia, which express all known TLRs including TLR7 and TLR8 [45], were exposed to these synthetic miRNAs in vitro, and TNF release, as an indicator of cellular activation, was assessed by ELISA. From all tested miRNAs, miR-9-5p, miR-154-5p, and miR-29a-5p induced significant TNF release from microglia. MiR-29a-5p in particular induced a TNF response to a similar extent as loxoribine, an established synthetic TLR7 agonist [46] (Fig. 1E).
Taken together, we identified several AD- and neuroinflammation-associated miRNAs as ligands for mouse and human TLR7 and/or human TLR8. Given its potent activation of both mouse and human TLR7, human TLR8, and primary microglia, we subsequently focussed on miR-29a-5p as a potential signalling molecule in the context of neuroinflammation in the following experiments.
Extracellular miR-29a-5p induces microglial release of inflammatory molecules and alters Aβ phagocytosis through TLR7 in vitro
To further investigate the effect of extracellular miR-29a-5p on microglia, we performed a dose-response analysis in primary wild-type (WT) microglial cultures exposed to miR-29a-5p. We detected significant TNF release after 24 h beginning at 5 µg/mL of miR-29a-5p, with the highest concentration tested (10 µg/mL) inducing a similar response to that of loxoribine and LPS (Fig. 2A). This miR-29a-5p dose induced substantial TNF release after 4 h, with a peak after 24 h. Likewise, LPS and loxoribine induced a peak of TNF release after 24 h (Fig. 2B). MiRNA transfection using LyoVec increased TNF release from microglia by ~ 3-fold compared to usage of uncomplexed miR-29a-5p (Fig. S1A), aligning with a previous study [47]. The inflammatory response of WT microglia exposed to miR-29a-5p after 24 h was further analysed by a multiplex immune assay (Fig. 2C, Table S2). Compared to the unstimulated condition, extracellularly delivered miR-29a-5p induced substantial release of cytokines, including TNF and IL-6, to a similar extent as loxoribine. Both IL-10 and IL-12p70 concentrations were increased after exposure to miR-29a-5p, but not loxoribine, indicating a microglial response specifically induced by miR-29a-5p. MiR-29a-5p exposure also led to the release of chemokines such as CCL2, CCL5, and CXCL10, to a similar extent as loxoribine. None of the tested conditions induced IFN-β or IFN-γ production in microglia. As expected, mut. oligo caused no substantial release of inflammatory molecules from microglia (Fig. 2C). Exposure of microglia to miR-29a-5p led to morphological changes, with miRNA-treated microglia displaying a distinct amoeboid morphology comparable to what is observed in microglia treated with loxoribine or LPS (Fig. 2D). Microglial uptake of extracellularly applied miR-29a-5p by microglia was confirmed when Alexa-488-tagged miR-29a-5p mimic co-localised with the endosomal marker pHrodo Red after 4 h of miRNA exposure (Fig. S1B).
Fig. 2. Extracellular miR-29a-5p induces microglial cytokine and chemokine release, as well as Aβ phagocytosis dependent on TLR7. A) WT microglia were exposed to indicated miR-29a-5p doses for 24 h, and TNF concentration in the supernatant was measured by ELISA. Loxoribine (1 mM) and LPS (100 ng/mL) served as positive controls. B) WT microglia were exposed to 10 μg/mL miR-29a-5p for indicated durations, and TNF concentration in the supernatant was measured by ELISA. Loxoribine (1 mM) and LPS (100 ng/mL) served as positive controls. C) Multiplex immunoassay of WT microglia exposed to miR-29a-5p (10 μg/mL) for 24 h. Mut. oligo (10 μg/mL) and loxoribine (1 mM) served as controls for sequence specificity and TLR7 activation, respectively. D) Representative images of morphological changes in WT and Tlr7^−/−^microglia after 24 h of indicated treatments. E) WT and vv Tlr7^−/−^ microglia were exposed to mut. oligo, miR-29a-5p (10 μg/mL), or LPS (100 ng/mL) for 24 h, and TNF concentration in the supernatant was measured by ELISA. F) WT and Tlr7^−/−^microglia were exposed to miR-29a-5p (10 μg/mL) for 24 h. RNA was extracted from cells for analysis of the TLR signalling pathway by RT-qPCR (see Table S1 for primers). G) WT (n = 6) and Tlr7^−/−^(n = 5) microglia stimulated with miR-29a-5p (10 μg/mL) or LPS (100 ng/mL) were simultaneously given 5-FAM-tagged Aβ1-42 (500 nM) and assessed for Aβ1-42 uptake after 24 h. H) Representative images of WT and Tlr7^−/−^microglia phagocytosing Aβ1-42. Scale bars represent 100 μm. Significance was determined using either a one-way ANOVA followed by Dunnett’s test A, G), by unpaired t-tests when comparing WT and Tlr7^−/−^directly E, G), or multiple unpaired t-tests by two-stage step-up method F). p < 0.05; **p < 0.01 to unstimulated condition, †p < 0.05; ‡p < 0.01 to Tlr7^−/−*^of same condition. Error bars represent mean ± SEM. n = 3 (A-F), n = 5-8 (G)
To determine whether the observed miRNA-induced inflammatory response from microglia requires TLR7, Tlr7^−/−^ microglia were exposed to miR-29a-5p for 24 h. Cells were also incubated with loxoribine as a negative control or LPS as a positive control for microglial activation via TLR4 (Fig. 2E). In contrast to WT cells, Tlr7^−/−^ microglia did not release TNF after miR-29a-5p exposure, indicating TLR7 as the responsible receptor mediating miR-29a-5p-induced TNF release from WT microglia. Furthermore, Tlr7^−/−^ microglia maintained a ramified state compared to WT microglia exposed to miR-29a-5p (Fig. 2D).
To assess the expression of canonical TLR pathway elements in WT and Tlr7^−/−^ microglia exposed to miR-29a-5p, we performed RT-qPCR analysis (Fig. 2F). LPS served as a positive control for induction of the TLR signalling pathway (Fig. S2A). Extracellular miR-29a-5p increased transcription of the regulatory TLR signalling components IRF7 and IRAK4, p65, as well as TNF and IL-6 mRNA in WT, but not Tlr7^−/−^ microglia. Unlike LPS, miR-29a-5p did not alter IFN-β expression (Fig. S2A, B), which is typically induced upon activation of the canonical TLR signalling pathway [48]. Expression of the primary adaptor proteins MYD88 and TRIF was unchanged in response to miRNA stimulation compared to unstimulated control. In WT microglia, the described alterations in TLR signalling started as early as 6 h post-stimulation (Fig. S2B). No such transcriptional changes in the expression of TLR signalling elements were observed in primary WT neurons (Fig. S2C). Exposure to miR-29-5p mimic increased miR-29a-5p expression in WT microglia. Loxoribine downregulated its expression, while Aβ had no significant effect (Fig. S2D).
Next, the effect of miR-29a-5p exposure on microglial phagocytic activity in the context of AD was assessed. WT microglia responded to extracellular miR-29a-5p by increasing phagocytic uptake of Aβ1–42 compared to unstimulated control. However, in Tlr7^−/−^ microglia, miR-29a-5p did not increase Aβ phagocytosis compared to unstimulated indicating a role for this receptor in miRNA-modulated Aβ phagocytosis (Fig. 2G, H). Of note, baseline phagocytic activity of Tlr7^−/−^ microglia appeared to be, although not statistically significant, greater than that of WT microglia (data not shown). Thus, relative phagocytic activity between genotypes were not directly compared (Fig. 2G).
Extracellular miR-29a-5p induces neuronal injury in the presence of microglia in vitro
Small RNA molecules are capable of inducing neuronal injury through microglia [10, 12]. As we had observed that miR-29a-5p is a potent activator of microglia, we assessed neuronal viability after exposure to this miRNA in co-cultures of WT neurons and WT microglia. MiR-29a-5p led to a significant and dose-dependent reduction of neuronal viability, with approximately 40% neuronal loss at the highest dose (10 µg/mL) used over 5 d (Fig. 3A, B). Also, we observed distinct changes in microglial morphology, i.e. increase in amoeboid cell shape, enlarged cell bodies, and cellular extensions, indicating the microglial response to miR-29a-5p exposure (Fig. S3A). Conditioned media from miR-29a-5p-stimulated microglia induced significant neuronal loss after 5 d (Fig. S3B, C). Thus, the reduction in relative neuronal viability after miR-29a-5p treatment was assumed to be due, at least in part, to toxic soluble factors released by microglia upon TLR activation, as previously described [49, 50]. Also, it is possible that the observed neurotoxic effects in co-cultures were due to microglia phagocytosing neurons. In contrast, when WT neurons were co-cultured with Tlr7^−/−^ microglia at the highest miR-29a-5p concentration (10 µg/mL), neurotoxic effects observed in co-cultures containing WT microglia were prevented, with no change in neuronal viability compared to control conditions (Fig. 3A, C). Incubation of enriched cortical neurons with miR-29a-5p slightly reduced relative neuronal viability, with significant neuronal loss detected after 11 d (Fig. 3D). Numbers of TUNEL-positive cells were unchanged in these enriched neuronal cultures compared to unstimulated control (Fig. S3D, E). In contrast, loxoribine caused injury in enriched neuronal cultures, as expected from previous studies on cell-autonomous neurotoxicity, which is mediated through neuronal TLR7 [10–12]. MiR-29a-5p expression as measured by RT-qPCR was increased in cortical neurons exposed to miR-29a-5p mimic after 24 h. Stimulation with Aβ or loxoribine did not lead to significant effects on miR-29a-5p expression in these cells (Fig. S3F). Fig. 3. Extracellular miR-29a-5p reduces neuronal viability in vitro. A) Representative images of NeuN immunostaining and DAPI staining of co-cultures containing C57BL/6 (WT) neurons with either WT or Tlr7^−/−^ microglia after stimulation with indicated agents for 5 d. B) Co-cultures of WT neurons with WT, or C) Tlr7^−/−^ microglia were stimulated with indicated dose or 10 µg/mL of miR-29a-5p for 5 d and immunostained with NeuN antibody to assess neuronal numbers. Mut. oligo (10 µg/mL), loxoribine (1 mM), or LPS (100 ng/mL) served as controls. D) WT neurons stimulated with mut. oligo, miR-29a-5p (both 10 µg/mL), or loxoribine (1 mM) for 5, 8, or 11 d, and subsequently immunostained with NeuN antibody to assess neuronal viability. E) Representative images of MAP2 immunostaining and DAPI staining of co-cultures containing WT neurons with either WT or Tlr7^−/−^ microglia after stimulation with indicated agents for 5 d. F) Co-cultures of WT neurons with WT, or G) Tlr7^−/−^ microglia were stimulated with indicated dose or 10 µg/mL of miR-29a-5p for 5 d and immunostained with MAP2 antibody to assess relative expression. H) Co-cultures of WT neurons and WT microglia were treated with Aβ1–42 (10 µM) or Tau (100 nM), miR-29a-5p (10 µg/mL), or both, for 5 d, and subsequently immunostained with NeuN antibody to assess neuronal viability. Dashed line indicates unstimulated condition. Scale bars represent 50 μm. Significance tested with a one-way ANOVA followed by Sidak’s multiple comparison test to unstimulated condition or mut. oligo. *p < 0.05; *p < 0.01; ***p < 0.001; ****p < 0.0001 to unstimulated condition. ^†^p < 0.05; ^‡^p < 0.01; ^††^p < 0.001 to mut. oligo. Error bars represent mean ± SEM. n = 3–7.
In line with the observed neurotoxic effects in co-cultures containing WT microglia, extracellular miR-29a-5p significantly reduced numbers of dendrites in the presence of WT microglia (Fig. 3E, F). In contrast, dendrite numbers in co-cultures containing Tlr7^−/−^ microglia were not affected by miR-29a-5p treatment (Fig. 3E, G). Given that extracellular miR-29a-5p induced substantial loss of neurons and dendrites in the presence of microglia, we questioned whether the inclusion of AD-associated proteins such as Aβ and tau would affect these miRNA-induced neurotoxic effects. In co-cultures of WT neurons and microglia, tau induced significant neurotoxic effects, while Aβ1–42 elicited a response with a similar trend, although not reaching statistical significance (p = 0.09), over 5 d. Notably, although miR-29a-5p increased Aβ phagocytosis at low protein concentrations (see Fig. 2G) combinatorial treatment of high Aβ or tau concentration with miR-29a-5p did not alter neurotoxic effects beyond that of miR-29a-5p or Aβ/tau protein treatment alone (Fig. 3H).
Intrathecal miR-29a-5p causes microglial accumulation and neuronal loss in the murine cerebral cortex
To investigate the effects of extracellularly delivered miR-29a-5p on the CNS in vivo, we intrathecally injected WT and Tlr7^−/−^ mice with synthetic miR-29a-5p. Additional mice were injected with the mut. oligo as a sequence specificity control, loxoribine as a positive control for TLR7 activation, or water as the vehicle sham control. After 3 d, mice were sacrificed, and cerebral cortices were analysed by immunohistochemistry. Immunostaining with NeuN antibody revealed neuronal loss in the cerebral cortex of WT mice injected with miR-29a-5p or loxoribine compared to both vehicle and mut. oligo controls. These neurotoxic effects induced by miR-29a-5p or loxoribine in WT mice were abolished in Tlr7^−/−^ mice (Fig. 4A, B). Dendritic and axonal structure, as assessed by immunostaining with MAP2 and neurofilament antibodies, respectively, were not altered by miR-29a-5p treatment of WT or Tlr7^−/−^ mice compared to control conditions (Fig. S4A-D). Quantification of Iba1-positive cells revealed increased numbers of microglia in the cerebral cortex of WT mice injected with miR-29a-5p or loxoribine compared to both vehicle and mut. oligo conditions. In contrast, microglial numbers did not differ in Tlr7^−/−^ mice in any condition (Fig. 4C, D), indicating a role for TLR7 in microglial accumulation in response to intrathecal miR-29a-5p. Besides microglia, GFAP-positive astrocytes also express TLR7 [51]. However, as GFAP is readily expressed by nearly all hippocampal but not cortical astrocytes [52], hippocampal GFAP-positive astrocytes were quantified in our experimental set-up. Neither miR-29a-5p nor loxoribine altered astrocyte coverage in WT or Tlr7^−/−^ mice (Fig. S4E, F).
Fig. 4. Intrathecal injection of miR-29a-5p into mice induces neuronal loss and microglial accumulation in the cerebral cortex.** A-D**) C57BL/6 (WT) and Tlr7^−/−^ mice were intrathecally injected with vehicle (water, 40 µL, n = 4 for each genotype), mut. oligo (10 µg, n = 4 for each genotype), miR-29a-5p (10 µg, n = 4 for each genotype), or loxoribine (136 µg, n = 4 for each genotype), and sacrificed after 3 d. A) Representative images of NeuN immunostaining of the cerebral cortex of WT and Tlr7^−/−^ mice. Scale bar represents 50 μm. B) Quantification of NeuN-positive neurons in the cerebral cortex. C) Representative images of Iba1 immunostaining in WT and Tlr7^−/−^ mice. Scale bar represents 100 μm. D) Quantification of Iba1-positive microglia in the cerebral cortex. E-J) WT and APP/PS1 mice given 3 monthly intrathecal injections of vehicle (water, 40 µL, n = 6), miR-29a-5p (10 µg, n = 9) with or without pre-treatment with LNA (125 pmol, n = 6) or control inhibitor (125 pmol, n = 6). E) Representative images of Iba1, 4G8, NeuN, and cleaved caspase-3 immunostaining in the cortex of vehicle- and miR-29a-5p-treated WT and APP/PS1 mice. Scale bar represents 50, 25, and 10 μm, respectively. F) Percent area of 4G8-positive Aβ plaques in the entire cortex of APP/PS1 mice. G) Quantification of NeuN-positive neurons in the cerebral cortex of WT and APP/PS1 mice. H) Quantification of caspase-3-positive cells in the cortex of WT and APP/PS1 mice. I) Percentage of Iba1-positive microglia coverage in the cortex of WT and APP/PS1 mice. J) Multiplex immunoassay analysing cyto- and chemokine expression in brain tissue from vehicle or miR-29a-5p conditions in WT and APP/PS1 mice (n = 3). Significance determined by a two-way ANOVA followed by Tukey’s multiple comparison test. *p < 0.05; **p < 0.01; ***p < 0.001; **p < 0.0001 relative to vehicle control. ^†^p < 0.05; ^‡^p < 0.01; ^‡‡^ p < 0.0001 to Tlr7^−/−^ of the same condition. Error bars represent mean ± SEM. n = 3–9.
To investigate the effect of miR-29a-5p as a signalling molecule in the context of AD in vivo, we injected both APP/PS1 and WT mice intrathecally with miR-29a-5p over an extended period of 12 weeks. To this end, 30 d old mice were treated with 3 monthly injections of miR-29a-5p and sacrificed 30 d after the final injection (Fig. S5A). RT-qPCR analysis of miR-29a-5p expression in the cerebral cortex of WT and APP/PS1 mice treated with miR-29a-5p mimic showed no changes in miR-29a-5p expression, likely due to degradation of the injected miRNA over the 30 d period since the final miRNA injection. At baseline, miR-29a-5p expression in APP/PS1 mice appeared lower than in WT, but this difference did not reach statistical significance (Fig. S5B). Next, Aβ plaque load in the cortex (Fig. 4E, F) and hippocampus (Fig. S5C) of APP/PS1 mice intrathecally injected with miR-29a-5p was quantified. No change in plaque load was observed in any tested group compared to control condition. Likewise, no substantial changes in the size distribution of plaques in the cortex or hippocampus were found in the different treatment conditions (Fig. S5D, E). Using a multiplex protein assay soluble and insoluble Aβ forms in the brains of miR-29a-5p-injected APP/PS1 mice were quantified. No significant changes in Aβ40 or Aβ42 expression were found (Fig. S5F). Aβ38, a vessel-associated Aβ subtype often present in cerebral amyloid angiopathy [53], was not detected in any condition (data not shown). This may be explained by the relatively young age of the injected mice (120 d), at which vascular Aβ expression levels are low [54].
As observed in the mouse model treated with a single miRNA injection (see Fig. 4A, B), neuronal numbers in the cerebral cortex of mice treated with multiple injections were reduced, with miR-29a-5p causing approximately a 12.5% loss of cortical neurons in APP/PS1 mice. In WT mice, we also observed such a trend (p = 0.06; Fig. 4G). No change in dendritic or axonal structure as measured by MAP2 and neurofilament expression, respectively, was observed in any condition (Fig. S5G-I). Pre-treatment with an LNA-based miR-29a-5p inhibitor prior to miR-29a-5p administration showed a slight trend towards preventing neuronal loss induced by miR-29a-5p alone in both APP/PS1 and WT mice, however, this effect was not statistically significant. Pre-treatment with a control inhibitor prior to miRNA injection resulted in a similar degree of neuronal injury as miR-29a-5p alone, though this effect did not reach statistical significance. Furthermore, cleaved caspase-3 expression was increased in both APP/PS1 and WT mice injected with miR-29a-5p (Fig. 4H). Pre-treatment with miR-29a-5p inhibitor reduced numbers of cleaved caspase-3-positive cells in both genotypes, although these effects did not reach statistical significance when compared to miR-29a-5p alone (WT, p = 0.56; APP/PS1, p = 0.09). In contrast to the mouse model of single miRNA injection described above (see Fig. 4D), repeated miR-29a-5p injections over 3 months did not change numbers of Iba1-positive microglia in the cerebral cortex (Fig. 4I) or hippocampus (Fig. S5K) of APP/PS1 or WT mice. Likewise, numbers of microglia expressing Dectin-1 were unchanged in APP/PS1 mice after 120 d of miRNA treatment (Fig. S5I, L). To further analyse the neuroinflammatory response of APP/PS1 and WT mice after multiple intrathecal miR-29a-5p injections over an extended time course, cytokine and chemokine expression in the respective cerebral cortex at time point 30 d after the last miRNA injection was determined by multiplex immunoassay (Fig. 4J, Table S2). MiR-29a-5p injection significantly increased IFN-γ expression in APP/PS1, but not in WT mice. IL-12p70 and IFN-β expression tended to increase in APP/PS1 mice treated with miR-29a-5p compared to vehicle (p = 0.056; p = 0.063, respectively). Expression levels of TNF, IL-6, IL-10, IL-1β, CXCL10, and CCL2 were unaltered by miRNA injections in both genotypes (Fig. 4J).
Intrathecal miR-29a-5p downregulates the MAPK pathway in APP/PS1 and WT mice
Next, we sought to determine whether miR-29a-5p injections into mice result in transcriptomic changes in APP/PS1 and WT mice, over an extended period (time point 30 d after the third injection) (Fig. S7A). All differential gene expression was compared to the vehicle control. In both WT (Fig. 5A) and APP/PS1 (Fig. 5B) mice, miR-29a-5p treatment primarily downregulated MAPK pathway genes including DUSP1, NR4A1, and Junb. Similarly, miR-29a-5p in combination with LNA inhibitor or control inhibitor downregulated MAPK gene expression in both genotypes, except WT mice pre-treated with control inhibitor, where expression of only five genes was significantly affected (Table S2). The MAPK-inducible gene, Arc, which has been linked to synaptic plasticity, was also significantly downregulated in all treatment groups in both genotypes (Fig. 5A, B). Analysing genotype-specific gene differentiation linked to microglial function and AD after miR-29a-5p treatment, WT, but not APP/PS1, mice exhibited downregulation of Cish, a gene upregulated in AD patients and in response to Aβ stimulation in microglia [55], and upregulation of TAL1, a regulator of aging in microglia [56]. In APP/PS1, but not WT, mice, miR-29a-5p injections downregulated expression of TRIB1, a gene involved in TLR responses and M2 polarisation of macrophages [57, 58], and CCN1, which affects neuronal health in App^NL−G−F^ AD model mice [59] (Fig. 5A, B).
Fig. 5. Inflammatory and transcriptional response of APP/PS1 and WT mice intrathecally injected with miR-29a-5p. Volcano plots of RNA-seq analysis showing differential gene expression from A) WT mice, B) APP/PS1 mice, or C) combined WT and APP/PS1 genotypes given three monthly injections of miR-29a-5p compared to vehicle. D) Venn diagram of RNA-seq analysis indicating the number of overlapping and divergent differentially expressed genes between WT, APP/PS1, and combined genotypes. n = 3 for all groups excluding APP/PS1 inhibitor + miR-29a-5p condition where n = 2.
Given the consistent downregulation of MAPK pathway genes in both APP/PS1 and WT mice, we analysed both genotypes together to determine overall treatment effects of miR-29a-5p (Fig. 5C, D). All conditions resulted in downregulation in the aforementioned MAPK pathway genes (Fos,* Junb*,* NR4A1*,* DUSP1/5/6*), but additional MAPK genes such as GADD45A were also found to be downregulated. GO analysis of differential gene expression for combined genotypes injected with miR-29a-5p primarily showed downregulation of negative phosphorylation terms (Fig. S7B) and downregulation of genes related to the MSigDB pathway TNF signalling via NFKB (Fig. S7C). Finally, considering miRNA’s canonical function as regulators of post-transcriptional gene expression, we queried the databases miRDB and miRTarBase to search for mRNA targets of miR-29a-5p, which may confound our transcriptome data derived from mice injected with the miRNA described above. No theoretical or experimentally validated mRNA targets that are downregulated in APP/PS1 or WT mice treated with miR-29a-5p were detected (Fig. S7D).
Discussion
AD is associated with miRNA dysregulation, but the functional consequences of this alteration are unknown. Recent studies have shown that *Tlr7 *expression is increased in both AD patients and multiple AD mouse models, suggesting a role for this receptor in AD pathology [60–62]. Given that numerous miRNAs activate TLR7, thereby driving inflammation, this interaction may provide a consequence of miRNA dysregulation in AD [10–12, 25, 27]. We therefore aimed to investigate the impact of miRNAs associated with AD and neuroinflammation as potential ligands for TLR7 in the CNS. We identified several miRNAs that directly activate mouse and human TLR7, but also its twin receptor in ssRNA sensing, human TLR8, and trigger microglial activation. Considering the central role of inflammation in AD pathology, we investigated if and how one of these specific miRNAs, miR-29a-5p, which is dysregulated in AD patients [63], triggers neuroinflammation, thereby potentially serving as an example for other miRNAs acting as signalling molecules in the CNS.
In our study, extracellularly applied miR-29a-5p caused microglial cyto- and chemokine release, improved phagocytosis of Aβ, and induced neuronal injury, dependent on TLR7. Notably, miR-29a-3p, the complementary variant of miR-29a-5p, has also been shown to activate TLR7 and induce cytokine release from immune cells [64], implying this is a common function of miR-29a. Our study implicates miR-29a-5p as an extracellularly active signalling molecule in CNS inflammation. Other research has shown anti-inflammatory effects of miR-29a-5p. For instance, in a model of brain injury, transfected miR-29a-5p reduced IL-1β production [65]. In a mouse model of depression, chronic miR-29a-5p overexpression shifted glia to a homeostatic state [66]. This data suggests that miR-29a-5p’s inflammatory effects are context-dependent and vary by disease model. Similar context-dependence has been found for other miRNAs, such as miR-223-3p, which we also validated as a TLR7 ligand. This miRNA reduces inflammation when either genetically deleted or when chronically overexpressed depending on the disease model [67, 68]. Importantly, these studies highlight the miRNAs’ canonical role in gene silencing rather than their function as extracellularly active signalling molecules. This may be the reason for the miRNA’s different effects on the inflammatory response. Our data indicate that extracellular miR-29a-5p can enter microglia to activate RNA-sensing TLRs located to the endosomal compartment, as previously described for other miRNAs [10, 29]. As such, for extracellular miRNAs to exert gene silencing functions, they would need to cross the endosomal lipid bilayer, which is a severe rate-limiting factor [69], and may also explain why we observe pro- rather than anti-inflammatory responses from miR-29a-5p acting as a signalling molecule for microglia. Even so, disease context should be carefully considered when analysing inflammation driven by miRNAs as this could substantially influence the potential therapeutic implications for miRNAs. Determining the potential of selected miRNAs as therapeutic targets in CNS diseases such as AD is in progress though challenges remain in delivery, specificity, and side effects [70]. Also, as miRNAs target multiple mRNAs in their canonical function, besides acting as TLR ligands, deciphering the downstream signalling consequences of miRNA therapeutics is highly complex. Thus, to target specific cell types and pathological conditions extensive preclinical validation is required. Neuronal injury is a hallmark of neuroinflammatory states, including AD. In this study, extracellular miR-29a-5p requires TLR7-expressing microglia to cause distinct inflammatory and neurotoxic effects in the murine brain. Our data suggest a role for yet unidentified neurotoxic molecules released from microglia upon miR-29a-5p stimulation. In principle, microglia can release neurotoxic factors including cytokines such as TNF, nitric oxide, among others, when activated by TLRs [49, 50]. We cannot rule out that some miR-29a-5p mimic remaining in the conditioned media used for incubation of neurons was, at least in part, responsible for the observed neurotoxicity. However, since we did not detect toxic effects from miR-29a-5p doses as high as 10 µg/ml in neuron cultures within similar time frames, such a scenario seems unlikely. Also, in an AD context, microglia might engulf dying neurons because of Aβ exposure. TLR7 is not only expressed in microglia but also in neurons and is involved in synapse physiology and cell death [21, 71]. Our previous data showed that TLR7-activating miRNAs such as let-7b and miR-100-5p, whose expression is upregulated in AD, induce TLR7-dependent neurotoxicity in a cell-autonomous fashion, without microglial involvement [10, 12]. In our current study, cell-autonomous toxic effects of miR-29a-5p on neurons were relatively delayed and mild compared to other TLR7-activating miRNAs [10, 12, 29], indicating that miRNA-TLR7 interactions in the brain have cell- and sequence-specific functional consequences. In our study, the mechanisms of CNS cell type-specific responses to miR-29a-5p treatment remain unresolved. How extracellular miRNAs act differently upon specific cell types, not only on microglia and neurons, but also on other CNS cells such as astrocytes and oligodendrocytes, and why the functional outcome of TLR7 activation in these different cell types differs, is unclear. Features such as high guanosine content or successive uridines present in the miRNA’s sequence may preferentially target the first and/or second binding site of TLR7, respectively [72, 73], thereby potentially modulating receptor activation and the downstream signalling cascades in a distinct cell type. Other mechanisms particularly relevant in vivo include cell-specific extracellular small RNA transfer which has been reported for miRNAs encapsulated within extracellular vesicles (EVs). Mast cells release miR-409-3p in EVs to promote microglial migration [74], while astrocyte-derived miR-873a-5p attenuates microglial inflammation [75], though in our experimental system miRNAs were not encapsulated in EVs. We have previously shown and now confirmed that CNS cells uptake non-EV-associated extracellular miRNAs, which co-localise to endosomes (and TLR7) [10], but how this applies to specific cell populations in heterogeneous organ systems like the CNS in vivo remains unresolved. Furthermore, in contrast to microglia cortical neurons are able to uptake uncomplexed miRNA, as reported previously [10, 12, 29]. We showed recently that dynamin-mediated endocytosis is involved in the uptake of certain neurodegenerative disease-associated naked miRNAs, such as miR-124-5p, by CNS neurons [29]. Future studies may resolve the sequence motifs and other miRNA features controlling extracellular miRNA uptake and trafficking mechanisms in different cell types.
So far, potential long-term and disease-specific effects of extracellular miRNAs in the CNS are poorly understood. We therefore modified our established mouse model of intrathecal injection, whereby 3 monthly injections of miR-29a-5p were given to WT and APP/PS1 mice. Unlike our acute single injection model, where intrathecal miR-29a-5p increased microglial numbers after 3 d, several miRNA injections given over an extended period did not change microglial marker expression or key pathologies of APP/PS1 mice, including expression of soluble and insoluble Aβ40/42, with Aβ38 being undetectable. As we did not evaluate the effects of our 3 d-single injection protocol in APP/PS1 mice, we cannot exclude the possibility of short-term effects from miR-29a-5p injection in this AD mouse model. Notably, the neurotoxic effects observed after a single injection of miR-29a-5p after 3 d persisted but were not cumulative with repeated injections over extended time. This suggests that miRNA-induced neuronal injury represents an acute rather than chronic effect. Also, the miRNA injection may have affected certain subpopulations of CNS neurons though whether injected miR-29a-5p or other miRNAs preferentially target specific neuronal types or brain regions remains unknown. Effects on microglial accumulation observed after 3 d miRNA treatment in the acute model were abolished in the experimental long-term setting, potentially due to degradation of the injected miR-29a-5p mimic over a 30 d-period after the final injection. Although the oligoribonucleotide we injected has been chemically stabilised by phosphorothioate bonds, which prevent RNA degradation, this protective effect may subside over time and thus, an effect on microglial numbers has not been detected after intrathecal miR-29a-5p injection in our long-term model. Although employing an established mouse model of intrathecal injection, it remains unclear, how the injected miRNA reaches the cerebral cortex. However, as intrathecal injection of mutant oligonucleotide did not have an effect on neuronal viability or microglia numbers, whereas miR-29a-5p and other sequence-specific miRNAs in previous studies did, it implies that in principle, miRNAs can reach the brain by intrathecal injection and induce sequence-specific effects [10, 12, 29]. Future studies are necessary to analyse time-dependent effects and dynamics of specific miRNA injection and especially, to determine therapeutic implications of such miRNAs acting as signalling molecules in the brain.
After 120 d miRNA treatment we observed an increase in the expression of inflammatory molecules, such as IFN-γ, and to a lesser extent of IFN-β and IL-12p70 in APP/PS1, but not in WT mice. IFN-γ, IFN-β, and IL-12 signalling have been shown to contribute to the pathology of APP/PS1 mice and may play a role in AD pathogenesis [76–78]. Altogether, our data demonstrates that extracellularly applied miR-29a-5p can induce long-term changes in the CNS inflammation pattern, though the cellular source responsible for these changes remains undetermined. As such, the mechanistic link between intrathecal miR-29a-5p application and the increase in the expression of inflammatory molecules also remains unresolved. We only detected alterations of the inflammatory pattern in APP/PS1 mice, but not in WT mice, suggesting that the cellular environment alters the inflammatory response to miR-29a-5p treatment. Such observations have been reported in other studies using LPS, e.g [79]. Future studies will be required to dissect the effects of miRNAs on different CNS cell types and genotypes. For example, employing a conditional Tlr7^−/−^ knockout mouse model and AD models lacking TLR7 expression may validate the role of microglia in miR-29a-5p-induced neuronal injury and modulation of the inflammatory response, particularly in an AD context.
So far, the endogenous miRNA concentrations in the brain, which would be sufficient to activate TLR7, are unknown. We have previously shown that 2 million neurons release approx. 22.89 nM of miRNA (6.9 million copies/neuron) [10], and in this study found that miR-29a-5p causes microglial TNF release starting at doses from 0.1 µg/mL miRNA (approx. 11.43 nM; p = 0.001, unpaired *t-*test, miRNA compared to unstimulated condition; see Fig. 2A). Given this, it is plausible that miRNA amounts released from dying neurons — and potentially from other CNS cell types — are sufficient to activate TLR7, particularly in pathological conditions when neurons degenerate. Notably, miR-29a-5p is expressed at higher levels in microglia compared to neurons [80, 81]. Still, in our study, we cannot rule out that supraphysiological doses of miR-29a-5p causing the observed effects in vitro and in vivo were used. Furthermore, whether the effects from miR-29a-5p application on CNS cells were direct or secondary, involving yet unidentified signalling pathways, remains unresolved. An increase in miR-29a-5p expression in WT or APP/PS1 mice injected with miR-29a-5p mimic was not detected by qPCR, though this might be, at least in part, due to degradation of the administered miRNA. In addition, the respective cellular response to extracellular miRNA may be altered upon repeated doses. Future research may determine the concentrations of both endogenous and applied miRNAs required to activate TLR7 in the brain, both in homeostasis and disease.
Interrogating transcriptional changes revealed intrathecal miR-29a-5p caused enduring downregulation in MAPK pathway-related genes such as NR4A1, DUSP, Junb, and Fos, in both WT and APP/PS1 mice. MAPK is a fundamental pathway involved in many processes including apoptosis, proliferation, and inflammation. Consequently, aberrant regulation of the pathway has been implicated in many diseases including AD, and further neurodegenerative diseases such as amyotrophic lateral sclerosis [82]. As such, MAPK inhibitors are being investigated as clinical compounds for AD [83]. Notably, DUSP genes, including DUSP1 and 6, which are downregulated in AD patients and modulate the amyloidogenic process [84–86], are critical inhibitors of the MAPK pathway activity and were downregulated by miR-29a-5p administration. Importantly, none of the differentially expressed genes from miR-29a-5p treatment are known or predicted mRNA targets of miR-29a-5p, suggesting that MAPK pathway deregulation is driven by direct miRNA–TLR interaction, although this cannot be definitively confirmed here. Still, the fact that the MAPK pathway modulates microglia-driven inflammation, is activated by, and helps to regulate TLR signalling [87–89], does suggest miR-29a-5p acting as a signalling molecule alters TLR signalling. A TLR-mediated mechanism is further supported by downregulation of specific genes like Arc, which is involved in neuroinflammation [90] and is downregulated upon TLR7/8 activation [91], and NR4A1, which prevents overactivation of microglia from TLR signalling [92, 93]. Of note, many of these genes were also downregulated when both miR-29a-5p and its LNA inhibitor were administered. This may be due to the fact that the inhibitor was pre-administered 16 h before miR-29a-5p and thereby, could be depleted by endogenous miRNA, resulting in reduced inhibition of the subsequent injection of synthetic miR-29a-5p. In line with this, there was no significant effect of the LNA-based miRNA inhibitor on neurotoxicity induced by the injected miRNA in both WT and APP/PS1 mice. Although single genes were differentially expressed in WT and APP/PS1 mice in response to miRNA treatment and even with the differing cellular environments of both genotypes, miR-29a-5p broadly downregulated the MAPK pathway, indicating a common mechanism of action of miR-29a-5p, when acting as a signalling molecule in both genotypes.
MiR-29a-5p is associated with a wide range of diseases from colorectal and liver cancer to glioma, exemplifying the broad consequences of miRNA dysregulation [94–96]. In AD patients, the expression of miR-29a is frequently dysregulated and has been proposed as a possible biomarker for disease progression [63, 97–100]. MiR-29a-3p is downregulated in the brain of AD patients with high levels of BACE1 [97] and in the serum of probable AD patients [99], but conversely, increased in the plasma [98] and CSF of AD patients [101]. MiR-29a-5p expression is negatively correlated with cortical thickness in AD patients [63]. Furthermore, the expression of miR-29a-5p in neuronal and microglial EVs is reduced in AD patients [63]. This is crucial when considering miR-29a-5p as an extracellularly active molecule, as miRNAs in EVs play a central role in mediating immune responses [102]. Given both miR-29a-5p and miR-29a-3p are downregulated in the brain, and they both activate TLR7 causing cytokine release, reduced expression of miR-29a in AD patient brains could be a protective mechanism to limit inflammation via TLR7.
Conclusion
This study identifies certain miRNAs dysregulated in AD patients and neuroinflammation as TLR7 ligands capable of activating microglia, thereby shaping the neuroinflammatory response. Extracellularly delivered AD-associated miR-29a-5p induces lasting alterations of the expression of certain cytokines and MAPK pathway elements in the murine brain. Our findings indicate that extracellular miRNA can have prolonged effects in an AD context, supporting the miRNAs’ potential as candidate molecules relevant for both disease pathogenesis and novel therapeutic approaches. Future research exploring the pharmacokinetics/dynamics, trafficking, and cell-specific effects of extracellular miRNAs in vivo will be vital to understand the outcome of miRNA dysregulation in neuroinflammatory states and for the miRNAs’ progress as disease-modifying tools.
Supplementary Information
Supplementary Material 1. Figure S1. LyoVec transfection increases microglial TNF response to miR-29a-5p, and miR-29a-5p co-localises to endosomes in microglia. A) C57BL/6 (WT) microglia were exposed to free or LyoVec-transfected miR-29a-5p and mutant oligonucleotide (10 μg/mL) for 24 h. TNF concentration in the supernatant was subsequently assessed by ELISA. LPS (100 ng/mL) served as a positive control (n = 3). B) WT microglia were incubated with pHrodo Red (20 μg/mL) and Alexa-488-conjugated miR-29a-5p (10 μg/mL) for 4 h with line profiles depicting fluorescence intensity in marked region of interest (white line). Figure S2. Extracellular miR-29a-5p induces transcriptional TLR pathway changes in microglia in vitro. A) WT and Tlr7^−/−^ microglia were exposed to LPS (100 ng/mL) for 24 h. B) WT microglia were exposed to LPS (100 ng/mL) or miR-29a-5p (10 μg/mL) for 6 h. C) WT neurons were exposed to miR-29a-5p (10 μg/mL) for 48 h. D) miR-29a-5p expression was assessed in WT microglia exposed to miR-29a-5p (10 μg/mL), Aβ (10 μM), or loxoribine (1 mM) for 24 h. For all experiments, RNA was extracted from cells for analysis by RT-qPCR. Significance tested by multiple unpaired t-tests by two-stage step-up method A-C) or one-way ANOVA followed by Sidak’s multiple comparison test D). **p < 0.01 to unstimulated, ^†^p < 0.05 to gene of interest exposed to different conditions. Dashed line represents unstimulated condition. Error bars represent mean ± SEM. n = 3. Figure S3. Effect of extracellular miR-29a-5p on cortical neurons in vitro. A) Representative images of NeuN and Iba1 immunostaining after 5 d in co-cultures of WT neurons and WT microglia exposed to mut. oligo, miR-29a-5p (10 μg/mL), or loxoribine (1 mM). Scale bar represents 50 μM. B, C) Cultures of WT microglia were stimulated with mut. oligo, miR-29a-5p (10 μg/mL), or loxoribine (1 mM) for 24 h to create conditioned media. Cultures of enriched cortical neurons were exposed to this microglia-conditioned media for 5 d. B) Representative images of NeuN and DAPI and C) quantification of immunostaining in cultures of enriched cortical neurons after 5 d of exposure to microglial conditioned media. Scale bar represents 50 μM. D) Representative images of NeuN immunostaining, DAPI, and TUNEL staining in enriched WT neurons after stimulation with indicated agent for 5 d. Scale bar represents 50 μm. E) Enriched cortical neurons were treated with miR-29a-5p (10 μg/mL) for 5 or 8 d, immunostained with NeuN antibody, and stained with TUNEL assay and DAPI. Ratio of TUNEL- to DAPI-positive cells was assessed. Mut. oligo (10 μg/mL) and loxoribine (1 mM) served as controls. F) Quantification of miR-29a-5p expression in WT neurons exposed to miR-29a-5p mimic (10 μg/mL), Aβ (10 μM), or loxoribine (1 mM) for 24 h, by RT-qPCR. Dashed line represents unstimulated condition. Significance tested by one-way ANOVA followed by Sidak’s multiple comparison test. *p < 0.05; **p < 0.01; ***p < 0.001; ****p < 0.0001 to unstimulated or ‡p < 0.01 to mut. oligo condition. n = 3-5. Figure S4. Intrathecal injection of miR-29a-5p does not affect cortical dendrite and axon structure, or hippocampal astrocyte numbers. A-F) WT and Tlr7^−/−^ mice were injected with vehicle (water, 40 μL), mut. oligo (10 μg), miR-29a-5p (10 μg), or loxoribine (136 μg) and sacrificed after 3 d. A) Representative images of MAP2 immunostaining in the retrosplenial cortex. B) Quantification of cortical MAP2-positive dendrites. C) Representative images of neurofilament immunostaining in the retrosplenial cortex. D) Quantification of neurofilament-positive axons in the cortex E) Representative images of hippocampal GFAP immunostaining. F) Quantification of GFAP-positive astrocytes in the hippocampus. Scale bars represent 100 μm for MAP2 and NF or 500 μm for GFAP. Error bars represent mean ± SEM. n = 4. Figure S5. miR-29a-5p administration has no effect on plaque accumulation or neurite structure in WT and APP/PS1 mice. A) Timeline of repeated intrathecal injections into WT and APP/PS1 mice. B) Quantification of miR-29a-5p expression by RT-qPCR in WT and APP/PS1 mice treated with vehicle or miR-29a-5p mimic, as described in Fig. 4 E-J). C) 4G8-positive Aβ plaque area in the hippocampus of APP/PS1 mice. D) Distribution of 4G8-positive Aβ plaque size in the cortex or E) hippocampus of APP/PS1 mice. F) Multiplex analysis of soluble and insoluble Aβ40 and Aβ42 in cortical tissue of WT and APP/PS1 mice treated with vehicle or miR-29a-5p. G) Representative images of MAP2 and neurofilament immunostaining of the cerebral cortex of WT and APP/PS1 mice. Scale bars represent 50 μm. H) Quantification of MAP2-positive dendrites in the cortex of WT and APP/PS1 mice. I) Quantification of neurofilament-positive axons in the cortex of WT and APP/PS1 mice. J) Representative images of Iba1 and Dectin-1 immunostaining of the cortex of APP/PS1 mice. Scale bar represents 50 μm. K) Quantification of Iba1-positive microglia in the hippocampus of WT and APP/PS1 mice. L) Quantification of Dectin-1-positive microglia in the cerebral cortex of APP/PS1 mice. Error bars represent mean ± SEM. n = 4-9. Figure S6. Clustering and GO analysis of APP/PS1 and WT mice. A) Final clustering heatmap of all analysed mice intrathecally injected with 3 monthly doses of miR-29a-5p. B) GO analysis of combined genotypes after repeated miR-29a-5p administration. C) MsigDB analysis of differentially expressed genes from combined genotypes for miR-29a-5p administration. D) Theoretical and experimentally validated mRNA targets of miR-29a-5p that are differentially expressed in RNA-seq analysis. n = 3 for all groups excluding APP/PS1 inhibitor + miR-29a-5p condition where n = 2.
Supplementary Material 2. Table S1. List of reagents (antibodies, primers, cell lines, chemicals, and proteins) used in experimental procedures.
Supplementary Material 3. Table S2. Excel file containing complete data for differentially expressed genes in WT and APP/PS1 mice, mouse characteristics, mRNA gene targets of miR-29a-5p, and cyto-/chemokine analysis.
The reference list from the paper itself. Each links out to its DOI / PubMed record.
- 1Lian H, Roy E, Zheng H. Microglial Phagocytosis Assay. Bio-protocol. 2016;6:e 1988. 10.21769/Bio Protoc.1988 PMC 566928029104891 · doi ↗ · pubmed ↗
- 2Zhang Z, Ma Z, Zou W, Guo H, Liu M, Ma Y, Zhang L. The Appropriate Marker for Astrocytes: Comparing the Distribution and Expression of Three Astrocytic Markers in Different Mouse Cerebral Regions. Biomed Res Int. 2019; 2019:9605265. 10.1155/2019/9605265 PMC 661302631341912 · doi ↗ · pubmed ↗
- 3Klohs J, Rudin M, Shimshek DR, Beckmann N. Imaging of cerebrovascular pathology in animal models of alzheimer’s disease. Front Aging Neurosci. 2014;6:32. 10.3389/fnagi.2014.00032 PMC 395210924659966 · doi ↗ · pubmed ↗
- 4Zhang A, Lu Y, Yuan L, Zhang P, Zou D, Wei F, Chen X. mi R-29a-5p Alleviates Traumatic Brain Injury- (TBI-) Induced Permeability Disruption via Regulating NLRP 3 Pathway. Dis Markers. 2021;2021:9556513. 10.1155/2021/9556513 PMC 864541134876932 · doi ↗ · pubmed ↗
- 5Oda K, Kitano H. A comprehensive map of the toll-like receptor signaling network. Mol Syst Biol. 2006;2:2006.0015. 10.1038/msb 4100057 PMC 168148916738560 · doi ↗ · pubmed ↗