Supplementary biomarker testing in molecular tumor boards increases actionable therapy recommendations: a prospective real-world study of 658 patients
Alexander Scheiter, Simon Mellin, Felix Keil, Johannes Meier, Daniel Heudobler, Christina Brummer, Sabine Einhell, Benjamin Zwicker, Elena Wutzlhofer, Frederik Hierl, Sophie Klemm, Elena Lüftl, Tom Schneider, Markus Perl, Margit Klier-Richter, Alexander Immel, Till Kaltofen

TL;DR
Adding extra biomarker tests in cancer treatment meetings helps find more effective therapies for patients with advanced cancers.
Contribution
This study shows that supplementary biomarker testing in molecular tumor boards increases actionable therapy recommendations.
Findings
Supplementary biomarker analyses led to 182 therapy recommendations for 658 patients.
HER2-low status expanded targeted therapy options across multiple tumor types.
HRD analysis improved patient stratification for PARP inhibitors beyond BRCA1/2 mutations.
Abstract
Molecular tumor boards (MTBs) are essential for selecting therapies for patients with rare and advanced cancers. We hypothesized that integrating biomarkers beyond targeted DNA/RNA next-generation sequencing (NGS) could increase actionable findings. Human epidermal growth factor receptor 2 (HER2)-low status has emerged as a critical biomarker in breast cancer, with potential relevance across other tumor types. Homologous recombination deficiency (HRD) is pivotal for the application of Poly(ADP-Ribose)-Polymerase (PARP) inhibitors in ovarian and breast cancer, although its role in other malignancies remains unclear. Antibody–drug conjugates (ADCs) are expanding precision oncology, with promising biomarkers like Trop-2, Nectin-4, and folate receptor alpha (FRα) showing potential across multiple tumor entities. Tumors were analyzed using the TSO500® panel, enabling tumor mutational burden…
Genes, proteins, chemicals, diseases, species, mutations and cell lines named across the full text — each resolved to its canonical identifier and authoritative record.
Click any figure to enlarge with its caption.
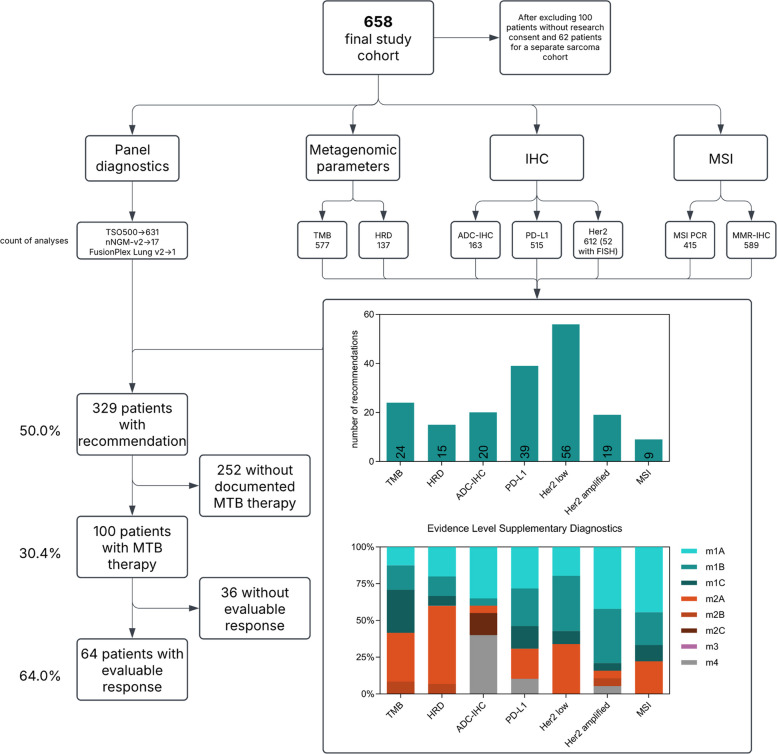 Fig. 1
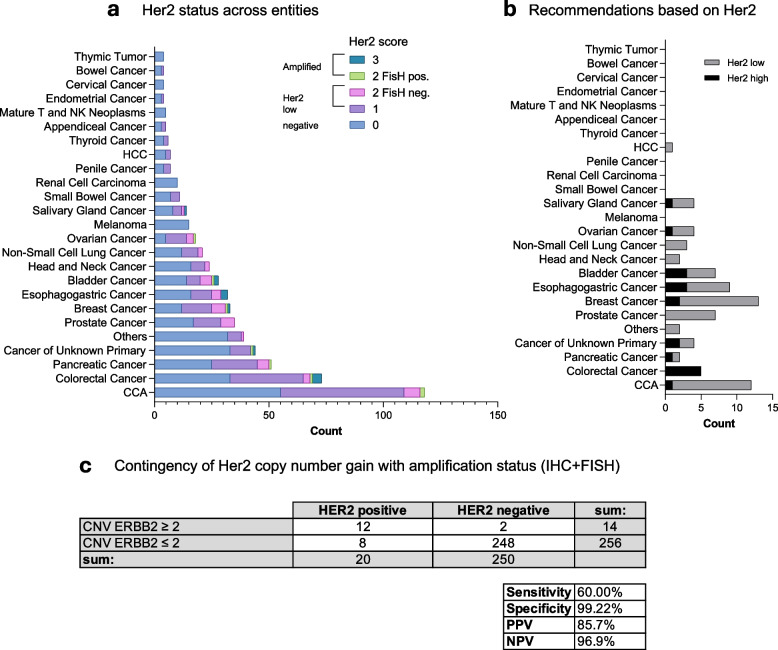 Fig. 2
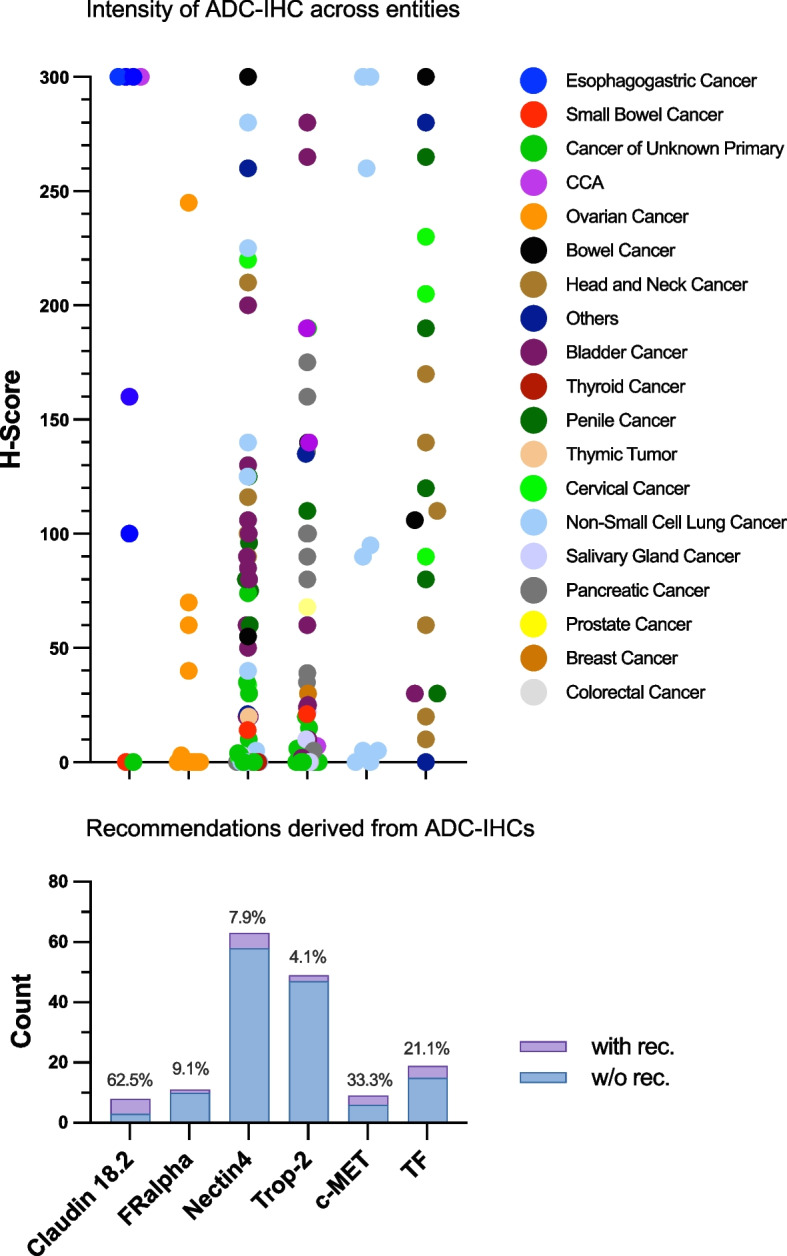 Fig. 3
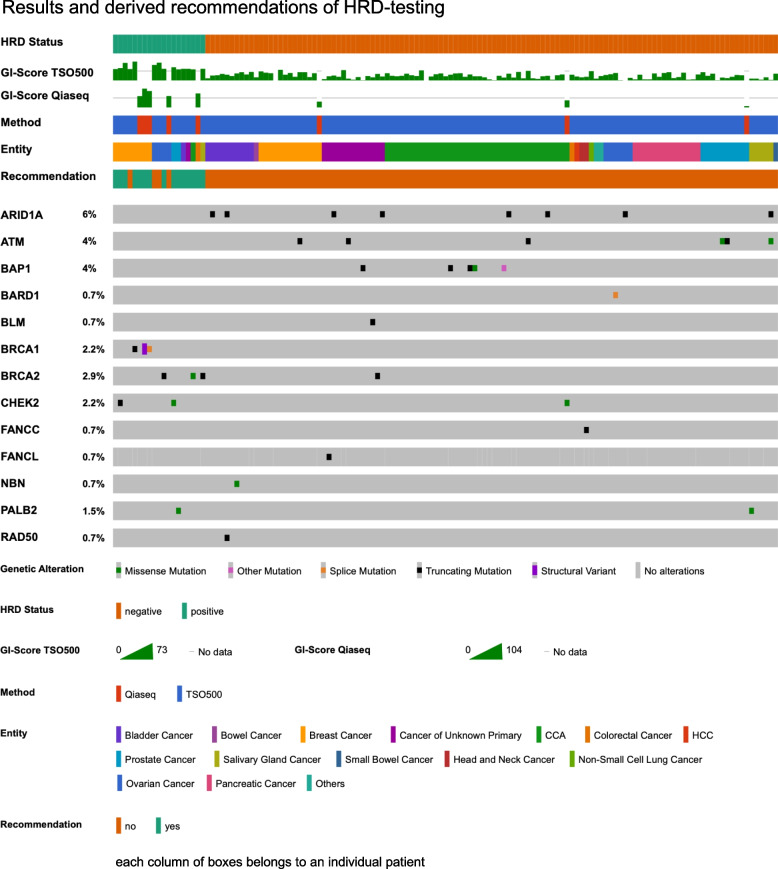 Fig. 4
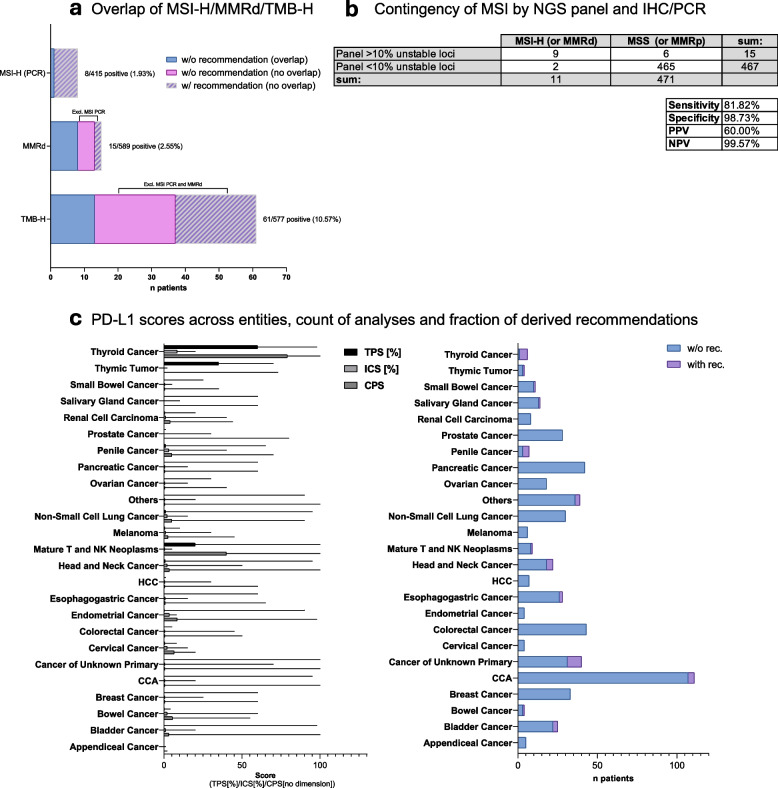 Fig. 5
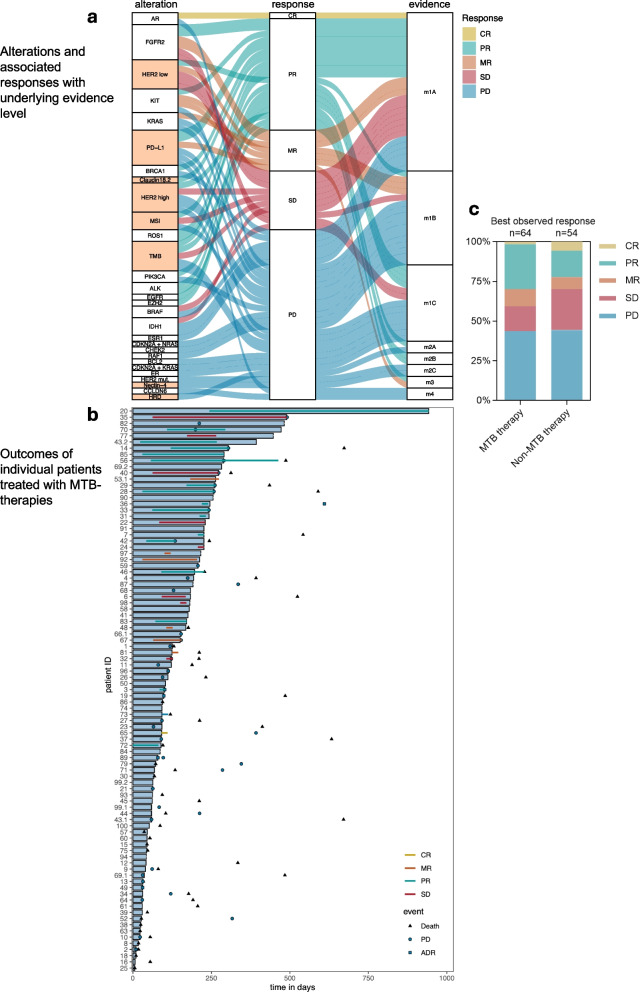 Fig. 6
| All patients | MTB therapy | Non-MTB therapy | No additional therapy | |
|---|---|---|---|---|
| Population | 658 | 100 | 89 | 469 |
| Mean age, standard deviation (years) | 60.0 ± 13.2 | 58.3 ± 12.9 | 58.2 ± 15.1 | 60.7 ± 12.9 |
| Sex | ||||
| Male ( | 389 (59.1%) | 55 (55.0%) | 55 (61.8%) | 279 (59.5%) |
| Female ( | 269 (40.9%) | 45 (45.0%) | 34 (38.2%) | 190 (40.5%) |
| ECOG PS (total, remaining unknown) | 370 | 38 | 59 | 273 |
| 0 | 170 | 21 | 38 | 111 |
| 1 | 155 | 15 | 15 | 125 |
| 2 | 31 | 1 | 6 | 24 |
| 3 | 12 | 1 | 0 | 11 |
| 4 | 1 | 0 | 0 | 1 |
| 5 | 1 | 0 | 0 | 1 |
| Stage of cancer | ||||
| I | 2 (0.4%) | 0 | 1 (1.6%) | 1 (0.2%) |
| II | 13 (2.7%) | 5 (6.7%) | 1 (1.6%) | 7 (1.5%) |
| III | 28 (5.9%) | 4 (5.3%) | 4 (6.3%) | 20 (4.3%) |
| IV | 432 (90.9%) | 66 (88%) | 57 (90.5%) | 309 (65.9%) |
| Total (remaining unknown) | 475 | 75 | 63 | 337 |
| MTB Recommendations ( | 329 (50%) | 100 (100%) | 39 (43.8%) | 190 (40.5%) |
| Evidence level primary recommendation ( | ||||
| m1A | 88 (26.8%) | 34 (34%) | 9 (23.1%) | 45 (9.6%) |
| m1B | 70 (21.3%) | 21 (21%) | 8 (20.5%) | 41 (8.7%) |
| m1C | 45 (13.7%) | 19 (19%) | 4 (10.3%) | 22 (4.7%) |
| m2A | 37 (11.3%) | 9 (9%) | 8 (20.5%) | 20 (4.3%) |
| m2B | 6 (1.8%) | 6 (6%) | 1 (2.6%) | 0 |
| m2C | 12 (3.7%) | 2 (2%) | 1 (2.6%) | 9 (1.9%) |
| m3 | 4 (1.2%) | 3 (3%) | 0 | 1 (0.2%) |
| m4 | 2 (0.6%) | 0 | 0 | 2 (0.4%) |
| Clinical trial | 64 (19.5%) | 6 (6%) | 8 (20.5%) | 50 (10.7%) |
| human genetic counseling | 146 (22.2%) | 32 (32%) | 20 (22.5%) | 94 (20.0%) |
| Entity ( | ||||
| CCA | 120 (18.2%) | 16 (16%) | 20 (22.5%) | 84 (17.9%) |
| CRC | 78 (11.9%) | 9 (9%) | 16 (18%) | 53 (11.3%) |
| Pancreatic cancer | 56 (8.5%) | 5 (5%) | 5 (5.6%) | 46 (9.8%) |
| CUP | 45 (6.8%) | 9 (9%) | 9 (10.1%) | 27 (5.8%) |
| Prostate cancer | 38 (5.8%) | 1 (1%) | 3 (3.4%) | 34 (7.2%) |
| Breast cancer | 35 (5.3%) | 10 (10%) | 7 (7.9%) | 18 (3.8%) |
| NSCLC | 35 (5.3%) | 11 (11%) | 6 (6.7%) | 18 (3.8%) |
| Esophagogastric cancer | 32 (4.9%) | 5 (5%) | 1 (1.1%) | 26 (5.5%) |
| Bladder cancer | 28 (4.3%) | 1 (1%) | 2 (2.2%) | 25 (5.3%) |
| Head and neck cancer | 24 (3.7%) | 1 (1%) | 2 (2.2%) | 21 (4.5%) |
| Ovarian cancer | 18 (2.8%) | 3 (3%) | 1 (1.1%) | 14 (3.0%) |
| Melanoma | 17 (2.6%) | 5 (5%) | 3 (3.4%) | 9 (1.9%) |
| Salivary gland cancer | 15 (2.3%) | 4 (4%) | 2 (2.2%) | 9 (1.9%) |
| Mature T and NK neoplasms | 12 (1.8%) | 3 (3%) | 0 | 9 (1.9%) |
| Small bowel cancer | 11 (1.7%) | 0 | 1 (1.1%) | 10 (2.1%) |
| Renal cell carcinoma | 10 (1.5%) | 0 | 0 | 10 (2.1%) |
| HCC | 7 (1.1%) | 0 | 0 | 7 (1.5%) |
| Penile cancer | 7 (1.1%) | 1 (1%) | 1 (1.1%) | 5 (1.1%) |
| Thyroid cancer | 6 (0.9%) | 3 (3%) | 1 (1.1%) | 2 (0.4%) |
| Appendiceal cancer | 5 (0.8%) | 0 | 1 (1.1%) | 4 (0.9%) |
| Bowel cancer | 4 (0.6%) | 1 (1%) | 0 | 3 (0.6%) |
| Cervical cancer | 4 (0.6%) | 0 | 0 | 4 (0.9%) |
| Endometrial cancer | 4 (0.6%) | 2 (2%) | 0 | 2 (0.4%) |
| Thymic tumor | 4 (0.6%) | 0 | 0 | 4 (0.9%) |
| Others ( | 43 (6.5%) | 10 (10%) | 8 (9%) | 25 (5.3%) |
| Pat ID | Cancer type | Board recommendation | Rationale | EL | L (time of MTB/ EMA) | R | ADR | Sequential MTB therapy | PFS MTB Therapy | PFS prior therapy | PFS 2 / PFS 1 MTB |
|---|---|---|---|---|---|---|---|---|---|---|---|
| 1 | Melanoma | Trametinib | RAF1; BRAF | m1B | 3 | PD | 118 | ||||
| 2 | CCA | Binimetinib + Capecitabine | KRAS | m1C | 0 | Nausea | 10 | 101 | 0.099 | ||
| 3 | Melanoma | Nivolumab | m1A | 1 | PR | Skin toxicity | 101 | ||||
| 4 | CCA | Ivosidenib | IDH1 | m1A Z(FDA) | 0 | PD | 174 | 89 | 1.955 | ||
| 5 | Breast cancer | Pertuzumab + Trastuzumab |
| m1A | 6 | ||||||
| 6 | Colorectal cancer | Sotorasib | KRAS | m1A | 1 | PD | 168 | ||||
| 7 | Esophagogastric cancer | Nivolumab |
| m1A | 1 | PR | |||||
| 8 | Mature T and NK neoplasms | Venetoclax + Ruxolitinib | BCL2 | m1C | 0 | PD | 17 | ||||
| 9 | Esophagogastric cancer | Trastuzumab Deruxtecan |
| m1B | 5 | PD | 61 | 181 | 0.337 | ||
| 10 | Pancreatic cancer | Olaparib | BRCA1 | m1A | 4 | PD | 23 | ||||
| 11 | Colorectal cancer | Sotorasib | KRAS | m1B | 3 | PD | Gastrointestinal side effects | 80 | |||
| 12 | Salivary gland cancer | Pembrolizumab |
| m2A | 0 | 44 | |||||
| 13 | Melanoma | Binimetinib + Ribociclib | CDKN2A; NRAS | m1B | 4 | PD | 32 | 468 | 0.068 | ||
| 14 | Salivary gland cancer | Alpelisib + Androgen blockade | PIK3CA | m1C | 4 | PR | 304 | ||||
| 15 | Cancer of unknown primary | Olaparib | ATM | m2B | 0 | 42 | |||||
| 16 | Others | Azacitidine | TET2 | m2B | 1 | 7 | |||||
| 17 | CCA | Pembrolizumab + Lenvatinib |
| m1B | 5 | ||||||
| 18 | Esophagogastric cancer | FLOT + Trastuzumab |
| m2A | 4 | 10 | |||||
| 19 | Pancreatic cancer | Palbociclib + Trametinib | CDKN2A; KRAS | m1C | 1 | Gastrointestinal side effects (recurrent pancreatitis) | 98 | ||||
| 20 | Others | Tazemetostat | EZH2 | m2A | 6 | PR | 942 | 256 | 3.68 | ||
| 21 | Colorectal cancer | Trastuzumab Deruxtecan |
| m1B | 2 | PD | 63 | ||||
| 22 | CCA | Ivosidenib | IDH1 | m1A Z FDA | 1 | PD | |||||
| 23 | Cancer of unknown primary | Trastuzumab |
| m2C | 0 | PD | 76 | ||||
| 24 | Colorectal cancer | Pembrolizumab |
| m1A Z (EMA) | 0 | SD | 82 | ||||
| 25 | Breast cancer | Trastuzumab Deruxtecan |
| m1A | 2 | 6 | 386 | 0.016 | |||
| 26 | Others | Pembrolizumab |
| m1C | 0 | Dermal drug reaction | 94 | ||||
| 27 | CCA | Pembrolizumab + Lenvatinib |
| m1B | 5 | PD | 92 | 471 | 0.195 | ||
| 28 | Non-small cell lung cancer | Lorlatinib | ALK | m3 | 3 | PR | 258 | 699 | 0.369 | ||
| 29 | Non-small cell lung cancer | Lorlatinib | ROS1 | m1C, m3 | 2 | PR | 261 | ||||
| 30 | CCA | Binimetinib + Capecitabine | KRAS | m1C | 1 | 66 | |||||
| 31 | Endometrial cancer | Pembrolizumab |
| m1A Z | 0 | PR | 366 | ||||
| 32 | CCA | Erdafitinib | FGFR2 | m1B | 0 | SD | Onycholysis | 122 | |||
| 33 | Head and neck cancer | Pembrolizumab |
| m1A (Z EMA) | 0 | PR | 242 | ||||
| 34 | Non-small cell lung cancer | Atezolizumab + Bevacizumab + Carboplatin |
| m1C | 0 | PD | 120 | 184 | 0.652 | ||
| 35 | Breast cancer | Trastuzumab Deruxtecan |
| m1A Z (FDA) | 6 | SD | Pneumonitis | 491 | |||
| 36 | Non-small cell lung cancer | Atezolizumab + Carboplatin + Etoposide |
| m2B (Z FDA) | 0 | PR | Bullous pemphigoid (CTC Grade IV) | 363 | |||
| 37 | CCA | Pembrolizumab |
| m1B Z | 1 | PD | 90 | ||||
| 38 | Mature T and NK neoplasms | Ruxolitinib | JAK3; STAT5B | m1B | 0 | 25 | 304 | 0.082 | |||
| 39 | Colorectal cancer | Inavolisib (CRAFT trial) | PIK3CA | N/A | 3 | 30 | |||||
| 40 | CCA | Futibatinib | FGFR2 | m1C | 1 | SD | 273 | ||||
| 41 | Mature T and NK neoplasms | Ruxolitinib | STAT5B | m2B | 0 | 175 | |||||
| 42 | CCA | Pemigatinib | FGFR2 | m1A Z | 0 | PR | 134 | ||||
| 43 | Others | Regorafenib | KIT | m1B Z | 2 | PD | Riptretinib | 59 | |||
| 44 | Endometrial cancer | Pembrolizumab |
| m1A Z | 0 | 59 | 206 | 0.286 | |||
| 45 | Colorectal cancer | Atezolizumab |
| m1C | 5 | PD | 92 | ||||
| 46 | Non-small cell lung cancer | Trastuzumab Deruxtecan |
| m1B | 4 | PR | Nausea | 196 | 196 | 1 | |
| 47 | Cancer of unknown primary | Pembrolizumab + Carboplatin + Paclitaxel |
| m2A | 0 | 244 | |||||
| 48 | Esophagogastric cancer | Trastuzumab Deruxtecan |
| m1B | 7 | MR | 168 | ||||
| 49 | Others | Pembrolizumab |
| m2A Z | 0 | GI and dermatological adverse events | 31 | 90 | 0.344 | ||
| 50 | Pancreatic cancer | Pembrolizumab |
| m2A Z (FDA) | 1 | Nausea, vomiting | 124 | 121 | 1.025 | ||
| 51 | Non-small cell lung cancer | Lorlatinib | ALK | m3 | 4 | ||||||
| 52 | Thyroid cancer | Pembrolizumab + Lenvatinib |
| m1B | 0 | 62 | 0 | ||||
| 53 | Melanoma | Imatinib | KIT | m1B | 2 | MR | Palbociclib | 274 | |||
| 54 | Cancer of unknown primary | Capecitabine + Binimetinib | NRAS | m1B | 0 | 179 | |||||
| 55 | Prostate cancer | Niraparib + Abiraterone | CHEK2 | m1B | 3 | PD | 335 | 0 | |||
| 56 | Cancer of unknown primary | Trastuzumab Deruxtecan |
| m2B Z is(IHC) | 1 | PR | 463 | ||||
| 57 | Breast cancer | Trastuzumab + Pertuzumab + Paclitaxel |
| N/A | 6 | 46 | |||||
| 58 | CCA | Pemigatinib | FGFR2–AHCYL1 fusion | m1A Z | 1 | 179 | |||||
| 59 | Colorectal cancer | Atezolizumab + Pertuzumab + Trastuzumab |
| m1A | 2 | 105 | |||||
| 60 | Breast cancer | Trastuzumab Deruxtecan |
| m1B | 4 | 45 | |||||
| 61 | Ovarian cancer | Everolimus + Bevacizumab | PIK3CA | N/A | 5 | PD | 30 | 652 | 0.046 | ||
| 62 | CCA | Olaparib | BAP1 | m1C | 181 | 0 | |||||
| 63 | Non-small cell lung cancer | Lorlatinib | EZR–ROS1 fusion | m1A | 3 | 23 | |||||
| 64 | Pancreatic cancer | Trastuzumab Deruxtecan |
| m1C/m2B | 6 | PD | 30 | 96 | 0.313 | ||
| 65 | Others | Androgen deprivation therapy (ADT) | AR | m1A | CR | Hyperglycemic decompensation, edema, hot flashes, pruritus, depressive mood, reduced strength | 91 | 87 | 1.046 | ||
| 66 | Bladder cancer | Brimigimadlin (Brightline trial, LMU) | MDM2 CNV | N/A | 2 | PD | Everolismus + Pazopanib | 153 | |||
| 67 | CCA | Futibatinib + Pemigatinib | COL25A1–FGFR2 fusion | m1A Z | 2 | MR | 150 | ||||
| 68 | Ovarian cancer | Trastuzumab Deruxtecan |
| m2A Z is | 6 | 183 | |||||
| 69 | Breast cancer | Elacestrant | ESR1 | m1A Z | 5 | PD | Trastuzumab Deruxtecan | 51 | |||
| 70 | Non-small cell lung cancer | Lorlatinib | CD74–ROS1 fusion | m1A | 1 | PR | 294 | 91 | 3.231 | ||
| 71 | Thyroid cancer | Dabrafenib | BRAF | m1A | 3 | PD | 68 | ||||
| 72 | Breast cancer | Olaparib | BRCA1 | m1A | PR | 81 | |||||
| 73 | Pancreatic cancer | Palbociclib + Trametinib | CDKN2A; KRAS | m1C | 2 | PD | 92 | ||||
| 74 | Ovarian cancer | BNT21-01 trial | CLDN6 | N/A | 4 | PD | 92 | 139 | 0.662 | ||
| 75 | Cancer of unknown primary | Olaparib |
| m2A Z | 1 | PD | 407 | ||||
| 76 | Bowel cancer | Enfortumab Vedotin |
| m2C | 3 | 189 | 141 | 1.34 | |||
| 77 | CCA | Ivosidenib | IDH1 | m1A Z | 2 | SD | 447 | ||||
| 78 | Salivary gland cancer | Trastuzumab Deruxtecan |
| m1C Z | 1 | ||||||
| 79 | Others | Pembrolizumab |
| m1A | 3 | 72 | |||||
| 80 | Breast cancer | Talazoparib | BRCA1; | m1A | 1 | ||||||
| 81 | Others | Ponatinib | KIT | m3 | 5 | MR | 124 | ||||
| 82 | Melanoma | Immune checkpoint inhibitor |
| m1A Z | SD | 482 | |||||
| 83 | Cancer of unknown primary | Alectinib | LASP–ALK fusion | m1C-m2A | 2 | PR | 171 | ||||
| 84 | Colorectal cancer | Trastuzumab + Pertuzumab |
| m1A | 4 | SD | 86 | ||||
| 85 | Non-small cell lung cancer | Afatinib | EGFR | m1C | PR | ||||||
| 86 | Cancer of unknown primary | Erlotinib | EGFR | m2B | 23 | ||||||
| 87 | Others | Anastrozole | ER | m1C is | 1 | PD | 191 | ||||
| 88 | Non-small cell lung cancer | Immune checkpoint inhibitor |
| m1C | 1 | 0 | |||||
| 89 | Thyroid cancer | Pembrolizumab + Lenvatinib |
| m1B | 1 | MR | Colitis, suspected nephritis | 79 | |||
| 90 | CCA | Futibatinib | FGFR2 | m1A Z | 2 | PR | 255 | ||||
| 91 | Breast cancer | Trastuzumab Deruxtecan |
| m1A Z is | 4 | SD | 257 | ||||
| 92 | CCA | Futibatinib | FGFR2 | m1A Z | 1 | MR | 204 | ||||
| 93 | Penile cancer | Immune checkpoint inhibitor |
| N/A | 1 | PD | 69 | 60 | 1.15 | ||
| 94 | Breast cancer | Trastuzumab Deruxtecan |
| m1A Z EMA | 12 | SD | 43 | ||||
| 95 | Cancer of unknown primary | Pembrolizumab |
| m2A Z | Autoimmune nephritis | ||||||
| 96 | Esophagogastric cancer | Zolbetuximab |
| m1A Z is | 1 | PR | 112 | ||||
| 97 | Colorectal cancer | Adagrasib + Cetuximab | KRAS | m1A | 10 | MR | 216 | ||||
| 98 | Others | Binimetinib followed by Cobimetinib | BRAF | m1C | SD | 181 | |||||
| 99 | Salivary gland cancer | Goserelin + Bicalutamide | AR | m1B | PD | Enfortumab-Vedotin | 83 | ||||
| 100 | Non-small cell lung cancer | Carboplatin + Pemetrexed | KRAS | m1B | 417 | 763 | 0.547 |
- —BZKF
- —Universitätsklinikum Regensburg (8921)
Peer Reviews
No public reviews on file for this paper yet. If you reviewed it on a platform where reviews are public (OpenReview, ICLR, NeurIPS, ICML), you can paste yours below so the community can read it here.
Videos
No videos yet. Explain this paper in a talk, walkthrough, or lecture? Add one.
Taxonomy
TopicsPARP inhibition in cancer therapy · HER2/EGFR in Cancer Research · Advanced Breast Cancer Therapies
Background
Precision oncology, the tailored application of therapeutic strategies based on molecular and genetic profiling, has revolutionized cancer treatment [1]. Molecular tumor boards (MTBs) are central to this approach, providing a multidisciplinary framework for the integration of genomic, sometimes transcriptomic, and immunohistochemical data to guide individualized therapy decisions [2]. While conventional genetic panel diagnostics have become the cornerstone of MTB decision-making, the addition of supplementary diagnostic methods holds the potential to further enhance the utility of MTBs beyond the upcoming integration of exome and whole-genome sequencing.
BRCA1/2 mutations and homologous recombination deficiency (HRD), for example, is a well-established bio-marker for the application of PARP inhibitors in ovarian [3] and breast cancer [4]; however, its utility in other malignancies is less defined, as is the relevance of mutations in other homologous recombination repair (HRR) genes such as PALB2, etc. Similarly, the advent of antibody–drug conjugates (ADCs) has introduced a new dimension to precision oncology, with bio-markers such as Trop-2, Nectin-4, and FRα showing promise across an increasing varity of tumor types [5–8]. Furthermore, the assessment of microsatellite instability (MSI) through PCR-based methods and IHC for mismatch repair (MMR) proteins represent key approaches to identification of potential candidates for immune checkpoint inhibitors (ICI), particularly in gastrointestinal and endometrial cancers [9]. However, the reliability of MSI scores obtained from sequencing panels, particularly regarding the definition of cut-off values, remains a topic of active discussion [10]. Another well-recognized bio-marker for immuno-oncological therapies is PD-L1, which has proven its utility in various cancer types [11–13] which was consequently also integrated into our diagnostic workflow.
Moreover, HER2 expression, evaluated via IHC and FISH, has expanded beyond HER2-positive, i.e., HER2-amplified tumors to include HER2-low as a relevant subgroup. The introduction of Trastuzumab Deruxtecan (T-DXd) has shown efficacy in HER2-low breast cancer [14], with emerging data suggesting potential benefits in other malignancies [15].
Studies evaluating the impact of supplemental diagnostics in the MTB setting are scarce [16, 17]. While the incorporation of biomarkers such as HRD analysis and ADC-specific IHC into MTBs seams promising, their incremental value in expanding actionable findings and influencing clinical recommendations has yet to be comprehensively evaluated.
To address this question, we conducted an extensive analysis of 658 patients presented at our institutional MTB from January 2022 to November 2024, focusing on the incorporation of supplemental diagnostic modalities alongside standard panel sequencing. The study aimed to evaluate whether incorporating HRD analysis, HER2 IHC and FISH, ADC IHC, MSI-PCR, and PD-L1 IHC would improve the number and quality of actionable recommendations. Additionally, the study sought to assess the feasibility of integrating these diagnostics into routine MTB workflows. Feasibility was assessed in terms of the proportion of patients for whom these assays generated additional recommendations, the rate of implementation of such recommendations in clinical practice, and the associated patient outcomes.
Methods
Study design and patient population
This prospective registry study was conducted at the University Hospital Regensburg under the approval of the institutional ethics committee (Protocol Number: 20–1682-101). Patient recruitment began in 2019, with the current evaluation focusing on patients included between 2022 and 2024. The earlier cohort (2019–2021) has already been reported previously [17], and the present study was resticted to 2022–2024 because supplementary biomarker testing was systematically implemented into the MTB workflow only from 2022 onwards. The study targeted individuals with advanced malignancies meeting specific inclusion criteria. These criteria included (1) exhaustion or near exhaustion of guideline-based therapies, (2) initiation of the last line of therapy with limited expected efficacy, (3) rare tumor entities without standard-of-care treatment options, and (4) sufficient life expectancy, estimated at a minimum of 6 months, to enable sufficient time for molecular testing and individual treatment authorization processes.
Patients also needed to provide informed consent, have tissue or DNA samples readily available for analysis, and demonstrate openness to experimental and off-label therapies, which was checked during pre-MTB counseling by the treating physician and recorded in the MTB case form as part of the inclusion process. Procedural requirements included written consent, referral from the organ-specific tumor board for extended molecular analysis, a comprehensive medical record for therapy documentation, and an assessment of the defined inclusion criteria.
Molecular findings were first reported to the treating physician as molecular pathology report without therapeutic interpretation. Prior to the MTB, alterations were jointly annotated by pathologists and clinicians based on literature review from our institutional database. The annotated reports were then shared with the treating physicians, particularly with designated ‘bridgeheads’ responsible for preparing and presenting cases at the MTB.
The MTB convened weekly and involved a core team composed of a clinical geneticist, pathologist, medical oncologist, molecular pathologist/biologist, and a rotating affiliated clinician collaboratively evaluating the cases. The Centers of Personalized Medicine (ZPM) scheme was used to assign evidence levels [18], which is based on the MD Anderson Cancer Center classification and stratifies biomarkers according to their level of clinical and scientific validation. Tier m1 and m2 categorize biomarkers based on clinical evidence within the same tumor type (m1) or a different tumor type (m2), ranging from prospective studies (A), retrospective studies (B), and case reports (C). Tier m3 and m4 refer to preclinical evidence (m3) and theoretical biological rationale (m4) without supporting biomarker-stratified clinical data. Initially, the m4 rating was only occasionally assigned. Through the subsequent clinical reassessment, cases with with a clear underlying biological rationale for treatment recommendations were assigned this category retrospectively, including recommendations of clinical trials with an underlying biomarker dependency. Recommendations for genetic counseling were made based on the evaluation of the molecular test results by a geneticist. Exceptions to this workflow were predominantly lung cancer cases, where routine in-house panel diagnostics had yielded uncommon or ambiguous alterations. For these “consult” cases only ADC-IHC was supplemented to the already available panel diagnostics. Moreover, within the period of evaluation, cholangiocarcinoma (CCA) obtained several newly approved and molecularly guided treatment options, such as the use of FGFR inhibitors based on FGFR2-fusions [19]. Nonetheless, CCA patients were continuously enrolled directly with the start of first-line therapies to allow for a cost-efficient testing without the need for repeated genetic evaluations in due course. Moreover, the recently updated German guidelines reinforce the strategy of early referral of CCA patients to the MTB after failure of first-line therapy [20].
Analysis methods by tumor entities
The standard analytical framework included the TruSight Oncology 500® panel (TSO500®; Illumina Inc., San Diego, CA, USA), whose diagnostic reliability in clinical practice has just recently been confirmed [21], PD-L1 IHC, MMR protein analysis via IHC for PMS2 and MSH6 (we shifted from an initial assessment of MSH2, MSH6, PMS2, and MLH1 to only these two markers out of economic considerations). HER2 diagnostics using IHC, supplemented by fluorescence in situ hybridization (FISH) when necessary, were also standard. Generally, the Rüschoff score was used in analogy to gastric cancer [22]. Cases with a score of 2 + were sent for FISH analysis taking into consideration that other entities have a less established diagnostic framework for HER2 IHC diagnostics.
For certain tumor entities, additional assays were incorporated, such as ADC-targeted IHCs introduced in early 2024 and HRD assessments. Before 2024, these supplementary parameters were not routinely evaluated. An overview of the standard allocation of diagnostics by entity in our MTB is presented in Additional file 1: Table S1. All additional biomarkers beyond mutation and gene fusion analysis by targeted DNA/RNA-NGS were considered as “supplementary” diagnostics.
Clinical reassessments
Patient data and therapeutic recommendations were systematically documented in standardized MTB case documents. We extracted data from these documents using a custom Python script, incorporating various modules for processing. Different data tables (e.g., mutations, fusions, PD-L1) were identified, structured, and stored in an SQLite database (Hipp, Wyrick & Company, Inc., Charlotte, North Carolina, USA), requiring adaptations for consistent parsing. Free text outside tables was generally ignored, except for specific cases such as searching for references to genetic counseling in recommendation texts. Implementations of recommendations was determined through systematic review of follow-up documentation, including treatment protocols, discharge letters, and physician notes. Only therapies that could be clearly matched to the MTB recommentation were classified as implemented. In cases where no matching therapy was documented, recommendations were considered not implemented. Clinical follow-up data were collected at 1, 3, 6, 12, 18, and 24 months post-therapy by sending standardized follow-up documentation files to the treating physicians. Challenges in follow-up compliance led to supplementary approaches, including contacting patients, physicians, and local cancer registries, and reviewing publicly available death notices. For survival analysis, censoring was applied at the last documented contact date if no subsequent data were available. The final data cut-off was August 16, 2025.
Therapeutic responses were categorized based on clinical and radiological assessments as progressive disease (PD), stable disease (SD), partial response (PR), mixed response (MR), or complete response (CR). Progression-free survival (PFS) was defined as the time from treatment initiation to disease progression. Progression events were determined based on radiological criteria. If no progression event was recorded, the end of therapy or the end of the observation period was considered a censored event. PFS was calculated for both pre- and post-MTB therapy lines, with intra-patient benefit assessed by PFS ratio (PFS2/PFS1), where values above 1.3 were considered indicative of therapeutic benefit [23].
For comparison purposes, we also analyzed treatments implemented after the molecular tumor board, which do not represent targeted therapies and were independent of MTB recommendations with the same methodology as we analyzed MTB therapies. This group is referred to as Non-MTB therapy group and comprises patients irrespective of given MTB recommendations. In addition, we defined a no additional therapy cohort comprising patients who, following MTB discussion, either continued their existing treatment without modification or received no subsequent systemic therapy. This group again includes both patients with and without MTB recommendations. PFS could not be assessed in patients who did not receive further systemic therapy, as disease progression was not systematically evaluated in this group.
HRD analyses
HRD assessments were performed using two distinct panels: the TSO-500 with integrated HRD analysis (Illumina, cut-off for positivity: GIS ≥ 42), which has proven concordance with the FDA-approved companion diagnostics MyChoice®CDx PLUS assay (Myriad assay) [24, 25], and the QIAseq Targeted DNA Custom Panel (96) (QIAGEN N.V., Venlo, Netherlands, cut-off for positivity: GIS ≥ 56). The TSO-500 HRD panel was generally preferred, while the Qiagen panel was employed for cases with prior TSO-500 analysis lacking HRD evaluation or when HRD analysis hat already been performed in consiliary cases.
ADC IHC
ADC-related IHC analyses included the markers Nectin-4, Trop-2, Tissue Factor (TF), FRα, and Claudin18.2. It should be noted that the drug Zolbetuximab targeting Claudin18.2 is not an ADC by definition. Instead, it elicits antibody-dependent cell- and complement-dependent cytotoxicity to eliminate cancer cells [26]. Nonetheless, it is subsumed as ADC in this publication. The IHC assessment of the abovementioned targets was implemented starting in 2024 and adhered to the H-score [27], which quantifies the staining intensity (0, 1 + , 2 + , or 3 +) of positive tumor cells as a percentage of the total tumor cell count. The H-score ranges from 0 (all tumor cells negative) to 300 (all tumor cells strongly positive). Examples of H-Score assessments for various ADC antibodies are presented in Additional file 1: Fig. S1_1 and Fig. S1_2. At least one board-certified pathologist reviewed each sample, utilizing standardized positive controls. Additional file 1: Table S2 lists the antibodies and technical parameters. Until August 2024, the FRα antibody clone from Novocastra was used; thereafter, the one from Ventana was adopted.
The choice of ADC-IHC was based on the following detailed rationale: TROP-2 is frequently expressed in urothelial carcinoma and breast cancer, particularly in triple-negative breast cancer (TNBC) [28]. In the ASCENT study, a biomarker analysis of TROP-2 was conducted [29]. Here, 80% of patients with metastatic TNBC had high or medium TROP-2 expression. In this subgroup, Sacituzumab Govitecan showed improved survival outcomes and response rates compared to treatment of physician’s choice. Due to the small number of patients with low TROP-2 expression, no definitive conclusions could be drawn, though a trend toward lower response rates and overall survival was observed.
Regarding urothelial carcinoma, in cohorts 1–3 of the Phase II TROPHY-U-01 study (mUC after platinum-based chemotherapy and checkpoint inhibitors), tumor samples were collected from 192 patients, and evaluable TROP-2 data were available for 146 patients (76%). The median H-score was 215 (scale 0–300), with a median percentage of membrane-stained cells of 91% (range 80–98%). TROP-2 was expressed in 98% of patients, and SG demonstrated efficacy across all levels of expression—objective response rate (ORR), progression-free survival (PFS), and overall survival (OS) were similar across the cohort [30, 31]. In summary SG showed somewhat reduced activity in low TROP-2-expressing TNBC, while efficacy in urothelial carcinoma was similar across all expression groups. At present, TROP-2 is not yet a validated predictive biomarker. Nevertheless, we have chosen to assess TROP-2 expression in certain tumor entities, such as breast cancer, urothelial carcinoma, and cancer of unknown primary (CUP), in order to evaluate whether expression levels are indeed as high as reported in clinical trials.
In the Phase I trial of enfortumab vedotin (EV) in urothelial carcinoma, evaluation of Nectin-4 expression by immunohistochemistry (IHC) was initially required for enrollment. For each patient, Nectin-4 expression was quantified using a histochemical scoring system based on staining intensity multiplied by the percentage of positively stained cells (H-score, range 0–300). Nectin-4 was detected in 97% of patients, with a median H-score of 290 (range 14–300). Due to the consistently high expression, positive Nectin-4 testing was later removed as an eligibility criterion [32].
In a larger retrospective study involving 137 matched primary tumor-metastasis pairs and a separate EV-treated cohort, it was shown that Nectin-4 expression frequently decreased in metastases—in 39% of metastases, expression was absent or markedly reduced. Weak or absent membranous expression (H-score 0–99) was associated with shorter PFS following EV treatment (log-rank p < 0.001). The authors concluded that low or absent expression may predict resistance to EV, supporting the strategy of biopsying metastases and testing for Nectin-4 expression before initiating EV therapy [33]. High Nectin-4 expression has also been described in other entities such as lung cancer and squamous cell carcinomas, which is why we tested these entities alongside CUP.
Tissue factor (TF) is also expressed in a range of tumor types, including cervical cancer, non-small cell lung cancer (NSCLC), and head and neck squamous cell carcinoma (HNSCC). Tisotumab Vedotin, an antibody–drug conjugate targeting TF, was approved based on the results of the randomized Phase III innovaTV 301 study (NCT04697628) in metastatic cervical cancer [34]. Unfortunately, no biomarker analyses were published for this study. However, a generally high TF expression is assumed for this tumor entity. Given the limited available data, we decided to restrict TF testing to squamous cell carcinomas of the head and neck.
Statistical analyses and software
Descriptive statistics were conducted using Microsoft Excel (Version 16, Microsoft Corporation, Redmond, WA). GraphPad Prism version 9 (Graphpad Software, LLC, San Diego, CA, USA) was utilized for survival analyses. Kaplan–Meier curves and Log-rank tests were used to compare OS between the groups with no therapy and MTB therapy.
Genomic, FISH, MSI, and general IHC protocol
The exact procedure for genomic analyses, PCR fragment sizing MSI analysis, FISH, and the general IHC procedure including HER2-IHC (while the specifical parameters for ADC-IHC are reported here) has been published previously by us and was continuously used in an unaltered manner [17]. MSI testing was defined as MMR IHC and/or MSI PCR.
MSI status was assessed using the Illumina TruSight Oncology 500 (TSO500) panel. A cutoff of ≥ 10% unstable loci was applied, reflecting established consensus among German molecular pathology expert groups for this assay. Although this specific threshold has not yet been formally published, it has been validated in our laboratory through benchmarking and inter-laboratory exchange. This threshold has also been employed by Pestinger et al. [35]. To ensure accuracy, all cases with ≥ 10% unstable loci also underwent PCR and fragment-length analysis, which served as the gold standard for final MSI classification. This approach was chosen to maximize sensitivity and to avoid missing borderline cases, for example in samples with low tumor cell content. Recommendations were never made on TSO500 MSI analysis alone, but had to be confirmed by either MMR IHC or PCR and fragment-length analysis (when normal tissue was available for comparison).
In rare instances, androgen receptor or estrogen receptor IHC was carried out and used as rationale for therapy recommendation.
Results
Patient population and molecular genetic analyses (Fig. 1, Table 1)
Study overview and supplementary analyses. The flow chart illustrates the diagnostic workflow focusing on supplementary diagnostics alongside the panel diagnostics, as well as the resulting recommendations and their clinical follow-up. Percentages in the flow chart are relative to the previous hierarchical level. The included bar chart (top) illustrates the number of recommendations provided for each diagnostic category. The stacked bar plot (bottom) depicts the distribution of evidence levels (m1A–m4) across different supplementary diagnostic parameters. One hundred eighty-two patients received therapy recommendations based on the defined supplementary diagnostic methods, while the remainder of patients (147) had recommendations derived only from next-generation sequencing analyses (with rare exceptions of androgen receptor and estrogen receptor immunohistochemistry)
We first describe the study cohort and the scope of molecular and supplementary diagnostics performed. Of the 820 patients initially discussed at our MTB between 2022 and 2024, 100 did not provide research consent and 62 were excluded as part of a separately analyzed sarcoma cohort, leaving 658 patients for inclusion in this study.
The overall study cohort had a median age of 60.0 years (SD ± 13.2), while the MTB-guided therapy subgroup exhibiting a slightly lower median age of 58.3 years (SD ± 12.9). Men comprised 59.1% (n = 389) of the cohort. ECOG performance status was reported for 370 patients (56.2%), with most having an ECOG score of 0 (46%) or 1 (41.9%). Among all groups, cancers included were primarily of advanced stage (UICC IV, ~ 90%), while only occasionally lower stage cancers were admitted to the MTB.
Comprehensive molecular diagnostics were performed using targeted sequencing panels in 646 cases (TSO 500: n = 631; NNGM v2 and v3.2: n = 13) and a fusion panel in two cases (Archer FusionPlex Lung V2). In the remaining 12 cases, sequencing was not conducted for various reasons, including insufficient tumor tissue or an unexpected clinical deterioration of the patient, leading to a transition to best supportive care (BSC).TMB assessment by NGS was available for 577 patients, HRD testing was performed in 137 cases, ADC IHC in 163, PD-L1 status in 515, and HER2 IHC in 612, with 52 cases undergoing an additional FISH analysis. Microsatellite instability (MSI) testing by PCR was performed in 415 cases, and MMR protein IHC in 589.
To characterize the tissue used for biomarker analyses, we assessed the tissue and sample types employed for both IHC and next-generation sequencing (Additional file 1: Fig. S2). The majority of samples were biopsies (n = 380), followed by resection specimens (n = 221). In a few instances, cytological samples (n = 4) or liquid biopsies (n = 3) were used for molecular analysis. Regarding tumor origin, the most frequent sample type was distant metastasis (n = 262), closely followed by primary tumors (n = 248). Additional samples included lymph node metastases (n = 44), local recurrences (n = 43), and in rare cases, blood samples. In general, we aimed to analyze tissue that was less than 6 months old. Nevertheless, exceptions were made in cases where obtaining fresh or repeat biopsies would have posed a significant risk to the patient. In such situations, older tissue was used (median sample age: 103 days).
Actionable targets that could be identified varied across different diagnostic approaches, with ADC-IHC leading to 20 recommendations (of 163 analyses; 12.3%), HRD analyses to 15 (of 137 analyses; 10.9%), MSI testing to 9 (of 600 analyses, 1.5%), TMB assessment to 24 (of 577 analyses; 4.2%), and PD-L1 expression analysis to 39 (of 515 analyses; 7.6%). HER2 IHC resulted in 75 actionable recommendations (of 612 analyses; 12.3%), of which 19 were based on HER2-amplified and 56 on HER2-low status. The evidence supporting these recommendations varied, with ADC-IHC findings predominantly based on m1A (35%) and m4 (40%) evidence. The evidence was unevenly distributed between the different ADC targets. Claudin 18.2, for instance, achieved m1A-level evidence in 80% (4/5 cases with recommendation) of cases, whereas TF and Trop-2 recommendations were only supported by m4-level evidence. HRD recommendations were largely supported by m2A (53.3%), based on evidence primarily derived from breast and ovarian cancer, while MSI findings had strong tumor-specific evidence, with 44.4% classified as m1A. TMB-based recommendations were distributed across m1C (29.2%) and m2A (33.3%), whereas PD-L1-derived recommendations were most frequently supported by m1A (28.2%), m1B (25.6%) and m2A (20.5%) evidence. Recommendations based on HER2-amplified cases were mainly m1A (42.1%) and m1B (36.8%), while the strength of HER2-low recommendations was more diverse, with m1B (37.5%) and m2A (33.9%) being most common.
From the overall cohort (658 patients), 329 patients (50.0%) received a therapy recommendation based on molecular and additional biomarker results. In 329 patients, no therapy recommendation was issued. The predominant reason was the absence of actionable molecular alterations or prior administration of targeted therapies addressing the identified alterations. In a subset of patients, clinical deterioration, comorbidities limiting treatment options, or patient preference precluded further therapeutic intervention. A total of 182 patients received therapy recommendations based on the defined supplementary diagnostics, while 147 patients received recommendations derived from next-generation sequencing results alone. One hundred patients (30.4%) received MTB-guided therapies. Documented outcomes were available for 64 patients (64%).
Recommendations across tumor entities and underlying alterations
Next, we report the distribution of recommendations across tumor entities (Additional file 1: Fig. S3). The proportion of cases receiving MTB-guided therapy recommendations varied across tumor entities, reflecting differences in the suitability of molecular diagnostics. CCA (n = 120) exhibited a recommendation rate of 56.7%, supported by both tumor-specific and cross-entity biomarker-stratified evidence. Breast cancer (n = 35) demonstrated the highest recommendation rate among the 5 most prevalent entities at 77.1%. In contrast, colorectal cancer (CRC) (n = 78) had a markedly lower recommendation rate of 23.1%. Pancreatic cancer (n = 56) and prostate cancer (n = 38) also showed comparatively low recommendation rates (28.6% and 36.8%), due to limited high-evidence biomarkers or available targeted therapies.
Apart from the most prevalent entities, some cancers exhibited particularly high recommendation rates. Thyroid cancer received MTB-guided therapy recommendations in 100% of cases (4/4) as a consequence of the high prevalence of PD-L1 expression. Cervical cancer (3/4, 75%), bladder cancer (19/28, 67.9%), and salivary gland cancer (10/15, 66.7%) also demonstrated a strong alignment between molecular diagnostics and actionable findings.
The distribution of evidence levels further reflected variation between entities. Breast and bladder cancer recommendations were predominantly supported by high-evidence biomarkers (m1A and m1B). Thyroid cancer relied heavily on m1B evidence (83.3%). In contrast, pancreatic cancer and cancer of unknown primary (CUP) depended largely on cross-entity evidence (m2A and m2C).
Differences between the tumor entities were also noted regarding the number of recommendations per case. Salivary gland cancer (80%) and CRC (72.2%) frequently yielded multiple actionable targets. Breast cancer also showed a high proportion of multiple recommendations (59.3%), consistent with its strong molecular subtyping. Conversely, renal cell carcinoma and small bowel cancer exclusively received single recommendations.
Overall, this analysis highlights the strong suitability of molecular diagnostics for CCA, breast cancer, thyroid cancer, and bladder cancer due to their high recommendation rates and robust supporting evidence. Conversely, entities such as pancreatic cancer and CRC may benefit from a different and expanded molecular testing approach, to identify candidates for targeted therapy.
Next, we analyzed the genetic alterations underlying treatment recommendations (Additional file 1: Fig. S4). KRAS and BRAF alterations supported 23 therapy recommendations each (8.3% each). BRAF alterations underlying recommendations included 16 mutations and 7 fusions, whereas KRAS changes were exclusively mutations. PIK3CA mutations were associated with 17 recommendations (6.1%), followed by FGFR2 alterations with 16 (11 fusions, 4 mutations, and 1 combined alteration, 5.8%). EGFR alterations led to a recommendation in 13 cases (11 mutations, 2 amplifications, 4.7%), along with MET (11 amplifications, 1 fusion, 1 combination, 4.7%). ALK alterations were the basis of 12 recommendations (3 fusions, 9 mutations, 4.3%), matching the amount of recommendations based on IDH1 mutations (12, 4.3%).
In CCA, KRAS mutations were the most frequent alterations underlying treatment recommendations (19 recommendations, 28.4%), followed by FGFR2 (15 recommendations, 22.4%, predominantly fusions), IDH1 (9 recommendations, 13.4%), and BAP1 (5 recommendations, 7.5%). Among non-small cell lung cancer (NSCLC) cases, ALK and BRAF to 4 (12.1%), while ROS1 alterations (2 fusions, 1 combination of alterations, 9.1%) were less common. In breast cancer, actionable alterations included PIK3CA (4 recommendations, 19.0%), ESR1 (3 recommendations, 14.3%), PTEN (3 recommendations, 14.3%), as well as BRCA1, PALB2, and FGFR1 (all mutations except one FGFR1 fusion) with 1 recommendation (4.8%) each. Five cases involved recommendations based on individual combinations of biomarkers (23.8%). In CRC, the most frequently detected alterations used as basis for therapeutic recommendation were BRAF (4 recommendations, 28.6%), PIK3CA (4 recommendations, 28.6%), and KRAS (3 recommendations, 21.4%) mutations.
As expected, CUP exhibited a diverse recommendation profile, with ALK fusions (3 recommendations, 17.6%) and combination-based targets (3 recommendations, 17.6%) being the most common. Single cases with actionable mutations included AKT1, ATM, BRAF, BRCA2, EGFR, and NRAS, as well as FGFR3 fusion and a VHL (5.9% each) mutation.
Detailed evaluation of HER2 low and amplification status (Fig. 2)
Supplementary diagnostics: HER2. a Distribution of HER2 status across various tumor types. Cases are classified as amplified, low expression, and negative. Tumor types are ranked by frequency of HER2 alterations. Scores are indicated as either DAKO-score (breast cancer) or Rüschoff-Score (other entities). b Comparison of recommendations based on low versus high HER2 expression levels across different tumor types. c The contingency table illustrates HER2-positive and HER2-negative cases based on two independent diagnostic methods (CNV analysis and HER2 IHC + FISH). Sensitivity, specificity, positive predictive value (PPV), and negative predictive value (NPV) are provided
The distribution of HER2 expression varied across different tumor types. In CCA, 55 out of 118 (46.6%) cases were HER2-negative, 61 (51.7%) were classified as HER2-low, and 2 (1.7%) showed amplification. A similar pattern was observed in CRC, with 33 out of 73 (45.2%) cases classified as HER2-negative, 35 (47.9%) as HER2-low, and 5 (of 73, 6.8%) as amplified. In contrast, CUP had a higher proportion of HER2-negative cases (33 of 44, 75%). In breast cancer, 12 out of 33 (36.4%) cases were HER2-negative, 19 (57.6%) were HER2-low, and 1 (6.1%) exhibited amplification. Ovarian cancer had the highest proportion of HER2-low status, observed in 12 out of 18 cases (66.7%). At the same time, it had the lowest HER2-negative rate, with only 5 out of 18 cases (27.8%) classified as negative.
Among HER2-based recommendations, HER2-low status was the primary underlying alteration in CCA (11/12 recommendations, 91.7%), breast cancer (11/13 recommendations, 84.6%), and prostate cancer (7/7 recommendations, 100%). In contrast, CRC recommendations were exclusively based on HER2 amplification (5/5 recommendations). Esophagogastric and bladder cancers had recommendations based on HER2-low status in 66.7% and 57.1% of cases, respectively.
When comparing HER2 (ERBB2) copy number variation (CNV) detected by sequencing (a CNV ERBB2 value of ≥ 2 was considered positive) with IHC/FISH results, sequencing demonstrated high specificity (99.2%) but only moderate sensitivity (60%) as well as high positive (85.7%) and negative (96.9%) predictive values. This indicates that CNV assessment is reliable for ruling out HER2 positivity but may miss some amplified cases, probably due to focal amplification or technical limitations due to insufficient tumor cell content. The high positive (85.7%) and negative (96.9%) predictive values confirm that most amplified CNVs correspond to true HER2-positive cases. Given the limited sensitivity of sequencing, IHC and FISH remain essential for accurately classifying HER2 status, particularly in cases where CNV results are inconclusive, sequencing quality is suboptimal or tumor cell content is low. Integrating these methods ensures a comprehensive assessment and supports correct treatment selection.
Assessing ADC-IHC diagnostics in the MTB framework (Fig. 3)
Supplementary diagnostics: ADC-IHC. The graph shows the number of ADC IHC assessments conducted for individual targets. The proportion of recommendations based on each marker is highlighted in purple. In the upper part, the corresponding H-scores (ranging from 0 to 300) are plotted. The color of the data points represents different tumor entities
The evaluation of ADC-IHC testing revealed significant differences in therapy recommendation rates across biomarkers. Claudin-18.2-targeted therapy (Zolbetuximab) had the highest recommendation rate (5/8 tested cancers, 62.5%), followed by c-Met-targeted therapy (Telisotuzumab-vedotin) (3/9 tested cancers, 33.3%), TF-directed therapy (Tisotumab-vedotin) (4/19 tested cancers, 21.1%), FRα-based therapy (Mirvetuximab-soravtansine) (1/11 tested cancers, 9.1%), Nectin-4-directed therapy (Enfortumab-vedotin) (5/63 tested cancers, 7.9%), and Trop-2-based therapy (Sacituzumab-govitecan) (2/49 tested cancers, 4.1%). Claudin-18.2-directed therapy was predominantly recommended in esophagogastric cancer (4/5, 80%), while TF-based therapy was primarily considered for cervical cancer (2/4, 50% of recommendations). FRα testing was limited to ovarian cancer by preset testing criteria. Nectin-4- and Trop-2-targeted therapies were recommended across different tumor types, but without a clear trend. c-Met-directed therapy, tested only in NSCLC, showed a moderate recommendation rate (33.3%).
Higher H-scores were typically associated with ADC therapy recommendations, particularly for Claudin-18.2, where 4/5 cases with recommendations had an H-score of 300, and one had 160. In contrast, one tumor with low expression (H-score 100) was not given a recommendation. FRα-targeted therapy was only recommended for a single case of ovarian cancer with an H-score of 245, while lower-expressing tumors (H-score 0–70) did not receive recommendations for Mirvetuximab-soravtansine. Nectin-4- and Trop-2-based therapies followed similar trends, with recommendations at H-scores ≥ 190. c-Met-targeted therapy was consistently recommended for NSCLC with H-scores of 260–300. TF-based therapy was recommended for tumors with H-scores 205–300, though one tumor with H-score 280 did not receive recommendations.
Evaluation of the metagenomic parameter HRD (Fig. 4)
Supplementary diagnostics: HRD. This Oncoprint visualization presents all conducted HRD assessments, ranked according to their HRD status. HRD-positive cases are displayed on the left, while HRD-negative cases are positioned on the right. Two distinct testing methods were applied: TSO 500 (blue) and QIA (red). Additionally, the tumor entity and the resulting molecular tumor board (MTB) recommendations are depicted. The lower section illustrates the corresponding genetic alterations in key homologous recombination repair (HRR) genes, highlighting relevant genomic variations associated with HRD status
HRD testing revealed significant variability across tumor types. Using the TSO500-HRD (GIS ≥ 42) and Qiaseq Targeted DNA IO (GIS ≥ 56) panels, HRD positivity was highest in CRC at 50% (1 of 2 tested, limited interpretability), followed by ovarian cancer at 40% (4 of 10 tested) and breast cancer at 38% (8 of 21 tested). Prostate cancer and salivary gland cancer both exhibited HRD positivity rates of 16.7% (2 of 12 prostate cancers were positive, and 1 of 6 salivary gland cancers was positive).
Among frequently tested entities, CCA (n = 39) and pancreatic cancer (n = 14) showed low (1/39 CCA, 2.6%) to none (0/14 pancreatic cancers) HRD-positive cases. Rarely tested cancers, such as head and neck (n = 2), small bowel (n = 1), bowl (n = 1), HCC (n = 1), and SCLC (n = 1), also showed no HRD positivity.
HRR gene mutations were sometimes associated with HRD, particularly BRCA1/2 in ovarian and breast cancers. A case of ovarian cancer with a BRCA2 truncating mutation (GIS 45, TSO500) and a case of breast cancer with a BRCA1 fusion (GIS 104, Qiaseq) were HRD-positive. However, a case of CUP with a pathogenic BRCA2 S1970* truncation mutation was HRD-negative (GIS 25, TSO500), which we hypothesized to be possibly due to monoallelic occurrence.
Another HRR gene, PALB2, exhibited variable HRD scores in two cases. One case (prostate cancer, GI score TSO500: 43) received a recommendation based on its HRD status, whereas the other (salivary gland cancer, GI score TSO500: 7) did not receive a recommendation taking into account its negative HRD-status.
Other HRR genes, including ARID1A (n = 8), ATM (n = 6), BAP1 (n = 5), BARD1 (n = 1), BLM (n = 1), FANCC (n = 1) FANCL (n = 1), NBN (n = 1), and RAD50 (n = 1) showed consitently negative HRD association.
Assessment of MMR-IHC, MSI-PCR and TMB (Fig. 5a + b)
Supplementary diagnostics: MSI-High, MMRd, TMB-High, and PD-L1. a Illustrates the results of supplementary molecular diagnostics, including microsatellite instability high (MSI-High), mismatch repair deficiency (MMRd), and tumor mutational burden-high (TMB-H) assessments. The bar plot depicts the number of positive cases detected for each category: MSI-H, MMRd, and TMB-H, with the proportion of cases receiving molecular tumor board (MTB) recommendations indicated in hatched purple. The solid purple and hatched purple bars represent cases that were exclusively positive for a given parameter (e.g., MSI-H, MMRd, or TMB-H, i.e., no overlap or redundancy between testing methods was present) while hatched purple means a therapy recommendation was based on that specific non-overlapping and therefore non-redundant biomarker. b The contingency table illustrates MSI-H (or MMRd) and MSS (or MMRp) cases, assessed using two independent diagnostic methods (standard MSI PCR or MMR immunohistochemistry (MMR-IHC) and the percentage of unstable loci identified in panel-based diagnostics). Sensitivity, specificity, positive predictive value (PPV), and negative predictive value (NPV) are provided. c This figure presents PD-L1 expression levels across different tumor types, categorized by tumor proportion score (TPS, black), immune cell score (ICS, dark gray), and combined positive score (CPS, light gray), from top to bottom each. The left panel displays the distribution of PD-L1 scores for each tumor entity (median and maximum), while the right panel shows the number of cases assessed, stratified by the presence or absence of a MTB recommendation. The blue bars represent patients without therapy recommendation based on PD-L1 expression, whereas the purple segments indicate cases where PD-L1 positivity led to an MTB recommendation
MSI-PCR identified MSI-high (MSI-H) status in 8 of 415 cases (1.9%), with 87.5% (7/8) receiving ICI recommendations. MMRd IHC in 589 cases detected 15 MMR-deficient tumors (2.5%), including 8 not investigated by PCR due to unavailable normal tissue; 2 of these received ICI recommendations.
TMB-H (≥ 10 mutations/megabase) was found in 61 of 577 cases (10.6%), with 13 overlapping with MSI-H/MMRd and 48 in MSS/MMRp tumors. Among the latter, 24 received ICI recommendations. TMB varied by tumor type, with bladder cancer (9.7 (mean) ± 8,9 (SD)), melanoma (22.7 ± 46.9), and CRC (7.4 ± 10.1) showing TMB, while ovarian (3.3 ± 2.2), pancreatic (3.9 ± 2.5), and prostate cancers (3.0 ± 2.1) had lower values. Endometrial cancer displayed the highest variability (39.8 ± 58.8) (Additional file 1: Fig. S5).
In addition, we compared the different methods regarding their diagnostic overlap. MSI analysis by PCR and/or MMR protein IHC assessment were defined as the ground truth. Given this assumption, MSI-PCR remained the most specific biomarker for ICI selection, while MMR-testing identified additional cases, and TMB-H provided additional information in MSI/MMRd-negative tumors. Panel-based MSI assessment showed high specificity (98.7%) and NPV (99.6%) but had moderate PPV (60%) and 81.8% sensitivity, leading to false positive results. A tiered approach using panel diagnostics as a screening tool, with MSI-PCR confirmation for panel-positive cases, ensures accurate classification and prevents misclassification in MTB-guided therapy selection.
Examination of PD-L1 in the MTB context (Fig. 5c)
The analysis of PD-L1 expression showed significant variability across cancer types, influencing ICI recommendations. Thyroid cancer (TPS = 58 (mean) ± 40.9 (SD), ICS = 8.9 ± 8.7, CPS = 68 ± 36.8) and penile cancer (TPS = 10.7 ± 24, ICS = 8 ± 14.2, CPS = 21.9 ± 28.2) had the highest PD-L1 scores, correlating with the highest ICI recommendation rates. Bladder cancer (TPS = 13.2 ± 30.2, ICS = 3.8 ± 5.6, CPS = 17.4 ± 31.3), CUP (TPS = 11.9 ± 26.3, ICS = 6.6 ± 15.7, CPS = 17.8 ± 31.9), Melanoma (TPS = 2.7 ± 4.1, ICS = 5.8 ± 11.9, CPS = 9.4 ± 17.5), and NSCLC (TPS = 20.7 ± 32.7, ICS = 4.1 ± 4.9, CPS = 15.4 ± 28.8) exhibited moderate-to-high PD-L1 expression, while breast cancer (TPS = 2.1 ± 10.4, ICS = 3.1 ± 5.7, CPS = 5.7 ± 12.1) and pancreatic cancer (TPS = 2.1 ± 9.7, ICS = 1.6 ± 3.3, CPS = 4.9 ± 12.3) had low levels.
ICI recommendations were highest in thyroid cancer (83.3%) and penile cancer (57.1%), moderate in CUP (22.5%) and head and neck cancer (18.2%), but low in bladder cancer (12%) despite high PD-L1 expression, mostly due to prior ICI. Melanoma and NSCLC received no ICI recommendations despite elevated PD-L1 scores, primarily because it had already been used in prior treatment.
Implemented treatments (Fig. 6, Table 2, and Additional file 1: Fig. S6)
Employed treatments. a The alluvial plot on the left illustrates the biomarker used for therapy recommendation, with the clinically observed response displayed in the middle, and the corresponding evidence level on the right. b The swimmer plot on the right provides a detailed breakdown of individual therapy courses, illustrating treatment duration, response, and key clinical events. Patients with insufficient therapy data were excluded from this visualization. Each patient is assigned an anonymized ID. The white bars represent the duration of therapy, while the colored bars indicate the observed response: complete remission (CR) in yellow, mixed response (MR) in orange, partial response (PR) in blue, and stable disease (SD) in red. Additionally clinical events, including disease progression (PD), adverse drug reactions (ADR), and death are plotted. c Stacked bar charts of responses MTB therapy versus Non-MTB therapy
Finally, we describe the therapies implemented and the corresponding clinical outcomes.
Therapies were implemented based on heterogenous biomarkers, most frequently HER2, PD-L1, MSI/MMR, FGFR2, and TMB. In total 64 MTB-guided tretment courses were evaluable. Among these, 1 (1.6%) achieved a complete remission (CR; here it needs to be added that the patient received radiotherapy in addition to the molecularly targeted drug), 18 (28.1%) a partial remission (PR), 7 (10.9%) a mixed response (MR), 10 (15.6%) stable disease (SD), and 28 (43.8%) progressive disease (PD), resulting in a clinical benefit rate (CBR = CR + PR + SD) of 45.3% (29 out of 64 response evaluable cases). In comparison, patients who received non-MTB recommended therapies achieved a CBR of 48.2% (26 out of 54 response evaluable cases), with 3 complete responses (5.6%), 9 partial remissions (16.7%), 4 mixed reponses (7.4%), 14 cases of stable disease (25.9%), and 24 cases of progressive disease (44.4%). Of the MTB-implemented therapies, 44% were initiated based on supplementary biomarkers diagnostics, while the remaining 56% were derived from conventional panel sequencing results.
Most MTB-guided therpies were recommended at high levels of evidence (m1A, m1B) and were associated with higher response rates, although responses were also observed in cases with lower-evidence recommendations.
Median progression-free survival (PFS) was 8.4 months (257 days) in the MTB-guided cohort and 5.4 months in the patients treated with Non-MTB therapies (165 days). Median overall survival (OS) was 6.4 months in patients who either continued their existing therapy or received no additional therapy (“no therapy”-group), 13.6 months in patients who received MTB-guided therapies, and 15.6 months in patients treated with alternative, non-MTB-directed regimes. These findings represent descriptive associations within the cohort and should not be interpreted as causal effects.
Adverse drug reactions (ADR) were documented in 14% of the implemented MTB therapies, most frequently in patients treated with immune checkpoint inhibitors (ICI) and antibody drug conjugates (ADC). ADR were recorded if reported in discharge letters or clinical documentation, irrespective of grade, and did not necessarily lead to treatment discontinuation.
Discussion
The findings of this study emphasize the evolving role of supplementary diagnostic methodologies in precision oncology and their impact on MTB-guided therapy recommendations. Our results demonstrate that the integration of HRD testing, ADC-IHC, HER2 IHC and FISH, MSI assessment via PCR and IHC, and PD-L1 IHC contributed to a broader spectrum of actionable findings. While conventional next-generation sequencing (NGS) panel diagnostics remain the foundation of MTB decision-making, the addition of these diagnostic tools enhanced the overall rate of clinically relevant recommendations. In absolute numbers 37 implemented therapies were either fully or partially based on the testing and evaluation criteria defined as “supplementary” in this study, making up a significant proportion of 37% of all given therapies.
The clinical value of HRD testing was most evident in ovarian and breast cancer, where HRD positivity was observed at rates of 38.5% and 25.0%, respectively, consistent with literature [36]. However, HRD testing also identified potentially actionable cases in CUP and bladder cancer, leading to off-label treatment recommendations. The scarcity of HRD-positive cases in CCA aligns with the existing literature [36], reinforcing the limited relevance of HRD testing in this entity. Importantly, discrepancies between HRD positivity and HRR gene mutations, such as BRCA1/2 and PALB2, suggest that these genomic alterations alone may not entirely reflect HRD status, highlighting the need for functional HRD assessments in these cases besides ovarian and breast cancer. This discrepancy underscores that not all HRR gene mutations lead to HRD and that further investigation is required to determine their exact relevance. Notably some mutations, though detected by NGS, may not have functional impact despite being detected in sequencing assays, leaving their pathogenicity uncertain. Additionally, HRD status may not be affected if these mutations are present in a monoallelic state rather than biallelic inactivation, which is often necessary to completely abolish HRR.
It should also be considered that our study was based on panel diagnostics rather than whole-genome or whole-exome sequencing, where HRD assessment is not routinely included. Currently, from economic, practical, and technical perspectives, panel diagnostics remain the more feasible approach [37], as also applied by MTBs. Consequently, HRD analysis is gaining furher relevance within this framework, at least until more advanced methods become widely adopted.
The incorporation of ADC-IHC across various cancer entities further enhanced the spectrum of discussed targets. Claudin-18.2 testing yielded the highest recommendation rate (62.5%), predominantly in esophagogastric cancer. Similarly, Nectin-4 and TF showed selective utility in bladder, salivary gland, cervical, and head and neck cancers, supporting the rationale for ADC biomarker testing in these entities. However, the Trop-2 and FRα biomarkers provided comparatively low recommendation rates. It should be noted that for some ADC-targets the predictive value of IHC has yet to be fully determined. For example, in case of Sacituzumab govitecan in the first-in-human trial in various solid tumors Trop-2 expression was only available in few cases, where partial remissions were observed in tumors with weak, moderate, and high Trop-2 expression, while a stable disease was also documented in a tumor negative for Trop-2 IHC [38]. In addition, in the indication of triple-negative breast cancer, for which Sacituzumab govitecan was approved, most archival tumor specimens tested in a clinical trial were moderately to strongly positive [39], hence precluding a definitive evaluation of the biomarkers. For this purpose, the recommendations for Trop-2 targeted therapies in our MTB were cautiously based on a biological rationale only (m4). The same restriction applied to Enfortumab vedotin, whose approval for urothelial cancer was also not biomarker dependent, since the majority of tumors exhibited a strong staining of Nectin-4 [32]. This demonstrates the need of an ongoing evaluation of the corresponding biomarkers which is mirrored by low recommendation rates in our study. In contrast, Telisotuzumab-vedotin, Mirvetuximab-soravtansine, and Zolbetuximab with a proven record of strong biomarker dependency [26, 40, 41] were employed consistently in the respective entities and resulted in higher evidence levels. Therefore, especially c-Met, FRα, and Claudin18.2 should be given priority in NSCLC, ovarian cancer, and esophagogastric cancer, respectively, in an MTB if not already tested previously.
The next addition to panel diagnostics we focused on was MSI. Our comparative analysis of MSI detection methods underscores the complementary nature of MSI-PCR, MMR IHC, and sequencing-based MSI inference. While MSI-PCR remains the gold standard, primarily in CRC, we demonstrate that MMR IHC identifies additional cases that may not be captured by PCR-based methods, particularly in situations where normal tissue comparison is unavailable. Conversely, panel-based MSI detection (cut-off 10% unstable loci) exhibited high specificity (98.7%) and a strong negative predictive value (99.6%), making it a useful tool for ruling out MSI-high cases. However, its moderate positive predictive value (60%) indicates that confirmatory testing is essential for panel-positive cases to avoid false-positive MSI classifications. Moreover, the panel-based method also missed positive cases in view of its sensitivity of 80%. These findings support a tiered MSI testing approach, wherein panel diagnostics serve as a screening tool, with MSI-PCR and MMR IHC providing confirmatory validation in cases of uncertainty.
TMB analysis revealed significant variability across tumor entities, with high TMB values observed in bladder cancer, melanoma, and MSI-H CRC, consistent with their established immunogenic profiles [42]. However, the clinical utility of TMB as an independent biomarker remains complex, as evidenced by the fact that half of the TMB-high cases (≥ 10 mut/Mb) in our cohort did not receive ICI recommendations. This discrepancy can be explained by additional clinical considerations, such as tumor histology, prior treatment history, and the presence of co-occurring MSI influencing ICI eligibility. Among those patients who received therapy, three had documented clinical benefit (2 PR and 1 SD), while two progressed. Despite the entity-agnostic approval by the Food and Drug Administration in the USA based on the KEYNOTE-158 trial [43], the exact cut-off value remains an area of investigation and some tumor types may benefit less, necessitating an ongoing investigation of achievable real-world outcomes [44]. Altogether, an evaluation of TMB should be incorporated into MTB discussions to enhance access to ICI for select patients.
The same also applies to PD-L1-IHC. Notably, thyroid and penile cancers as well as CUP and head and neck squamous cell carcinomas achieved particularly high ICI recommendation rates based on this biomarker. Less frequently, recommendations were also given to cases of CCA, bladder cancer, and esophagogastric cancer ( the latter two often with previous ICI). However, only a few therapies were implemented with available follow-up.
The evaluation of HER2 alterations highlights the expanding role of HER2-low status in treatment selection. While both HER2-low and amplified cases were primarily recommended for trastuzumab- and ADC-based therapies, HER2-low findings constituted the majority of recommendations in cancers such as CCA, breast, and prostate cancer. This shift reflects the emerging recognition of HER2-low as a distinct therapeutic category even in tumors beyond breast and gastric cancer, and this is also the subject of current research (NCT04482309). The comparison of HER2 (ERBB2) copy high specificity (99.2%) but moderate sensitivity (60.0%), underlining the necessity of at least additional IHC in every case because 40% of HER2 amplified cases are missed by current NGS testing. The most likely reason for the low sensitivity is that sequencing-based CNV assessment can be affected by tumor heterogeneity and low tumor purity. The addition of IHC and FISH testing provides critical sensitivity enhancements to ensure accurate HER2 classification. Moreover, the definition of a HER2 low category has made HER2 IHC indispensable, since it cannot be inferred from panel sequencing and FISH analysis.
From a therapeutic standpoint, our analysis of MTB-guided therapies stresses the value of integrating high-evidence biomarker-driven treatments, while remaining open to lower-evidence strategies in select cases. Therapies based on m1A and m1B evidence levels dominated the recommendations, and high-evidence-level recommendations tended to be associated with favorable clinical outcomes.
Although the findings are promising, the study has significant limitations. First, the real-world nature of MTB decision-making introduces variability in treatment implementation, influenced by factors such as patient comorbidities, prior treatment failures, and access to off-label therapies. Additionally, the retrospective nature of some analyses may limit causal inferences between biomarker findings and therapeutic outcomes. Future studies should incorporate prospective validation of supplementary diagnostics and evaluate their impact on long-term survival outcomes. Furthermore, while this study analyzed the incremental utility of supplementary diagnostics, it remains unclear whether their widespread adoption would significantly alter standard-of-care approaches in a cost-effective manner. The financial and logistical feasibility of integrating these biomarkers into routine MTB workflows warrants further exploration.
Given the high rate of implemented therapies based on supplementary diagnostics, it is worthwhile to compare other potential extensions of MTBs, such as WGS. While WGS enables comprehensive genomic analysis, its additional clinical utility compared to more targeted and cost-efficient methods remains uncertain. Many therapeutically relevant mutations are already covered by panel sequencing, and studies suggest that WGS rarely leads to changes in clinical management. Higher costs, longer turnaround times, and the associated resource demands may further limit its widespread implementation, although WGS could be beneficial in specific cases, such as the detection of complex structural rearrangements [45–47].
Based on our findings, we propose a pragmatic workflow for integrating supplementary diagnostics into MTB practice. HER2 and PD-L1 IHC should be routinely performed, as they are inexpensive, feasible on limited tissue, and can identify therapeutic opportunities not captured by NGS alone (e.g., HER2-low). The feasibility in this study is also evidenced by the number of samples that could be successfully analyzed using the defined supplementary methods in a real-world setting. HER2 amplification inferred from copy number gains should be confirmed by IHC and, if needed, FISH. TMB should be routinely assessed as part of NGS analysis, as it provides actionable information independent of MSI. MSI testing is best performed through a combination of MMR IHC and NGS, if necessary with PCR confirmation in positive cases to ensure accuracy. HRD testing should be restricted to entities where clinical relevance is established (e.g., breast, ovarian, pancreatic cancer), given that BRCA mutations may occur without HRD. Finally, ADC biomarker testing by IHC should be applied selectively in tumor types with clinical evidence or approvals, including Claudin-18.2 in gastric cancer, FRα in ovarian cancer, C-MET and Nectin-4 in non-squamous NSCLC, Nectin-4 and tissue factor in head and neck SCC, Nectin-4 and TROP-2 in urothelial cancer, and Nectin-4 and TROP-2 in CUP.
In conclusion, our study demonstrates that supplementary diagnostics—including HRD testing, ADC-IHC, HER2 IHC and FISH, MSI assessment via PCR/IHC, and PD-L1 IHC—enhance the spectrum of actionable findings and therapeutic recommendations in precision oncology. These methods complement conventional NGS panel diagnostics and provide additional stratification tools for patient selection, particularly in rare and under-characterized tumor types. Incorporating these biomarkers into MTB workflows marks a step toward a more comprehensive precision oncology framework, where multiple diagnostic modalities converge to optimize individualized cancer treatment.
Beyond outcome assessment, this study also serves as an internal evaluation of newly implemented modifications, allowing for a structured review of our evolving diagnostic strategies. By integrating novel biomarkers and refining analytical approaches, we aim to further optimize our MTB framework to enhance the precision and clinical relevance of off-label therapy recommendations.
Conclusions
The integration of additional biomarker assessments into MTB workflows enhances precision oncology by expanding the pool of patients eligible for targeted therapies. Supplementary diagnostics such as HRD testing, ADC-IHC, HER2 IHC/FISH (including the reporting of Her2 low status), MSI, and PD-L1 analysis increased actionable findings beyond standard panel sequencing. These mostly cost-effective methods enabled additional treatment recommendations. Their routine use supports a broader, more adaptable, and patient-centered approach to individualized cancer care. Thus, rather than focusing solely on more comprehensive sequencing technologies such as whole-genome or whole-exome sequencing, the strategic implementation of additional techniques—particularly predictive IHC—should be considered a core component of modern MTB practice.
Supplementary Information
Additional file 1: Table S1 & S2; Fig. S1-S6. Table S1: Additional testing selection criteria; Table S2: Antibodies for IHC-IHC; Fig. S1_1 and S1_2: ADC-IHC evaluation by H Score; Fig. S2: Sample information; Fig. S3: Recommendations based on entity + evidence levels; Fig. S4: Recommendations based on genetic alterations; Fig. S5: TMB distribution by entity; Fig. S6: Survival analyses.
The reference list from the paper itself. Each links out to its DOI / PubMed record.
- 1Antonio G-M, Bhavana P, Ignace V, René DC, Whitney G, R. MM, et al. Niraparib in Patients with Newly Diagnosed Advanced Ovarian Cancer. N Engl J Med. 2019;381:2391-402.10.1056/NEJ Moa 191096231562799 · doi ↗ · pubmed ↗
- 2Swiecicki PL, Yilmaz E, Rosenberg AJ, Fujisawa T, Bruce JY, Meng C, et al. Phase II Trial of Enfortumab Vedotin in Patients With Previously Treated Advanced Head and Neck Cancer. J Clin Oncol Off J Am Soc Clin Oncol. 2024;:JCO 2400646.10.1200/JCO.24.00646 PMC 1180972739481054 · doi ↗ · pubmed ↗
- 3Abou-Alfa Vaibhav; Hollebecque, Antoine; Vaccaro, Gina M.; Melisi, Davide; Al-Rajabi, Raed; Paulson, Andrew Scott; Borad, Mitesh J.; Gallinson, David; Murphy, Adrian; Oh, Youn; Dotan, Efrat; Catenacci, Daniel V.T.; Van Cutsem, Eric; Ji, Tao; Lihou, Chris GK. S. Pemigatinib for previously treated, locally advanced or metastatic cholangiocarcinoma: a multicentre, open-label, phase 2 study. Lancet Oncol. 2020;21:671–84.10.1016/S 1470-2045(20)30109-1PMC 846154132203698 · doi ↗ · pubmed ↗
- 4Rempel E, Kluck K, Beck S, Ourailidis I, Kazdal D, Neumann O, et al. Pan-cancer analysis of genomic scar patterns caused by homologous repair deficiency (HRD). npj Precis Oncol. 2022;6:36.10.1038/s 41698-022-00276-6PMC 918460235681079 · doi ↗ · pubmed ↗