In vitro cobalt stress alters Adhatoda vasica anatomy, antioxidant defense, and metabolite profiles with docking insights
Ahmed M. Zaher, Fatma A. Al-Kahtany, Ahmed A. K. Mohammed, Fatma A. Farghaly, Abeer A. Radi, Afaf M. Hamada

TL;DR
This study shows how cobalt stress affects the growth, structure, and chemical makeup of the medicinal plant Adhatoda vasica, with implications for its use in herbal medicine and cancer treatment.
Contribution
The study reveals how cobalt stress alters plant anatomy, antioxidant defenses, and metabolite profiles, with new insights into naringin’s potential for skin cancer treatment.
Findings
Low cobalt concentrations increased shoot dry weight, while higher concentrations reduced it significantly.
Cobalt exposure altered antioxidant enzyme activity and secondary metabolite profiles in a dose-dependent manner.
Naringin showed higher binding affinity to a skin cancer-related protein compared to other metabolites.
Abstract
The growing demand for medicinal plants in herbal medicine highlights their therapeutic value, yet heavy metal contamination, such as cobalt (Co), poses potential health risks. Cobalt’s dual role as an essential micronutrient and a toxic pollutant necessitates a more profound understanding of its impact on medicinal plants like Adhatoda vasica. We investigated how varying Co concentrations affect A. vasica shoot growth, leaf anatomy, antioxidant enzyme activity, and secondary metabolite profiles. Additionally, molecular docking was performed to assess the interaction of the metabolites with the skin cancer-related protein anti-ssDNA antigen-binding fragment (PDB code: 1P7K). Low Co concentrations (50 µM) enhanced shoot dry weight by 41.45%, while higher levels (100–1000 µM) reduced it by up to 66.86%. Cobalt exposure increased hydrogen peroxide (H2O2) and lipoxygenase (LOX) activity,…
Genes, proteins, chemicals, diseases, species, mutations and cell lines named across the full text — each resolved to its canonical identifier and authoritative record.
Click any figure to enlarge with its caption.
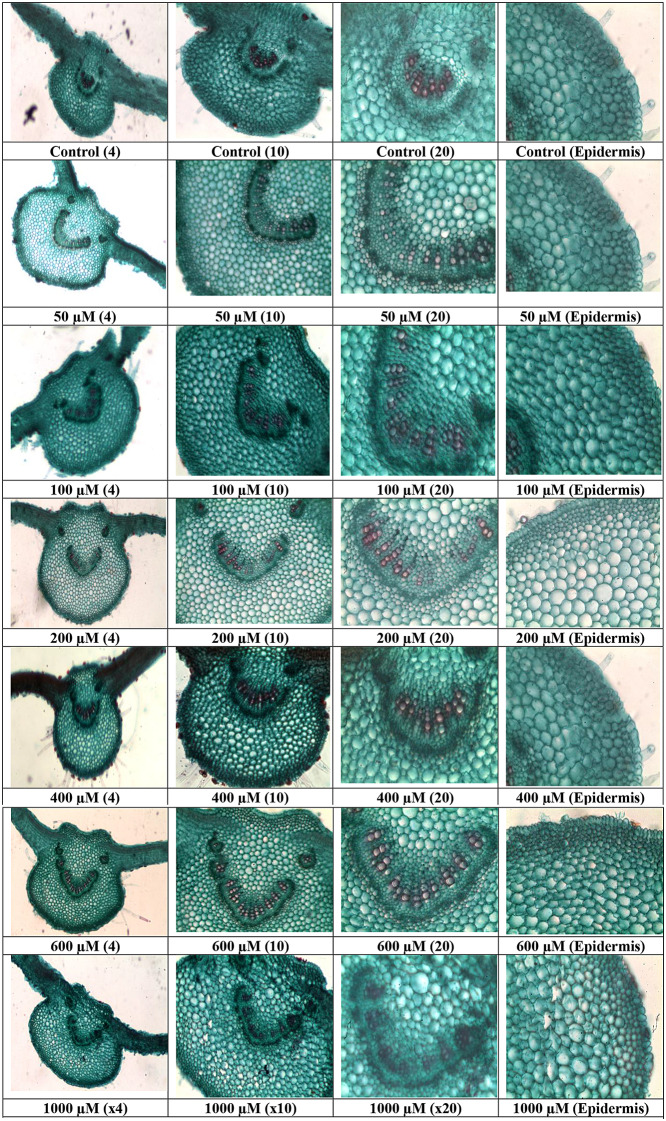 Figure 1
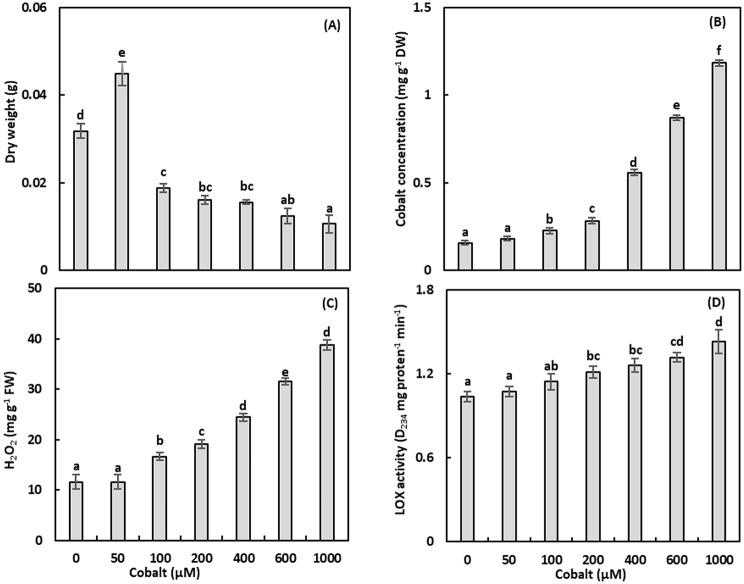 Figure 2
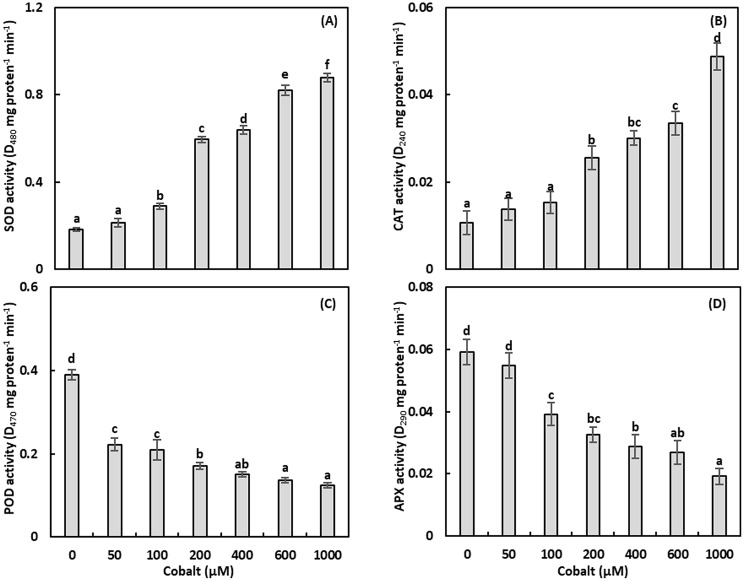 Figure 3
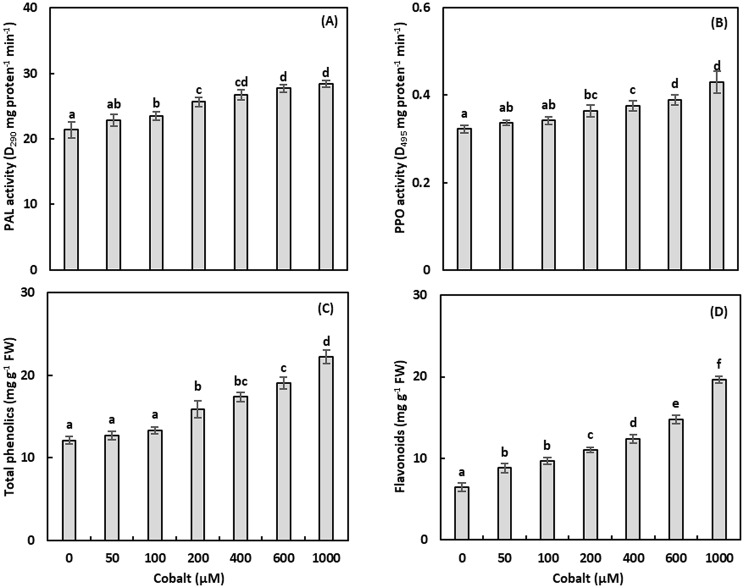 Figure 4
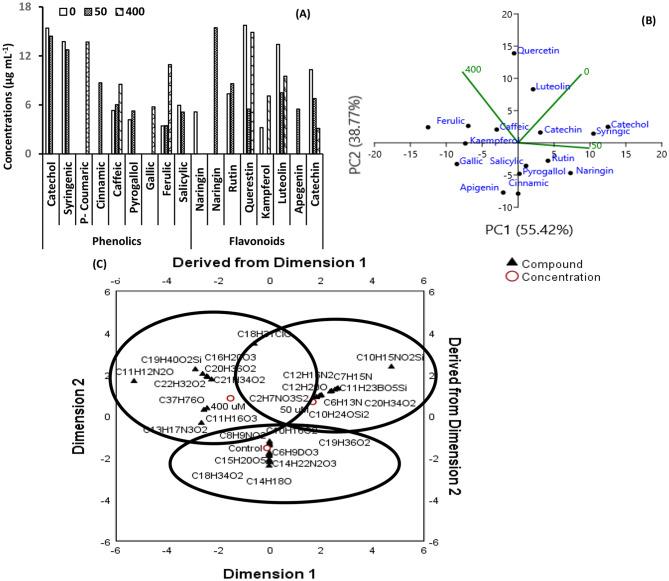 Figure 5
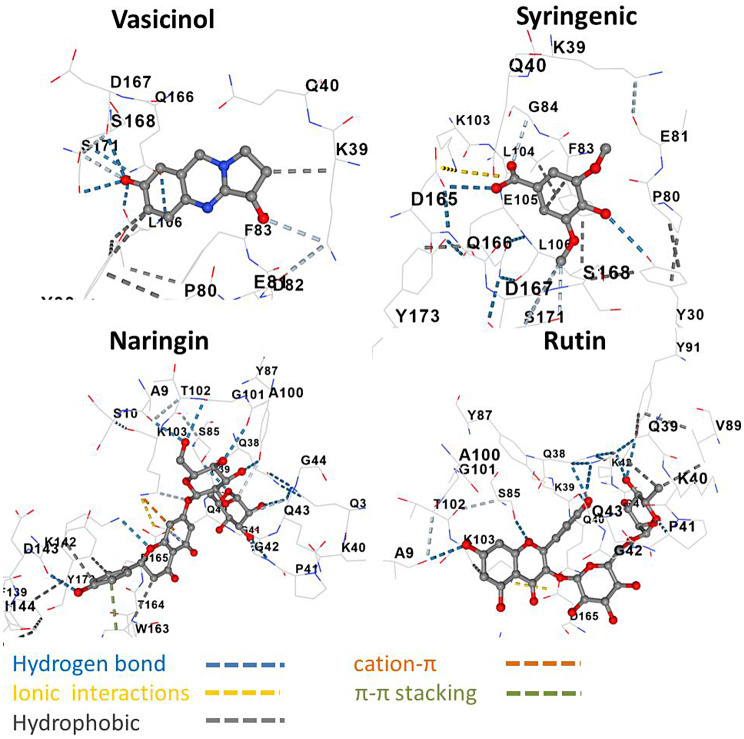 Figure 6
- —Assiut University
Peer Reviews
No public reviews on file for this paper yet. If you reviewed it on a platform where reviews are public (OpenReview, ICLR, NeurIPS, ICML), you can paste yours below so the community can read it here.
Videos
No videos yet. Explain this paper in a talk, walkthrough, or lecture? Add one.
Taxonomy
TopicsSynthesis and bioactivity of alkaloids · Andrographolide Research and Applications · Berberine and alkaloids research
Introduction
Heavy metal contamination, driven by industrial activities such as mining, oil refining, and waste disposal, poses a global threat by entering the food chain and affecting ecosystems [1, 2]. Cobalt (Co), a trace element, exemplifies this challenge due to its dual role as an essential micronutrient for plants and a potential toxicant at higher concentrations [3]. Naturally, soil Co levels range from 8 to 25 mg kg⁻¹, with agricultural regulations capping permissible levels at 20 mg kg⁻¹ [4]. While plants thrive at low Co concentrations (< 0.08 mg kg⁻¹ soil), levels up to 40 ppm can impair growth, and groundwater Co varies from 0.006 to 0.43 mg L⁻¹ [5–7]. The International Agency for Research on Cancer (IARC) classifies Co as a potential human carcinogen, underscoring its health risks [8].
As a transition metal, Co catalyzes Fenton reactions, generating reactive oxygen species (ROS) that cause lipid peroxidation, membrane disruption, enzyme deactivation, and photosynthetic decline [9, 10]. Plants combat these effects using enzymatic and non-enzymatic defense systems [7, 11, 12]. The phenylpropanoid and shikimate pathways, activated under stress, produce secondary metabolites like phenolics and flavonoids, which chelate metals and scavenge ROS, enhancing plant tolerance [13, 14]. These metabolites also hold industrial and medicinal value, contributing to plant–environment interactions [15, 16]. However, heavy metal uptake and transport depend on factors like plant species, soil properties, and organ anatomy, with leaf anatomical changes often overlooked despite their role in metal sequestration and tolerance [17].
Adhatoda vasica, a medicinal shrub of the Acanthaceae family, is valued in Unani and Ayurvedic medicine for its therapeutic properties and is recognized by the World Health Organization for primary healthcare applications [18]. Despite its widespread use, the impact of heavy metals on medicinal plants like A. vasica remains underexplored compared to crop species, raising concerns about contamination risks in herbal remedies [19, 20]. Adhatoda vasica is recognized for several medicinal applications; however, its efficacy against skin cancer, specifically the mechanistic details involving metabolite-protein interactions, has yet to be explored.
This study addresses these gaps by examining how Co stress affects A. vasica shoot growth, leaf anatomy, antioxidant defenses, and secondary metabolite profiles. We hypothesize that Co induces dose-dependent anatomical and biochemical changes, influencing ROS management and metabolite production. Additionally, we employ molecular docking to explore interactions between A. vasica metabolites (alkaloids, phenolics, and flavonoids) and the skin cancer-related protein anti-ssDNA antigen-binding fragment (PDB code: 1P7K), aiming to uncover therapeutic potential. Our findings clarify how Adhatoda vasica tolerates Co, which is essential for advancing its application in phytoremediation and exploring its value for drug development.
Materials and methods
Chemicals
All chemicals were sourced from Sigma-Aldrich (St. Louis, MO, USA). HPLC- and GC-MS-grade organic solvents were obtained from Thermo Fisher Scientific (Hanover Park, IL, USA).
Plant growth
Shoot tips of Adhatoda vasica were collected from healthy plants at Assiut University’s Botany and Microbiology farm, Egypt (27°11′00″N, 31°10′00″E). After rinsing under running tap water for 20–30 min, shoot tips were surface-sterilized in a laminar flow hood by washing three times with sterile distilled water, soaking in 10% sodium hypochlorite for 10 min, and rinsing three times with sterile distilled water. Three sterilized shoot tips were aseptically placed in 195-mL culture jars containing 30 mL of sterile Murashige and Skoog (MS) medium [21], supplemented with 3 mg L⁻¹ 6-benzylaminopurine, 1 mg L⁻¹ α-naphthalene acetic acid, 4.4 g L⁻¹ MS salts, and 3% sucrose. The medium was adjusted to pH 5.7, solidified with 3 g L⁻¹ gelrite, and autoclaved at 121 °C for 15 min. Cobalt chloride (CoCl₂·6 H₂O) was added to the MS medium at concentrations of 0, 50, 100, 200, 400, 600, and 1000 µM [22]. The selected concentrations likely span from sub-toxic to potentially toxic levels to study both beneficial and adverse effects. For example, low concentrations (50–100 µM) might promote certain metabolic pathways, while higher ones (600–1000 µM) could induce stress or toxicity. Jars were incubated in a growth chamber under a 16/8 h light/dark photoperiod, 30 µmol m⁻² s⁻¹ light intensity, 25 ± 1 °C, and 50–60% relative humidity. Following 30 days, the proliferated shoots (defined as those with new growth) were harvested. Immediate fresh weight (FW) measurement was performed, and all samples were flash-frozen using liquid nitrogen and stored at -80 °C. The remaining shoots were oven-dried at 60 °C for 48 h to determine the dry weight (DW).
Leaf anatomy
Leaf anatomy was analyzed to examine epidermal and vascular bundle structures. Leaves with prominent main veins were transversely sectioned into 7 μm slices using an optical microtome. Sections were stained with safranin for 30 min, followed by dehydration through a graded ethanol series (50–100%). They were then counter-stained with fast green for 30 s, washed with 95% ethanol, and finally cleared in a 1:1 xylene-ethanol solution for 30 min. Microstructures were examined using an Olympus CX41 light microscope equipped with an Olympus SC30 U-TV1X-2 camera (Tokyo, Japan).
Estimation of cobalt content
Dried shoot samples were powdered and digested in a 1:3:1 (v/v) mixture of 60% HClO₄, concentrated HNO₃, and H₂SO₄ [23]. Digested samples were diluted to 10 mL with distilled water. Cobalt concentrations were quantified using a Buck 210 VGP atomic absorption spectrophotometer (Buck Scientific, USA), with calibration against a cobalt standard curve and inclusion of blanks for quality control.
Estimation of hydrogen peroxide content
Hydrogen peroxide (H₂O₂) levels were measured spectrophotometrically following Velikova et al. [24]. Frozen shoots were homogenized in 0.1% trichloroacetic acid (TCA), centrifuged at 12,000 rpm for 15 min at 4 °C, and the supernatant was mixed with 10 mM potassium phosphate buffer (PPB, pH 7.8) and 1 M potassium iodide. After a 20-min incubation, absorbance was measured at 390 nm using a spectrophotometer. Hydrogen peroxide concentrations were calculated using a standard curve and expressed as mg g⁻¹ FW.
Enzyme extraction
Frozen shoots were ground to a fine powder in liquid nitrogen and homogenized in 100 mM PPB (pH 7.8) containing 0.1 mM ethylenediaminetetraacetic acid (EDTA) and 0.1 g polyvinylpyrrolidone (PVP). The homogenate was centrifuged at 18,000 rpm for 10 min at 4 °C, and the supernatant was used for enzyme activity assays. Protein content was quantified using the Bradford method [25].
Estimation of lipoxygenase activity
Lipoxygenase (LOX, EC 1.13.11.12) activity was assayed per Minguez-Mosquera et al. [26]. A substrate solution of linoleic acid, Tween-20, and distilled water was adjusted to pH 9.0 with NaOH, then to pH 6.5 with HCl, and diluted to 100 mL with 100 mM PPB. Enzyme aliquots were added, and absorbance changes at 234 nm were measured. Lipoxygenase activity was expressed as milligrams of protein per minute (DA_234_ mg protein^− 1^ min^− 1^).
Estimation of superoxide dismutase activity
Superoxide dismutase (SOD, EC 1.15.1.1) activity was determined using the epinephrine oxidation method [27]. The reaction mixture contained 0.05 M Na₂CO₃ buffer (pH 10.2), 0.1 mL EDTA, enzyme aliquots, and epinephrine. Absorbance changes at 480 nm were measured, and SOD activity was expressed as milligrams of protein per minute (DA_480_ mg protein^− 1^ min^− 1^).
Estimation of catalase activity
The activity of catalase (CAT, EC 1.11.1.6) was assessed by tracking H_2_O_2_ consumption [28]. The reaction mixture included 50 mM PPB (pH 7.0), 10 mM H₂O₂, and enzyme aliquots. Absorbance changes at 240 nm were recorded for 1 min, and CAT activity was expressed as milligrams of protein per minute (DA_240_ mg protein^− 1^ min^− 1^).
Estimation of peroxidase activity
Peroxidase (POD, EC 1.11.1.7) activity was assessed using an enzymatic assay that monitored tetraguaiacol formation [29]. The reaction mixture contained 30 mM PPB (pH 7.0), 6.5 mM H₂O₂, 1.5 mM guaiacol, and enzyme aliquots. Absorbance changes at 470 nm were measured, and POD activity was expressed as milligrams of protein per minute (DA_470_ mg protein^− 1^ min^− 1^).
Estimation of ascorbate peroxidase activity
Ascorbate peroxidase (APX, EC 1.11.1.11) activity was measured via ascorbic acid oxidation [30]. The reaction mixture included 50 mM PPB (pH 7.0), 0.1 mM EDTA, 1.2 mM H₂O₂, 0.5 mM ascorbic acid (AsA), and enzyme aliquots. Absorbance changes at 290 nm were recorded, and APX activity was expressed as milligrams of protein per minute (DA_290_ mg protein^− 1^ min^− 1^).
Estimation of phenylalanine ammonia-lyase activity
Phenylalanine ammonia-lyase (PAL, EC 4.3.1.5) activity was determined by measuring trans-cinnamate production [31]. Enzyme aliquots were incubated in 50 mM borate buffer (pH 8.7) with phenylalanine at 37 °C for 1 h. The reaction was stopped with 0.5 N HCl, centrifuged at 2,000 rpm for 5 min, and absorbance was measured at 290 nm. PAL activity was expressed as milligrams of protein per minute (DA290 mg protein^− 1^ min^− 1^).
Estimation of polyphenol oxidase activity
Polyphenol oxidase (PPO, EC 1.14.18.1) activity was measured by purpurogallin production [32]. Enzyme aliquots were incubated in 100 mM PPB (pH 6.0) with 100 mM catechol at 25 °C for 5 min. The reaction was stopped with 2.5 N H₂SO₄, and absorbance was measured at 495 nm. Polyphenol oxidase activity was expressed as milligrams of protein per minute (DA495 mg protein^− 1^ min^− 1^).
Estimation of total phenolic content
Total phenolic content was quantified using the Folin-Ciocalteu method with gallic acid as the standard [33]. Shoots were extracted using 80% methanol at 80 °C for 90 min. The resulting extract was then centrifuged at 14,000 rpm for 15 min. Finally, the supernatant was mixed with 2 N Folin-Ciocalteu reagent and 20% Na_2_CO_3_. After 20 min of incubation at room temperature, the sample’s absorbance was measured at 725 nm using a spectrophotometer. We determined the phenolic content by comparing the sample’s absorbance to a gallic acid standard curve, expressing the results in mg g^− 1^ FW.
Estimation of total flavonoid content
Total flavonoid content was measured using the method of Chang et al. [34], with quercetin as the standard. Methanol extracts were mixed with 10% aluminum nitrate and 1 M potassium acetate. After 40 min at room temperature, absorbance was measured at 415 nm. Flavonoid content was expressed as mg quercetin equivalents g⁻¹ FW.
Estimation of phenolic and flavonoid profiles
Dried shoots were extracted with methanol at room temperature with stirring for 24 h, repeated three times. The extract was concentrated under reduced pressure using a rotary evaporator. The residue was suspended in 10% methanol and fractionated via liquid-liquid extraction with dichloromethane and ethyl acetate (three times each). Fractions were concentrated under reduced pressure to yield dichloromethane, ethyl acetate, and aqueous extracts.
HPLC analysis
Phenolic compounds in the ethyl acetate extract were analyzed using an Agilent 1100 HPLC system with a UV/Vis detector and a C18 column (125 mm × 4.6 mm, 5 μm). The mobile phase consisted of solvent A (1% acetic acid in water) and solvent B (100% methanol). A gradient elution was used: 100% solvent A for 3 min, 50% solvent B for 5 min, increasing to 80% over 2 min, and to 100% over 5 min, maintained until 25 min, at a flow rate of 1 mL min⁻¹. The injection volume was 25 µg mL⁻¹. Phenolics were identified using Agilent ChemStation software and authentic standards.
A: 1% acetic acid in water B: 100% methanolTime (min)% A% BDescription0.01000Initial: 100% A3.01000Hold 100% A8.0505050% B over 5 min10.0208080% B over 2 min15.00100100% B over 5 min25.00100Hold 100% B25.0 + (Stop)––End run
Flavonoids were analyzed on a C18 column (250 mm × 4.6 mm, 5 μm) using an isocratic mobile phase of 70% acetonitrile and 30% 1% formic acid in water, at 1 mL min⁻¹ for 25 min. Flavonoids were identified using authentic standards and Agilent ChemStation software.
A: 1% formic acid in water. B: 100% acetonitrileTime (min)% A% BFlow Rate (mL min^− 1^)0.0–25.030701.025.0 (Stop)--End
Estimation of metabolites
GC-MS analysis
Dichloromethane fractions were analyzed using a Shimadzu GC-MS-QP2010 system with an RTX-5MS column (30 m × 0.25 mm i.d. × 0.25 μm; Restek, USA). The oven temperature started at 70 °C, increasing at 40 °C min⁻¹ to 270 °C over 50 min. Helium was used as the carrier gas at 1.41 mL min⁻¹, with an injector temperature of 200 °C. Mass spectra were acquired at 70 eV, 60 mA filament emission, and 200 °C ion source temperature. Samples (1% v/w) were injected with a 1:15 split ratio, and full-scan data (m/z 50–500) were collected at 2.6 scans s⁻¹. Compounds were identified using the Wiley 275 L database (Thermo Fisher Scientific, USA) and confirmed by mass fragmentation patterns, with a similarity threshold of ≥ 70% for metabolite identification.
Molecular docking
Molecular docking was performed using AutoDock Vina [35] to evaluate interactions between A. vasica metabolites (alkaloids, phenolics, and flavonoids) and the anti-ssDNA antigen-binding fragment (PDB: 1P7K). Ligand structures were retrieved from PubChem [36]. Protein and ligand preparation, cavity detection, and blind docking were conducted using the CB-Dock-2 server [18] with default parameters. Ten docking poses were generated, and the pose with the lowest Vina score (highest binding affinity) was selected for analysis.
Statistical analysis
Experiments were conducted in duplicate, with four biological replicates per treatment (each consisting of three technical replicates), each comprising 25 jars. Data are presented as means ± standard deviation (SD). One-way ANOVA followed by Tukey’s post-hoc test was performed using SPSS 26.0 to identify significant differences (P ≤ 0.05). Pearson’s correlation coefficients were calculated to assess relationships between parameters under Co treatments. Principal component analysis (PCA) was used to analyze variations in the phenolic and flavonoid profiles.
Results
Leaf anatomy
Cobalt exposure altered A. vasica leaf anatomy, potentially impacting photosynthesis and stress resilience (Fig. 1). Transverse sections of the main vein showed a dose-dependent increase in xylem and phloem vessel counts with rising Co concentrations (50-1000 µM). Cell wall tortuosity also increased progressively, indicating structural adaptations to Co stress.
Fig. 1. Leaf cross-section micrographs of Adhatoda vasica exposed to different concentrations of cobalt (0-1000 µM) for 30 days. (Obj x 4, 10 x, and 20 x)
Fig. 2. Dry weight (A), cobalt concentration (B), hydrogen peroxide (H_2_O_2_) levels (C), and the activity of lipoxygenase (LOX; D) of Adhatoda vasica proliferated shoots under the effect of different cobalt concentrations for 30 days. The data are means ± standard deviation (n = 4). The letters indicate statistically significant differences (P ≤ 0.05)
Fig. 3. The activity of superoxide dismutase (SOD; A), catalase (CAT; B), peroxidase (POD; C), ascorbate peroxidase (APX; D) of Adhatoda vasica proliferated shoots under the effect of different cobalt concentrations for 30 days. The data are means ± standard deviation (n = 4). The letters indicate statistically significant differences (P ≤ 0.05)
Fig. 4. The activity of phenylalanine ammonia‑lyase (PAL; A), polyphenol oxidases (PPO; B), and the total phenolic (A), and total flavonoid concentrations of Adhatoda vasica proliferated shoots under the effect of different cobalt concentrations for 30 days. The data are means ± standard deviation (n = 4). The letters indicate statistically significant differences (P ≤ 0.05)
Fig. 5. The concentration (A) and principal component analysis (PCA; B) of the phenolic, flavonoid, and gas chromatography/mass spectrometry (GC-MS; C) metabolic profiles of Adhatoda vasica proliferated shoots under the effect of different cobalt (0, 50, 400 µM) concentrations for 30 days
Fig. 63D molecular interactions of vasicinol (Vina score − 7.0 kcal/mol), syringenic (-6.0), naringin (-9.2), and rutin (-8.7) with the active site of anti-ssDNA antigen-binding fragment (PDB code: 1P7K)
Growth
Shoot growth was assessed by measuring the DW of proliferated A. vasica shoots under varying Co concentrations (Fig. 2A, Table S1). A statistically significant increase in shoot DW (P ≤ 0.05) was observed at 50 µM Co, showing a 41.45% gain over the control plants. However, higher Co concentrations (100–1000 µM) inhibited growth, with a maximum DW reduction of 66.86% at 1000 µM (P ≤ 0.05). A significant negative correlation (r = -0.677, P ≤ 0.01) was observed between DW and Co concentrations.
Cobalt accumulation
Cobalt accumulation in A. vasica shoots was positively correlated with medium Co concentrations (r = 0.982, P ≤ 0.01; Fig. 2B, Table S1). At 50 µM Co, the shoot Co content increased 1.2-fold (non-significant) compared to the control plants. At 1000 µM Co, a significant 7.6-fold increase was observed (P ≤ 0.05), indicating enhanced Co uptake and storage at higher concentrations.
Hydrogen peroxide
Hydrogen peroxide levels, a marker of oxidative stress, were quantified in A. vasica shoots (Fig. 2C, Table S1). At 50 µM Co, H₂O₂ levels remained unchanged. Higher Co concentrations (100–1000 µM) significantly increased H₂O₂ levels by 43.71-234.35% compared to the control (P ≤ 0.05), with a strong positive correlation (r = 0.980, P ≤ 0.01) between H₂O₂ and Co concentrations.
Antioxidant enzyme activities
Lipoxygenase
Lipoxygenase activity, indicative of membrane lipid peroxidation, was measured in shoots (Fig. 2D, Table S1). Lipoxygenase activity was unaffected at 50–100 µM Co but increased significantly at 200–1000 µM, with a maximum increase of 38.16% at 1000 µM (P ≤ 0.05). A positive correlation (r = 0.899, P ≤ 0.01) was observed between LOX activity and Co concentrations.
Superoxide dismutase
Superoxide dismutase activity, which mitigates superoxide radicals, was assessed (Fig. 3A, Table S1). Superoxide dismutase activity remained unchanged at 50 µM Co but increased significantly at 100–1000 µM, with a maximum enhancement of 385.22% at 1000 µM (P ≤ 0.05). A strong positive correlation (r = 0.904, P ≤ 0.01) was found between SOD activity and Co concentrations.
Catalase
Catalase activity, responsible for H₂O₂ detoxification, was measured (Fig. 3B, Table S1). Catalase activity was unaffected at 50–100 µM Co but increased significantly at 200–1000 µM, with a maximum increase of 355.98% at 1000 µM (P ≤ 0.05). A strong positive correlation (r = 0.941, P ≤ 0.01) was observed between CAT activity and Co concentrations.
Peroxidase
Peroxidase activity, involved in H₂O₂-dependent oxidation, was evaluated (Fig. 3C, Table S1). Peroxidase activity decreased significantly with increasing Co concentrations, with a maximum reduction of 68.30% at 1000 µM (P ≤ 0.05). A negative correlation (r = -0.669, P ≤ 0.01) was found between POD activity and Co concentrations.
Ascorbate peroxidase
Ascorbate peroxidase activity, another H₂O₂-scavenging enzyme, was measured (Fig. 3D, Table S1). Ascorbate peroxidase activity was unaffected at 50 µM Co but decreased significantly at 100–1000 µM, with a maximum reduction of 67.55% at 1000 µM (P ≤ 0.05). A negative correlation (r = -0.809, P ≤ 0.01) was observed between APX activity and Co concentrations.
Phenylalanine ammonia-lyase
Phenylalanine ammonia-lyase activity, linked to phenolic synthesis, was assessed (Fig. 4A, Table S1). Phenylalanine ammonia-lyase activity was unchanged at 50 µM Co but increased significantly at 100–1000 µM, with a maximum enhancement of 32.77% at 1000 µM (P ≤ 0.05). A positive correlation (r = 0.859, P ≤ 0.01) was found between PAL activity and Co concentrations.
Polyphenol oxidase
Polyphenol oxidase activity, involved in phenolic oxidation, was measured (Fig. 4B, Table S1). Polyphenol oxidase activity was unchanged at 50–100 µM Co but increased significantly at 200–1000 µM, with enhancements of 12.80%, 16.44%, 20.58%, and 33.16% at 200, 400, 600, and 1000 µM, respectively (P ≤ 0.05). A strong positive correlation (r = 0.912, P ≤ 0.01) was observed between PPO activity and Co concentrations.
Phenolic and flavonoid content
Total phenolic compounds
The total phenolic content in A. vasica shoots was quantified (Fig. 4C). Cobalt concentrations of 50–100 µM showed no significant effect, while 200–1000 µM significantly increased the phenolic content, with a maximum increase of 83.15% at 1000 µM (P ≤ 0.05). A strong positive correlation (r = 0.951, P ≤ 0.01) was observed between the phenolic content and cobalt concentrations.
Total flavonoid compounds
Total flavonoid content, key to ROS scavenging, was measured (Fig. 4D). Cobalt concentrations of 50-1000 µM significantly increased flavonoid content, with a maximum increase of 204.29% at 1000 µM (P ≤ 0.05). A strong positive correlation (r = 0.962, P ≤ 0.01) was found between the flavonoid content and Co concentrations.
Phenolic profiles
Phenolic profiles were analyzed via HPLC (Figs. 5 A-B, Table 1, Fig. S2). At 50 µM Co, catechol and syringic acid decreased by 6.43% and 7.27%, respectively, and were undetectable at 400 µM. The presence of p-coumaric acid (13.70 µg mL^− 1^) and gallic acid (5.76 µg mL^− 1^) was exclusive to the 400 µM Co group. Cinnamic acid (8.71 µg mL⁻¹) was detected only at 50 µM Co. Caffeic acid increased by 13.16% and 60.15% at 50 and 400 µM Co, respectively. Pyrogallol and salicylic acid showed biphasic responses, with pyrogallol increasing by 25.84% at 50 µM but undetectable at 400 µM, and salicylic acid decreasing by 13.95% at 50 µM and undetectable at 400 µM. Ferulic acid increased by 218.66% at 400 µM Co.
Table 1HPLC analysis of Adhatoda vasica shoot Ethyl acetate extract: detected phenolics and flavonoidsCom.No.Compound NamesRetention Time (min)Height (mAU)Area (mAU.s)Concentration µg/mL050400050400050400 Phenolics 1 Catechol 41300.1021300.1020350.63350.63015.414.4102 Syringic acid 5920.145920.1450300.96300.96013.7512.7503 P-coumaric acid 6001300.0500450.120013.74 Cinnamic acid 70605.07600270.42008.7105 Caffeic acid 8550.412550.412700.42210.7210.7320.75.326.028.526 Pyrogallol 9.4350.117350.1170100.05100.0504.185.2607 Gallic acid 1000490.3200201.33005.768 Ferulic acid 11241.302241.3021020.4195.2695.26410.323.433.4510.939 Salicylic acid 12302.01302.010115.52115.5205.955.120 Flavonoids 1 Naringin 4.1315.214202.1020192.05215.6805.1415.4502 Rutin 5.2340.022500.410201.88330.8507.368.603 Quercetin 71100.131201.0111400.12540.63448.52700.6315.755.4914.884 Kaempferol 8210.4120510.482184.060150.063.2207.095 Luteolin 91115.077190.12610.032539.41380.78650.4113.417.489.526 Apigenin 100177.0300189.58005.4907 Catechin 12560.411195.255180.451420.7320.0999.4110.316.783.12
Table 2. The profiles of GC-MS analysis compounds extracted and identified, based on a NIST library, from Adhatoda vasica proliferated shoots (30-day-old)-treated different Cobalt (0, 50, 400 µM) concentrationsNo.Compound NamesMolecular FormulaRTCobalt (µM)Molecular Weight(min)% Area under the peakMF score05040005040016,8-Dioxabicyclo(3.2.1)octa N-3 L-OL-3-D1C_6_H_9_DO_3_5.0601.1700766013126,8-Dioxabicyclo(3.2.1)octa N-3á-OL-2,2,4,4-D4C6H_6_D_4_O_3_5.1400.2400775013432-(2-Aminoethylamino)ethanolC_4_H_12_N_2_O5.480.190070500104.1542-Decenoic Acid (monounsaturated medium-chain fatty acid)C_10_H_18_O_2_6.80.450074800170.2552-Nitrohept-2-en-1-olC_7_H_13_NO_3_6.910.310071300159.186Benzoic Acid, TMS derivativeC_10_H_14_O_2_Si8.6700.840.660701877194.37(-)-NepetalactolC_10_H_16_O_2_1001.02007170168.2389,10-Secochola-5,7,10(19)-Trie ne-3,24-Diol, (3á,5Z,7E)-C_24_H_38_O_2_10.08000.7400752358.69Ascaridole epoxideC_10_H_16_O_3_10.0900.71007470184.2310Methyl anthranilateC_8_H_9_NO_2_10.4401.09007400151.16113-(1-Piperidinylmethyl)-1,3- Benzothiazole-2(3 H)-Thione #C_13_H_16_N_2_S_2_10.6502.95007390264.412Piperidine, 2,3-dimethyl-C_7_H_15_N10.71002.6200736113.213à-Pyrrolidone, 5-[3-hydroxybutyl]-C_8_H_15_NO_2_11.13000.8500702157.21142-MethylpiperidineC_6_H_13_N11.1402.200808099.1715Pyrrolizin-1,7-dione-6-carboxylic acid, methyl(ester)C_9_H_11_NO_4_12.350.40.807047080197.1916{[4-({[4-(Diethyl amino)phenyl]methylidene}amino)benzoyl]amino}acetic acidC_20_H_23_N_3_O_3_13.950.880070200454.417Anthranilic acid, TMS derivativeC_10_H_15_NO_2_Si13.9602.922.350933940209.3218Securinol B (Virosine B)C_13_H_17_NO_3_14.790.390072200235.28196,9-Octadecadiynoic acid, methyl esterC_19_H_30_O_2_15.340.6200.377070761290.42011,14-Octadecadiynoic acid, methyl esterC_19_H_30_O_2_15.3601.12007130290.42110-Methyltricyclo[4.3.1.1(2,5)]unde can-10-ol (10-Methyltricyclo[4.3.1.1(2,5)]undecan-10-ol)C_12_H_20_O15.602.23007520180.29223,7,11,14,18-Pentaoxa-2,19-disilaeicosane, 2,2,19,19-tetramethyl-C_17_H_40_O_5_Si_2_17.8702.9100736038023[1,1’-Bicyclopropyl]-2-octanoic acid,2’-hexyl-, methyl esterC_21_H_38_O_2_18.030.3500.927650716322.5242(4 H)-benzofuranone, 5,6,7,7 A-tetrahydro-6-hydroxy-4,4,7 A-trimethyl-, (6 S-CIS)-C_11_H_16_O_3_19.4603.41.380845825196.24259,12,15-Octadecatrienoic acid,2,3-bis(acetyloxy)propyl ester, (Z, Z,Z)-C_25_H_40_O_6_19.470.330079900436.626Acetamide, N-methyl-N-[4-[2-acetoxymethyl-1-p yrrolidyl]-2-butynyl]-C_14_H_22_N_2_O_3_20.3901.74007310266.3427Corymbolone (a eudesmane sesquiterpenoid)C_15_H_24_O_2_20.5800.72007380236.35281,3,5-Triazine-2,4-diamine,6-chloro-n-ethyl-C_5_H_8_ClN_5_22.010.550.5208378180173.629Ethanol, 2-(9-octadecenyloxy)-, (Z)-C_20_H_40_O_2_22.150.70077900312.53013-Heptadecyn-1-olC_17_H_32_O22.1800.89007380252.431Myristic acid, TMS derivativeC_17_H_36_O_2_Si22.340.720073400300.632à-D-Galactopyranose, 6-O-(trimethylsilyl)-, cyclic 1,2:3,4-bis(methylboronate)C_11_H_22_B_2_O_6_Si22.35000.640070830033Peganine (Vasicine)C_11_H_12_N_2_O22.841.973.943.08724819766188.23347-Methyl-Z-tetradecen-1-ol acetateC_17_H_32_O_2_22.980.160074100268.4351 H-Cyclopenta(b)quinoline, 2,3,5,6,7,8-hexahydro-9-amino-C_12_H_16_N_2_2302.67007510188.27361 H-Indole, 3-Methyl-2-(3-Methyl-3 H-IN DOL-3-YL)-C_18_H_16_N_2_23.130011.1400882260.3375-Benzofuranacetic acid, 6-ethenyl- 2,4,5,6,7,7a-hexahydro-3,6-dimethyl-à-methylene-2-oxo-,methyl esterC_16_H_20_O_4_23.160.420065500348.03389-Amino-2,3,5,6,7,8-hexahydro-1 H-cyclopenta(b)quinolineC_12_H_16_N_2_23.1603.500748018839Hexadecanoic acid, methyl esterC_17_H_34_O_2_23.634.4405.998217980270.540n-Hexadecanoic acidC_16_H_32_O_2_24.56.130084200256.4241Estra-1,3,5(10)-trien-17á-olC_18_H_24_O24.602.030.80711742256421,5,9-Trimethyl-2-Oxatricyclo[7.3.0.0(3,8)]Dodec-3(8),4,6-TrieneC_14_H_18_O24.86012.421.980884852202.2943Spiro[S-Indacene-2(1 H),2’-[2 H] Inden]-1-ONE, 1’,3,3’,5,6,7-Hexahydro-C_20_H_18_O25.9804.5008370274.444Hexadecanoic acid, Trimethylsilyl EsterC_19_H_40_O_2_Si26.1415.723.885.09933749873328.645N-[5,9-Dimethyl-1-(3-Phenyl- 2-Oxiranyl)-4,8-Decadienyl Idene]-2-Phenyl-1-Aziridina MineC_28_H_34_N_2_O26.41000.3400708414.646Ethyl(9Z,12Z)-9,12-OctadecadienoateC_20_H_36_O_2_26.633.2904.888830860308.5479-Octadecenoic acid (Z)-,Methyl EsterC_19_H_36_O_2_26.811.59021.928870951296.5489-Octadecenoic acid (Z)-C_18_H_34_O_2_26.821.840.3109007080282.5491 H-Cycloprop[e]azulen-7-ol, decahydro-1,1,7-trimethyl-4-methyle ne-, [1ar-(1aà,4aà,7á,7aá,7bà)]-C_15_H_24_O27.04000.3800755220.3550á-VatireneneC_15_H_22_27.1500.94007470202.3351Octadecanoic acid, Methyl EsterC_19_H_38_O_2_27.370.930079900298.552Methyl-9,9,10,10 -OctadecanoateC_19_H_38_O_2_27.3900.4007460302538,11,14-Eicosatrienoic acid, (Z, Z,Z)-C_20_H_34_O_2_27.532.820082300306.5549,12-Octadecadienoyl chloride, (Z, Z)-C_18_H_31_ClO27.623.9702.638360787298.9555,8,11,14-Eicosatetraenoic acid, methyl ester, (all-Z)-C_21_H_34_O_2_27.70.883.040.7785789754318.556Octadecanoic acidC_18_H_36_O_4_28.1802007560284576-[1-(hydroxymethyl)vinyl]-4,8 A-dimethyl-1,2,4 A,5,6,7,8,8 A-octahydro-2-naphthalenolC_15_H_24_O_2_28.18000.540072023658N-Isobutylundeca-2(E)-en-8,10-diyn amideC_15_H_21_NO28.28000.3200749231.3359Cinnamic acid, 4-hydroxy-3-methoxy-, (5-hydroxy-2-hydroxymethyl-6-[2-(4- hydroxy-3-methoxyphenyl)ethoxy]-4- (6-methyl-3,4,5-trihydroxytetrahydro pyran-2-C_31_H_40_O_15_28.79000.1970900652.6609,12-Octadecadienoic acid (Z, Z)-, Trimethylsilyl EsterC_21_H_40_O_2_Si28.941.540084600352.6619,12,15-Octadecatrienoic acid, 2,3-bis[(trimethylsilyl)oxy]propyl ester, (Z, Z,Z)-C_27_H_52_O_4_Si_2_29.080.71.590.39765771805496.9625,8,11-Eicosatrienoic acid, (Z)-,TMS derivativeC_23_H_42_O_2_Si29.10.990.520.971800378634 A,7-Ethano-4AH-Benzocyc Lohepten-5(2 H)-ONE, 1,3,4,6,7,8-Hexahydro-1,1,7-TR Imethyl-, (.+-.)-C_16_H_24_O29.57000.400886232.3664Furoscrobiculin BC_15_H_20_O_2_29.620.426.030.97771785758232.32652,2-dideutero octadecanalC_18_H_36_O30.151.550074100270.566Furosta-5,20(22)-dien-3,26-diolC_27_H_42_O_3_30.730.270.710.34733747708414.667Cyclopropanedodecanoic acid,2-octyl-, methyl esterC_24_H_46_O_2_30.810.250073700366.668Ethyl iso-allocholateC_26_H_44_O_5_31.521.510.950.62746786788436.6699-Hexadecenoic acidC_16_H_30_O_2_32.150.490075400254.41703 H-Cyclodeca[b]furan-2-one,4,9-dihydroxy-6-methyl-3,10-dimethy lene-3a,4,7,8,9,10,11,11a-octahydro-C_15_H_20_O_4_32.870.790.780.22787767776264.32715-Benzofuranacetic acid, 6-ethenyl-2,4,5,6,7,7a-hexahydro-3,6 -dimethyl-à-methylene-2-oxo-, methyl esterC_16_H_20_O_4_32.900.72008140276.33724,7-Octadecadiynoic acid, methyl esterC_19_H_30_O_2_33.110.630073800290.473Hexanoic acid, pentadecyl esterC_21_H_42_O_2_33.40.890074200326.6747-Methyl-Z-tetradecen-1-ol acetateC_17_H_32_O_2_33.430.30.7107427470268755,9-METHANO-5 H-[1,4,2,3]DIOX ADIAZOLO[2,3-A][1,2]DIAZEPIN =-2-AMINEC_13_H_17_N_3_O_2_33.821.963.5207777770247.2976Diisooctyl phthalate (Artifact)C_24_H_38_O_4_33.82007.2900923390.677Pregan-20-one, 2-hydroxy-5,6-epoxy-15-methylC_22_H_34_O_3_33.9900.780.73076273234678Androst-5,7-dien-3-ol-17-oneC_19_H_26_O_2_34.0101.47007490286.479Dodecanoic acid,2,3-bis(acetyloxy)propyl esterC_19_H_34_O_6_34.540.460076200358.5805á-Hydroxyneoverrucosa NEC_20_H_34_O35.36001.7800745290.581FalcarinolC_17_H_24_O36.430.340000711244.3782Cyclopropanebutanoic acid, 2-[[2-[[2-[(2-pentylcyclopropyl)meth yl]cyclopropyl]methyl]cyclopropyl] methyl]-, methyl esterC_25_H_42_O_2_36.960.301.167730755374.683Cholestan-3-ol, 2-methylene-,(3á,5à)-C_28_H_48_O38.22000.500819400.784Methyl 10,12-pentacosadiynoateC_26_H_44_O_2_41.5800.41008040388.685Retinol, acetateC_22_H_32_O_2_44.263.240078500328.5861-HeptatriacotanolC_37_H_76_O44.263.241.240.7778878277853787Butyl 4,7,10,13,16,19-docosahexaenoateC_26_H_40_O_2_44.302.15007820384.688LupeolC_30_H_50_O_2_46.9127.450082200426.7
Table 3. The Vina scores for the molecular docking of alkaloids, phenolics, and flavonoids with anti-ssDNA antigen-binding fragment (PDB code: 1P7K). Energies are in kcal/molAlkaloidsScorePhenolicsScoreFlavonoidsScorePyridine-3-carbonitrile-6.4Catechol-4.8Naringin-9.2Peganine-6.7Syringic-6.0Rutin-8.7Furoscrobiculin B-7.2Caffeic-6.4Quercetin-8.1Anthranilic-silyl-ester-6.2Pyrogallol-5.0Kaempferol-7.6Eicosatetraenoic-6.0Ferulic-6.4Luteolin-7.7Octadecatrienoic-6.1Salicylic-5.5Catechin-7.7Octadecatrienoic-silyl-ester-6.2Cinnamic-5.9Apigenin-7.6Vasicine-6.7P-Coumaric-6.2Vasicinone-7.0Vasicinol-7.0Vasicoline-7.2
Flavonoid profiles
Flavonoid profiles were analyzed via HPLC (Figs. 5 A-B, Table 1, Fig. S2). Naringin and rutin showed biphasic responses, increasing by 200.58% and 16.85% at 50 µM Co, respectively, but were undetectable at 400 µM. Quercetin decreased by 65.14% at 50 µM and 5.52% at 400 µM. Kaempferol was undetectable at 50 µM but increased by 120.19% at 400 µM. Luteolin decreased by 44.22% at 50 µM and 29.01% at 400 µM. Apigenin (5.49 µg mL⁻¹) was detected only at 50 µM. Catechin decreased by 34.24% at 50 µM and 69.74% at 400 µM.
Principal component analysis
Principal component analysis was used to assess variations in phenolic and flavonoid profiles (Fig. 5B). PC1 and PC2 explained 94.19% of the variance. Under control conditions, positive correlations were observed between catechol, syringic acid, catechin, luteolin, and quercetin. At 50 µM Co, correlations shifted, with negative correlations for these compounds and positive correlations for cinnamic acid, pyrogallol, naringin, and rutin. At 400 µM Co, negative correlations persisted for control and 50 µM parameters, with positive correlations for caffeic acid, ferulic acid, and kaempferol. Gallic acid, salicylic acid, and apigenin showed positive correlations across treatments.
GC-MS analysis
GC-MS analysis identified 44, 42, and 36 metabolites in A. vasica shoots under 0, 50, and 400 µM Co treatments, respectively (Fig. 5C; Table 2, Table S2, Fig. S1). Component analysis showed clear separation between control and Co-treated samples. Nine metabolites, including vasicine (C₁₁H₁₂N₂O) and furoscrobiculin B (C₁₅H₂₀O₂), were consistent across treatments, with vasicine and furoscrobiculin B increasing by 100.00-1335.71% and 56.34-130.95% at 50 and 400 µM Co, respectively. Five metabolites, including hexadecanoic acid (C₁₉H₄₀O₂Si), decreased by 9.09–76.23% across Co treatments. Two metabolites (5,8,11,14-eicosatetraenoic acid and 9,12,15-octadecatrienoic acid) showed biphasic responses, increasing at 50 µM (245.45% and 127.14%) and decreasing at 400 µM (20.45% and 44.29%). Four metabolites were unique to 50 µM Co, with two increasing (e.g., pyrrolizin-1,7-dione-6-carboxylic acid, 100.00%) and two decreasing. Six metabolites were unique to 400 µM Co, with four increasing (e.g., 9-octadecenoic acid, 1278.62%) and two decreasing. Twenty-four metabolites were unique to the control, including methotrexate (C₂₀H₂₂N₈O₅) and lupeol (C₃₀H₅₀O₂).
Molecular docking of some secondary metabolites
Molecular docking was performed to evaluate interactions between A. vasica metabolites (alkaloids, phenolics, and flavonoids) and the skin cancer-related protein anti-ssDNA antigen-binding fragment, a serine/threonine kinase involved in cytoskeletal regulation (Table 3). Phenolics showed the lowest binding affinities (-4.8 to -6.4 kcal/mol), with syringic acid forming hydrogen bonds with TYR 30, SER 171, ASP 167, and ASP 165, an ionic interaction with LYS 103, and a hydrophobic interaction with PHE 83 (Fig. 6). Flavonoids exhibited the highest affinities, with apigenin and kaempferol at -7.6 kcal/mol and naringin at -9.2 kcal/mol. Naringin formed 10 hydrogen bonds (with LYS 142, ASP 165, LYS 103, ALA 9, GLY 101, ALA 100, TYR 87, SER 85, GLN 43, GLY 42), a cation-π interaction with LYS 103, π-π stacking with TRP 163, and hydrophobic interactions with LYS 142, TYR 173, and TRP 163, indicating strong binding to the protein’s active site.
Discussion
Cobalt stress influences the physiological and biochemical responses of A. vasica, revealing its potential as a hyperaccumulator and a source of therapeutic compounds. This study integrates anatomical, biochemical, and computational analyses to elucidate cobalt’s impact on shoot growth, antioxidant defenses, metabolite profiles, and protein interactions, addressing gaps in understanding Co tolerance in medicinal plants.
Leaf anatomy and cobalt translocation
Heavy metal translocation from roots to shoots involves symplastic transport, xylem loading, and foliar uptake [37]. In A. vasica, Co exposure increased xylem and phloem vessel density in leaves in a dose-dependent manner, enhancing water and nutrient transport capacity (Fig. 1). This anatomical adaptation likely facilitates Co movement to shoots, as evidenced by a 7.6-fold increase in shoot Co content at 1000 µM (Fig. 2B). Similar adaptations in Solanum nigrum enable efficient translocation of Co, Cd, and Zn [38]. The increased cell wall tortuosity suggests structural reinforcement, potentially aiding Co sequestration. According to these results, A. vasica may be a Co hyperaccumulator with increased phloem mobility, which is a new finding for this species. Such traits position A. vasica as a candidate for phytoremediation, warranting further field-based studies to validate its efficacy.
Growth responses
Cobalt’s function as a micronutrient supporting cellular homeostasis via interactions with Zn, Ni, and Fe [39] likely explains why the 50 µM treatment enhanced shoot dry weight by 41.45%. However, higher Co levels (100–1000 µM) reduced DW by up to 66.86%, reflecting toxicity-driven inhibition of cell division and photosynthesis (Fig. 2A) [22]. The negative correlation between DW and Co concentrations (r = -0.677, P ≤ 0.01) aligns with studies on wheat, where Co toxicity reduced growth [40]. These results highlight a biphasic response, with low Co promoting growth and high Co inducing stress.
Oxidative stress and antioxidant responses
Cobalt stress disrupts electron transport in chloroplasts and mitochondria, increasing ROS production, including H₂O₂ [41]. Hydrogen peroxide levels rose by 43.71-234.35% at 100–1000 µM Co, correlating strongly with Co concentrations (r = 0.980, P ≤ 0.01; Fig. 2C). Elevated LOX activity at higher Co levels (up to 38.16% increase; Fig. 2D) indicates lipid peroxidation, contributing to membrane damage and growth inhibition (r = 0.899, P ≤ 0.01). Antioxidant enzymes responded variably: SOD and CAT activities increased significantly (up to 385.22% and 355.98%, respectively) at 200–1000 µM Co, reflecting robust ROS scavenging (Figs. 3A, B) [7]. Conversely, POD and APX activities decreased by up to 68.30% and 67.55%, respectively, suggesting that CAT is the primary H₂O₂ scavenger under Co stress (Figs. 3C, D). The negative correlations for POD (r = -0.669, P ≤ 0.01) and APX (r = -0.809, P ≤ 0.01) indicate species-specific responses, differing from Brassica napus, where POD and APX were upregulated [7]. Phenylalanine ammonia‑lyase and PPO activities increased at higher Co levels (up to 32.77% and 33.16%, respectively; Figs. 4A, B), enhancing phenolic and flavonoid synthesis to counter ROS (r = 0.859 and 0.912, P ≤ 0.01) [22].
Secondary metabolite profiles
Cobalt stress altered secondary metabolite profiles in A. vasica, which are critical for stress tolerance and therapeutic potential. Total phenolic and flavonoid contents increased dose-dependently, with maximum increases of 83.15% and 204.29% at 1000 µM Co, respectively (Figs.4C, D). Specific phenolics showed varied responses: caffeic and ferulic acids increased significantly (up to 60.15% and 218.66%), while catechol, syringic acid, pyrogallol, and salicylic acid exhibited biphasic or reduced levels (Fig. 5A; Table 1). Flavonoids like naringin and rutin increased at 50 µM Co (200.58% and 16.85%) but were undetectable at 400 µM, suggesting stress-specific metabolic shifts (Table 1). Principal component analysis revealed that 94.19% of variance was explained by PC1 and PC2, with distinct correlation patterns under Co treatments (Fig. 5B). GC-MS analysis identified 44, 42, and 36 metabolites at 0, 50, and 400 µM Co, respectively, with vasicine and furoscrobiculin B increasing significantly (up to 1335.71% and 130.95%; Table 2). These shifts indicate Co-induced metabolic reprogramming, potentially enhancing antioxidant defenses and stress tolerance [42].
Molecular docking and therapeutic potential
Molecular docking of A. vasica metabolites against the anti-ssDNA antigen-binding fragment (PDB code: 1P7K), a serine/threonine kinase linked to cancer cell invasion, revealed flavonoids as potent inhibitors. Naringin exhibited the highest binding affinity (-9.2 kcal/mol), forming 10 hydrogen bonds and multiple interactions (cation-π, π-π stacking, hydrophobic) with key residues (Fig. 6). Flavonoids outperformed phenolics (-4.8 to -6.4 kcal/mol) and alkaloids, with apigenin and kaempferol at -7.6 kcal/mol. Compared to 5-fluorouracil (-5.8 kcal/mol), a standard anti-cancer drug, naringin’s superior affinity suggests its potential as a skin cancer therapeutic [43]. These findings highlight that A. vasica metabolites, especially flavonoids, are promising therapeutic candidates that need to be validated in vitro.
Implications and future directions
The study demonstrates that A. vasica tolerates Co by employing anatomical adaptations, upregulating antioxidants, and altering its metabolite profile. This suggests the plant could serve as a hyperaccumulator for phytoremediation. The finding of a biphasic growth response alongside dose-dependent metabolite changes highlights the delicate balance between cobalt’s role as both a beneficial micronutrient and a toxic agent. The high binding affinity of flavonoids like naringin to anti-ssDNA antigen-binding fragment suggests therapeutic applications, particularly for skin cancer. Future research should validate hyperaccumulation in field conditions, explore mechanistic links between anatomical changes and Co transport, and conduct in vitro assays to confirm docking predictions. These discoveries may improve the application of A. vasica in drug development and phytoremediation.
Conclusion
This study elucidates the multifaceted responses of A. vasica shoots to Co stress, examining leaf anatomy, antioxidant enzyme activity, secondary metabolite profiles, and molecular interactions. Cobalt exposure induced dose-dependent anatomical changes, including increased xylem and phloem vessel density and cell wall tortuosity, which potentially enhanced Co translocation and supported the hyperaccumulator potential of A. vasica. Low Co concentrations (50 µM) promoted shoot DW by 41.45%, while higher concentrations (100–1000 µM) reduced DW by up to 66.86%, reflecting a biphasic growth response (r = -0.677, P ≤ 0.01). Shoot Co accumulation increased significantly, with a 7.6-fold rise at 1000 µM (r = 0.982, P ≤ 0.01), correlating with anatomical adaptations.
Oxidative stress markers, including H₂O₂ and LOX activity, increased dose-dependently (up to 234.35% and 38.16%, respectively), indicating ROS-mediated damage (r = 0.980 and 0.899, P ≤ 0.01). Antioxidant defenses were robust, with SOD and CAT activities rising significantly (up to 385.22% and 355.98%; r = 0.904 and 0.941, P ≤ 0.01), while POD and APX activities decreased (up to 68.30% and 67.55%; r = -0.669 and − 0.809, P ≤ 0.01), suggesting CAT’s primary role in H₂O₂ detoxification. Phenylalanine ammonia‑lyase and PPO activities increased (up to 32.77% and 33.16%; r = 0.859 and 0.912, P ≤ 0.01), driving phenolic and flavonoid synthesis.
Secondary metabolite profiles shifted significantly, with total phenolic and flavonoid contents increasing by 83.15% and 204.29% at 1000 µM Co, respectively. Specific metabolites exhibited biphasic responses: caffeic and ferulic acids increased (up to 60.15% and 218.66%), while naringin and rutin surged at 50 µM (200.58% and 16.85%) but were undetectable at 400 µM. Principal component analysis explained 94.19% of variance, revealing distinct metabolite correlations under Co stress. The number of metabolites identified by GC-MS decreased with increasing Co concentration (44 at 0 µM, 42 at 50 µM, and 36 at 400 µM). Furthermore, the dramatic increase in vasicine (1335.71%) and furoscrobiculin B (130.95%) suggests these compounds play a key role in cobalt tolerance.
Molecular docking against the skin cancer-related protein anti-ssDNA antigen-binding fragment (PDB code: 1P7K) showed flavonoids, particularly naringin (-9.2 kcal/mol), with superior binding affinities compared to phenolics (-4.8 to -6.4 kcal/mol) and 5-fluorouracil (-5.8 kcal/mol). Naringin’s interactions, including 10 hydrogen bonds, cation-π, π-π stacking, and hydrophobic contacts, highlight its potential as an anti-cancer agent for basal cell carcinoma. These findings underscore the Co tolerance mechanisms and therapeutic potential of A. vasica, paving the way for drug development and phytoremediation applications.
Supplementary Information
Below is the link to the electronic supplementary material.
Supplementary Material 1