The interplay of APOE and APOA1 gene polymorphisms modulates the risk of type 2 diabetes mellitus in an obese population: a case–control study"
Nagla Usama, Amr E. Ahmed, Salma Mekheimer, Khaled Elhadidy, Mahmoud Farid

TL;DR
This study finds that specific genetic variations in APOE and APOA1 genes are linked to a higher risk of type 2 diabetes in obese individuals.
Contribution
The study reveals independent associations of APOE ε4 and APOA1 rs5069 A alleles with obesity-related T2DM, despite no significant gene-gene interaction.
Findings
APOE ε4 allele and ε4/ε4 genotype are significantly associated with obese T2DM compared to controls and euglycemic obese subjects.
APOA1 rs5069 A allele and AA genotype are linked to both obesity and T2DM.
APOE and APOA1 genotypes show positive co-occurrence in obese individuals but not in non-obese T2DM individuals.
Abstract
Genetic factors play an important role in metabolic disease susceptibility. Apolipoproteins E (APOE) and A1 (APOA1) are key regulators of lipid metabolism and have been individually associated with dyslipidemia and type 2 diabetes mellitus (T2DM). This study aimed to examine the individual and combined associations of APOE (rs429358, rs7412) and APOA1 (rs5069) gene polymorphisms with obesity and T2DM. A case–control study was conducted including 350 participants categorized into four groups: controls (n = 100), euglycemic obese individuals (n = 100), obese individuals with T2DM (n = 100), and non-obese individuals with T2DM (n = 50). Biochemical parameters, including lipid profiles and glycemic indices, were assessed. Genotyping was performed using TaqMan® SNP genotyping assays. Metabolic disturbances and dyslipidemia were observed across all patient groups, with the most pronounced…
Genes, proteins, chemicals, diseases, species, mutations and cell lines named across the full text — each resolved to its canonical identifier and authoritative record.
Click any figure to enlarge with its caption.
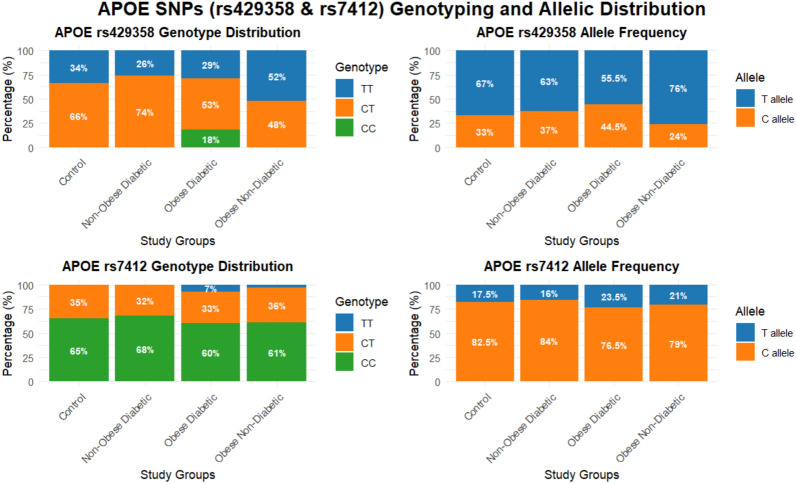 Figure 1
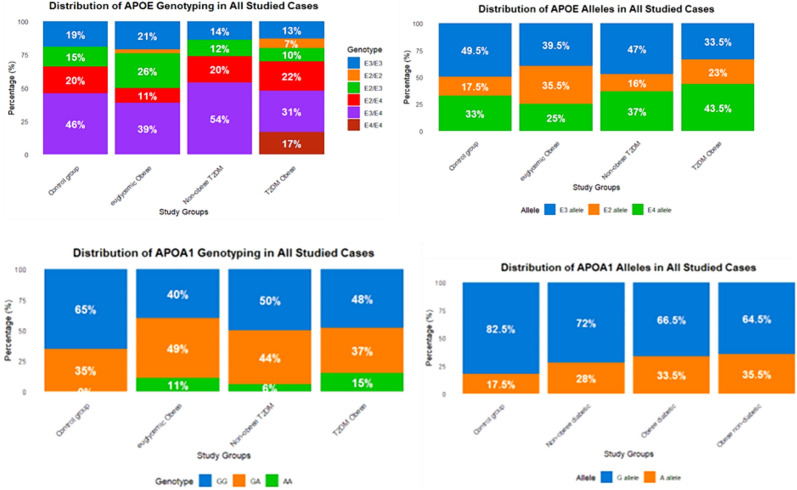 Figure 2
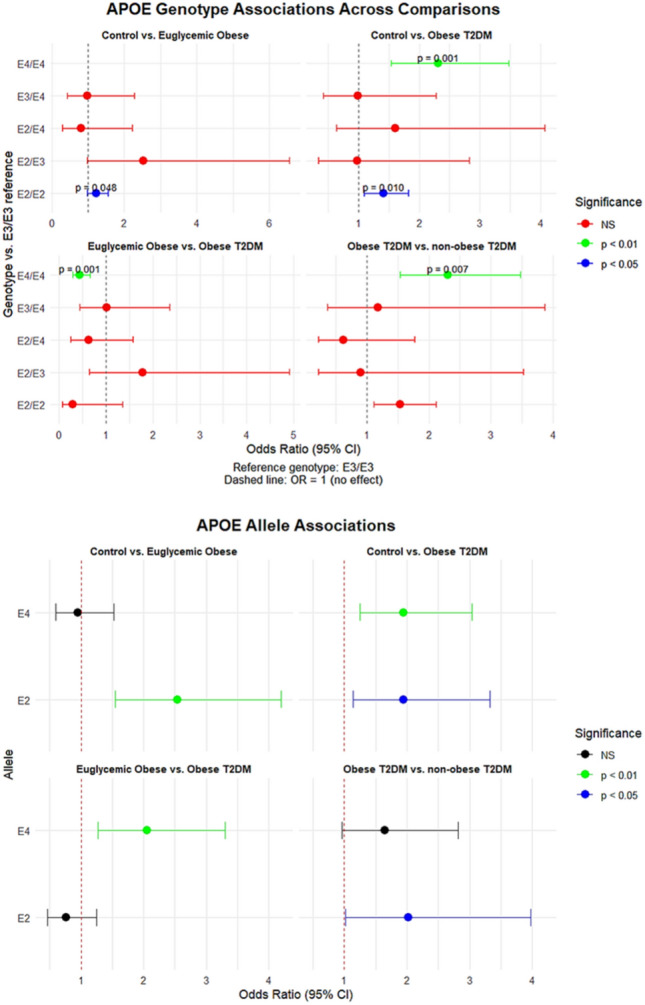 Figure 3
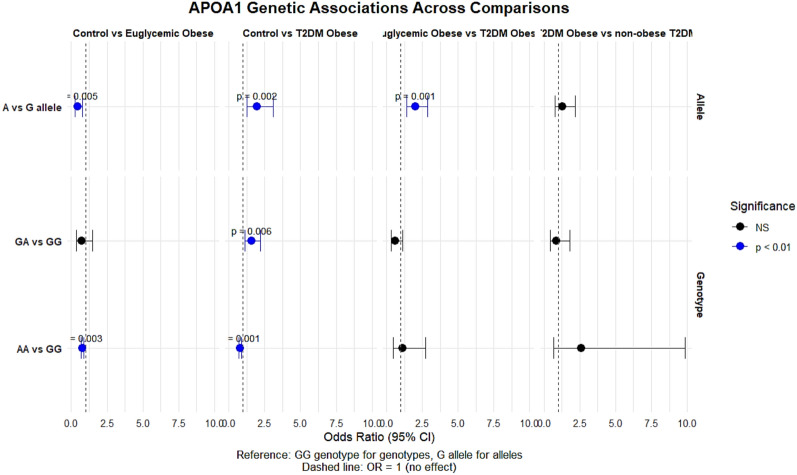 Figure 4
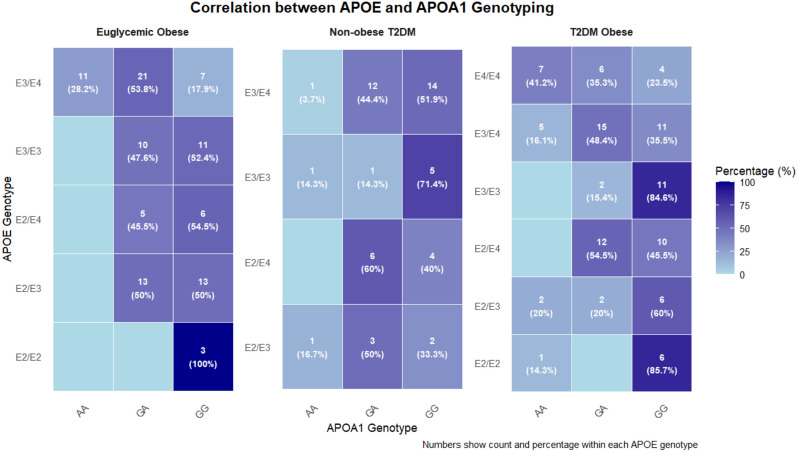 Figure 5
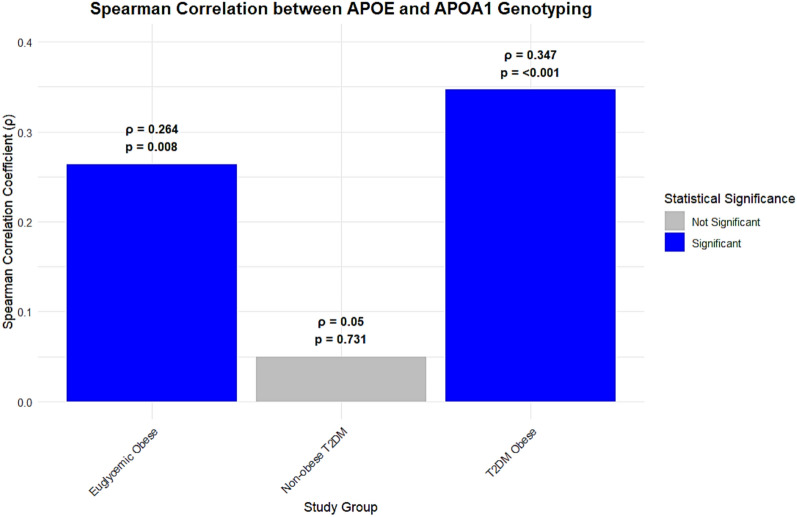 Figure 6
- —Misr University for Science & Technology
Peer Reviews
No public reviews on file for this paper yet. If you reviewed it on a platform where reviews are public (OpenReview, ICLR, NeurIPS, ICML), you can paste yours below so the community can read it here.
Videos
No videos yet. Explain this paper in a talk, walkthrough, or lecture? Add one.
Taxonomy
TopicsDiabetes, Cardiovascular Risks, and Lipoproteins · Peroxisome Proliferator-Activated Receptors · Cholesterol and Lipid Metabolism
Introduction
Obesity and type 2 diabetes mellitus (T2DM) represent major global public health challenges, with a steadily rising prevalence that contributes substantially to cardiovascular morbidity and mortality [1]. Both conditions are closely associated with insulin resistance, dyslipidemia, and chronic low-grade inflammation, which together constitute core components of the metabolic syndrome [2].
Apolipoproteins play a central role in lipid metabolism, a process frequently disrupted in metabolic disorders [3]. Apolipoprotein E (APOE), a key ligand involved in lipoprotein receptor–mediated clearance, exists in three major isoforms (ε2, ε3, and ε4) encoded by polymorphisms in the APOE gene (rs429358 and rs7412) [4]. Two coding single-nucleotide polymorphisms (SNPs) in exon 4 of APOE—rs429358 (T → C) and rs7412 (C → T)—determine these isoforms. Specifically, ε2 corresponds to rs429358-T/rs7412-T (Cys112, Cys158), ε3 to rs429358-T/rs7412-C (Cys112, Arg158), and ε4 to rs429358-C/rs7412-C (Arg112, Arg158). These structural differences influence receptor binding affinity and lipid transport behavior, contributing to interindividual variability in lipid metabolism and disease susceptibility [5]. The ε4 allele has been consistently associated with hypercholesterolemia and cardiovascular disease, and accumulating evidence suggests that APOE polymorphisms may also be associated with insulin sensitivity and T2DM risk, although findings across populations remain heterogeneous.
Apolipoprotein A1 (APOA1), the principal protein component of high-density lipoprotein (HDL), is essential for reverse cholesterol transport and endothelial function [6]. Genetic variation within the APOA1 gene, including the rs5069 polymorphism, has been associated with differences in HDL cholesterol levels and functionality, suggesting potential links to insulin resistance and diabetes [7].
These metabolic pathways do not operate independently. The close relationship between dyslipidemia and insulin resistance is well established, with obesity acting as a shared metabolic context in which both abnormalities frequently coexist and intensify [8]. In this setting, genetic variation in lipid-related genes such as APOE and APOA1 may show coordinated distribution patterns or context-dependent associations with metabolic traits [9, 10]. APOE and APOA1 were selected for the present study because they occupy complementary roles in lipid metabolism and inflammation: APOE variants influence the clearance of triglyceride-rich lipoproteins and adipose tissue immunometabolism, whereas APOA1 rs5069 has been linked to alterations in HDL structure and function. Obesity amplifies metabolic pathways governed by both genes, making their combined evaluation particularly relevant for obesity-related T2DM. Despite extensive literature examining each gene individually, their combined patterns of association within obesogenic metabolic environments especially in Middle Eastern and North African populations remain relatively underexplored, providing a rationale for the present investigation [11, 12].
Accordingly, this case–control study employed a multi-group design to address two main objectives: first, to examine whether polymorphisms in APOE and APOA1 are independently associated with obesity and T2DM; and second, to explore whether patterns of co-occurrence or interaction between these variants differ according to obesity status. By comparing healthy controls with euglycemic obese, obese T2DM, and non-obese T2DM individuals, we aimed to assess the individual and combined associations of APOE (rs429358, rs7412) and APOA1 (rs5069) polymorphisms with obesity and T2DM.
Materials and methods
Study design and population
A case–control study was conducted at the Diabetic Clinic of Memorial Souad Kafafi University Hospital, Egypt. A total of 350 participants aged 35–55 years were recruited and classified into four groups:
- Control group (n = 100): apparently healthy, non-diabetic individuals with a body mass index (BMI) < 25 kg/m^2^.
- Euglycemic obese group (n = 100): non-diabetic individuals with BMI ≥ 30 kg/m^2^ and no first-degree family history of diabetes.
- Obese T2DM group (n = 100): individuals with T2DM and BMI ≥ 30 kg/m^2^.
- Non-obese T2DM group (n = 50): individuals with T2DM and BMI < 25 kg/m^2^.
The diagnosis of T2DM was established according to the American Diabetes Association (ADA) criteria [13]. Exclusion criteria for all participants included type 1 diabetes mellitus, hepatic or renal impairment, familial dyslipidemia, metabolic bone diseases, malignancy, pregnancy, lactation, current smoking, and use of medications known to affect lipid metabolism.
Written informed consent was obtained from all participants prior to enrollment. The study protocol was approved by the Ethics Committee of Misr University for Science and Technology (MUST; FWA00025577) and conducted in accordance with the Declaration of Helsinki.
Data and sample collection
Following an overnight fast, venous blood samples were collected from all participants. Samples were divided as follows: blood collected in plain tubes was allowed to clot and centrifuged to obtain serum for biochemical analyses, while blood collected in EDTA-containing tubes was used for genomic DNA extraction. A structured questionnaire was administered to collect demographic data (age and sex), anthropometric measurements (weight, height, and BMI), medical history, and information on current medication use.
Biochemical analysis
Biochemical assessments included fasting blood glucose (FBS), fasting insulin, glycated hemoglobin (HbA1c), and lipid profile parameters (total cholesterol, triglycerides, high-density lipoprotein cholesterol [HDL-C], low-density lipoprotein cholesterol [LDL-C], and triglyceride-to-HDL-C ratio). Insulin resistance was estimated using the homeostasis model assessment of insulin resistance (HOMA-IR) formula [14]:
\documentclass[12pt]{minimal} \usepackage{amsmath} \usepackage{wasysym} \usepackage{amsfonts} \usepackage{amssymb} \usepackage{amsbsy} \usepackage{mathrsfs} \usepackage{upgreek} \setlength{\oddsidemargin}{-69pt} \begin{document}$${\mathrm{HOMA}} - {\mathrm{IR}} = \frac{{{\text{fasting insulin}} \left( {\mu {\mathrm{U}}/{\mathrm{mL}}} \right) \times {\text{fasting glucose}} \left( {{\mathrm{mmol}}/{\mathrm{L}}} \right)}}{22.5}$$\end{document}All biochemical measurements were performed using validated automated analyzers with commercially available kits (Spectrum Diagnostics, Erba Mannheim, and Chemux Bioscience).
Genotyping analysis
Genomic DNA was extracted from whole blood using the GeneJET Whole Blood Genomic DNA Purification Kit (Thermo Scientific, Waltham, MA, USA). DNA concentration and purity were assessed spectrophotometrically. Genotyping of APOA1 (rs5069) and APOE (rs429358 and rs7412) single-nucleotide polymorphisms was performed using TaqMan^®^ SNP Genotyping Assays (Applied Biosystems, Foster City, CA, USA) according to the manufacturer’s instructions. Real-time PCR amplification was conducted using the QuantStudio™ 5 Real-Time PCR System (Applied Biosystems).
Statistical analysis
Statistical analyses were performed using IBM SPSS Statistics for Windows (version 26.0) and R software (version 4.5.0; R Foundation for Statistical Computing, Vienna, Austria). The normality of continuous variables was assessed using the Shapiro–Wilk test. Data are presented as mean ± standard deviation (SD) for normally distributed variables and as frequencies and percentages for categorical variables.
Between-group comparisons for continuous variables were conducted using one-way analysis of variance (ANOVA), followed by appropriate post-hoc tests. Genotype and allele frequencies were compared using the chi-square (χ^2^) test. Associations between genotypes and disease outcomes were evaluated by calculating odds ratios (ORs) with 95% confidence intervals (CIs) using binary logistic regression models. Conformity of genotype distributions with Hardy–Weinberg equilibrium (HWE) was assessed using a chi-square test in the control group. Principal component analysis (PCA) was applied to evaluate population stratification. Correlations were assessed using Spearman’s rank correlation coefficient (ρ). All statistical tests were two-tailed, and a p-value < 0.05 was considered statistically significant.
Results
Demographic and biochemical characteristics
Table 1 summarizes the demographic and biochemical characteristics of the study participants. The cohort (N = 350) comprised four age- and sex-matched groups: healthy controls (n = 100), euglycemic obese individuals (n = 100), obese individuals with T2DM (n = 100), and non-obese individuals with T2DM (n = 50). As defined by the study design, BMI differed significantly across groups (p < 0.001), whereas age and sex distributions were comparable. Table 1. Biochemical data analysis for all casesParametersControl Group (N = 100)Euglycemic Obese (N = 100)Obese T2DM (N = 100)Non-obese T2DM (N = 50)p-valueMean (µ ± SD), n%Sex, n (%)Male29 (29%)31 (31%)38 (38%)22 (44%) > 0.05Female71 (71%)69 (69%)62 (62%)28 (56%)Age (years)42.7 ± 3.743.2 ± 4.642.8 ± 5.443.3 ± 3.5 > 0.05BMI (kg/m^2^)24.6 ± 2.2^a^35.6 ± 4.7^b^32.85 ± 3.4^c^24.7 ± 2.2^a^ < 0.001FBS (mg/dL)85.7 ± 9.3^a^105.6 ± 20.2^b^131.3 ± 40.6^c^103.15 ± 23.2^d^ < 0.001HbA1c (%)4.7 ± 0.42^a^5.5 ± 0.7^b^7.8 ± 1.2^c^7.4 ± 0.91^d^ < 0.001Fasting insulin (mU/L)5.4 ± 3.4^a^7 ± 4.8^b^8.2 ± 3.6^c^7.8 ± 4.3^c, d^ < 0.001HOMA-IR1.1 ± 0.7^a^1.8 ± 1.3^b^2.6 ± 1.74^c^1.93 ± 1.01^d^ < 0.001TC (mg/dL)152.5 ± 28.2^a^183.8 ± 38.5^b, c^181.2 ± 40.1^a, c^155.9 ± 29.65^d^ < 0.001TG (mg/dL)129 ± 33.7^a^164.1 ± 62.7^b^148.7 ± 51^c^106.9 ± 32.07^d^ < 0.001HDL-C (mg/dL)55.9 ± 10.2^a^55.5 ± 8.6^a, b^50.1 ± 9.1 ^a, c^55.1 ± 8.4^d^ < 0.001LDL-C (mg/dL)70.0 ± 25.3^a^95.5 ± 33^b^101.3 ± 37.6 ^a, d^79.4 ± 30.1^c^ < 0.001TG/HDL-C ratio1.96 ± 0.721^a^3.05 ± 1.3^b^3.1 ± 1.3^b, c^2.02 ± 0.83^d^ < 0.001Values are presented as mean ± standard deviation. Superscript letters (a, b, c) denote significant differences between groups based on post-hoc analysis; groups sharing a common letter are not significantly different.
Analysis of biochemical parameters demonstrated marked metabolic alterations in the patient groups. Serum 25-hydroxyvitamin D [25(OH)D] levels were significantly lower in the euglycemic obese, obese T2DM, and non-obese T2DM groups compared with controls (all p < 0.001). Glycemic indices including fasting blood glucose (FBS), glycated hemoglobin (HbA1c), fasting insulin, and HOMA-IR were significantly elevated in all patient groups relative to controls (all p < 0.001), with the most pronounced derangements observed in obese individuals with T2DM.
Lipid profile analysis revealed significant dyslipidemia in the obese groups (both euglycemic obese and obese T2DM), characterized by higher total cholesterol, triglycerides, low-density lipoprotein cholesterol (LDL-C), and triglyceride-to-HDL-C ratio, alongside lower high-density lipoprotein cholesterol (HDL-C) levels compared with controls (all p < 0.001). In contrast, the non-obese T2DM group exhibited a lipid profile largely comparable to that of the control group.
Hardy–weinberg equilibrium assessment and population stratification analysis
The genotype distributions of the studied polymorphisms (APOE rs429358, rs7412; APOA1 rs5069) were tested for conformity to Hardy–Weinberg equilibrium (HWE). Deviations from HWE were observed for rs429358 in the control, obese T2DM, and non-obese T2DM groups, and for rs7412 in the obese groups. The APOA1 rs5069 variant significantly deviated from HWE in all study groups. Supplementary Figure S1 displays these findings.
Principal component analysis (PCA) based on encoded APOE and APOA1 genotypes demonstrated extensive overlap among controls, euglycemic obese, obese T2DM, and non-obese T2DM groups. The first two principal components explained 25% and 18.8% of the variance, respectively, yet showed no distinct clustering by group. The 95% confidence ellipses overlapped substantially, indicating a lack of population substructure within the cohort.
To evaluate the representativeness of our sample, we compared the allele frequencies observed in the control group with available population data from gnomAD and ALFA for individuals of North African and Middle Eastern ancestry. The distribution of APOE alleles in our controls, characterized by the predominance of the ε3 allele and lower frequencies of ε2 and ε4, mirrors the pattern reported for regional populations, where ε3 is typically the most common allele (≈70–80%), followed by ε4 (≈10–15%) and ε2 (≈5–10%). Similarly, the allele frequencies of APOA1 rs5069 in our control group fall within the range documented for Middle Eastern and North African cohorts in public databases. This concordance suggests that our control sample is demographically and genetically comparable to reference populations from the region, supporting the generalizability of our findings.
Association of APOE and APOA1 rs5069 polymorphisms with disease phenotype
Comparative analysis demonstrated significant associations between APOE variants and disease status. The rs429358 polymorphism showed robust genotypic differences, particularly between controls and both obese groups (euglycemic and T2DM) (p < 0.001). In contrast, rs7412 showed no significant associations. Figure 1 displays these findings.Fig. 1. The stacked chart illustrates the frequency distribution of APOE (rs429358–rs7412) genotypes and alleles among the studied groups
Table 2 and Fig. 2 summarize the distribution of APOE and APOA1 (rs5069) genotypes and alleles across the study groups. For APOE, significant differences were observed between control and obese groups. The frequency of the E3/E3 genotype declined in obese T2DM subjects (13%) compared with controls (19%) and euglycemic obese individuals (21%) (p < 0.001 and p = 0.005, respectively). The E4/E4 genotype appeared exclusively in the obese T2DM group (17%), contributing to significant group differences. Allele analysis showed higher E2 frequency in euglycemic obese subjects (p < 0.001) and a marked increase in E4 among obese T2DM individuals (p = 0.005 vs. controls; p < 0.001 vs. euglycemic obese). Table 2. The distribution of APOE and APOA1 (rs5069) genotypes and alleles in all studied casesAPOE genotyping & allelesControl group. N = 100Euglycemic Obese N = 100Obese T2DM N = 100Non-obese T2DM N = 50P-valueControl versus Euglycemic ObeseControl versus Obese T2DMEuglycemic Obese versus Obese T2DMObese diabetic versus Non-obese T2DME3/E3 (ref)19 (19%)21 (21%)13 (13%)7 (14%)0.055** < 0.0010.0050.005E2/E203 (3%)7 (7%)0 (0%)E2/E315 (15%)26 (26%)10 (10%)6 (12%)E2/E420 (20%)11 (11%)22 (22%)10 (20%)E3/E446 (46%)39 (39%)31 (31%)27 (54%)E4/E40017 (17%)0 (0%)E3 (ref)99 (45.5%)79 (39.5%)67 (33.5%)47 (47%) < 0.0010.005 < 0.0010.065E235 (17.5%)71 (35.5%)46 (23%)16 (16%)E466 (33%)50 (25%)87 (43.5%)37 (37%)APOA1 genotyping & alleles. rs5069Control group. N = 100Euglycemic Obese N = 100Obese T2DM N = 100Non-obese T2DM N = 50Control versus Euglycemic ObeseControl versus Obese T2DMEuglycemic Obese versus Obese T2DMObese diabetic versus Non-obese T2DMGG (ref)65 (65%)40 (40%)48 (48%)25 (50%) < 0.0010.011 < 0.0010.260GA35 (35%)49 (49%)37 (37%)22 (44%)AA011 (11%)15 (15%)3 (6%)G (ref)165 (82.5%)129 (64.5%)133 (66.5%)72 (72%) < 0.001****0.005**0.6740.334A35 (17.5%)71 (35.5%)67 (33.5%)28 (28%)Bold values indicate significant p-valuesFig. 2The frequency distribution of APOE and APOA1 rs5069 genotypes and alleles among all studied groups.
For APOA1 rs5069, the GG genotype was more common in controls (65%) than in obese groups, while the AA genotype appeared only in obese subjects (p < 0.001). The A allele frequency increased significantly in both obese groups compared with controls (p < 0.001 and p = 0.005). No significant differences were observed between obese T2DM and non-obese T2DM individuals for both genes. Overall, APOE E4-containing genotypes were enriched in obese T2DM subjects, while the APOA1 rs5069 A allele frequency increased across obese groups irrespective of diabetic status.
Table 3, Fig. 3 and 4 summarize the univariate associations of APOE and APOA1 genotypes and alleles with obesity and T2DM across several pairwise group comparisons. When comparing controls with euglycemic obese subjects, significant associations were observed for APOE variants. The E2/E2 genotype showed a borderline-significant positive association with obesity (OR = 1.231, p = 0.048), and the E2 allele demonstrated a strong association with increased odds of obesity (OR = 2.542, p < 0.001). Conversely, the E4 allele showed no meaningful association in this comparison (p = 0.829). For APOA1, the A allele and AA genotype were associated with significantly lower odds of obesity in this comparison (OR = 0.436, p = 0.005 and OR = 0.762, p = 0.003, respectively). Table 3. Associations of APOE and APOA1 (rs5069) genotypes and alleles with the risk of obesity and T2DM compared to controls (univariate analysis)APOE Genotypes/AllelesControl versus Euglycemic obeseControl versus obese T2DMEuglycemic obese versus obese T2DMObese T2DM versus non-obese T2DMOR (95% CI) p-valueE3/E3 (ref)––––E2/E21.231 (0.973–1.557) 0.0481.412 (1.092–1.825) 0.0100.293 (0.064–1.348) 0.1041.538 (1.11–2.122) 0.069E2/E32.533 (0.980–6.547) 0.0530.974 (0.335–2.831) 0.9621.779 (0.645–4.907) 0.2640.897 (0.220–3.520) 0.877E2/E40.804 (0.290–2.228) 0.6741.608 (0.635–4.074), 0.3160.622 (0.245–1.576) 0.3160.618 (0.216–1.773) 0.369E3/E40.985 (0.425–2.281) 0.9720.985 (0.425–2.281) 0.9721.015 (0.438–2.351) 0.9721.185 (0.362–3.873) 0.779E4/E4–2.308 (1.533–3.475) < 0.0010.433 (0.288–0.652)** < 0.0012.308 (1.533–3.475) 0.007E3 (ref)––––E22.542 (1.540–4.197) < 0.0011.942 (1.134–3.326) 0.0150.764 (0.466–1.251) 0.2842.017 (1.022–3.982) 0.041E40.949 (0.592–1.522) 0.8291.948 (1.248–3.041) 0.0032.052 (1.274–3.304) 0.003**1.649 (0.965–2.819) 0.066APOA1 rs5069 Genotype/Allele Control versus Euglycemic obeseControl versus T2DM obeseEuglycemic obese versus T2DM obeseT2DM obese versus non-obese T2DMOR (95% CI) p-valueGG (ref)––––GA0.730 (0.355–1.498) 0.3901.573 (1.135–2.180) 0.0060.629 (0.346–1.145) 0.1280.876 (0.428–1.792) 0.717AA0.762 (0.664–0.875) 0.0030.784 (0.679–0.906) < 0.0011.136 (0.469–2.751) 0.7772.604 (0.688–9.852) 0.148G (ref)––––A0.436 (0.242–0.785) 0.0051.972 (1.247–3.118) 0.0022.029 (1.424–2.891) < 0.0011.295 (0.765–2.192) 0.334Bold values indicate significant p-valuesFig. 3The forest plot illustrates the APOE genotypes and alleles association comparison across studied groupsFig. 4The forest plot illustrates APOA1 genotypes and alleles association comparison across studied groups
In the comparison between controls and obese subjects with T2DM, a different pattern emerged. The APOE E4/E4 genotype demonstrated a significant association with T2DM in obesity (OR = 2.308, p < 0.001), and both the E2 and E4 alleles were associated with higher odds of T2DM-related obesity (E2: OR = 1.942, p = 0.015; E4: OR = 1.948, p = 0.003). For APOA1, both the GA genotype (OR = 1.573, p = 0.006) and the A allele (OR = 1.972, p = 0.002) were associated with higher odds of obese T2DM.
When comparing euglycemic obese individuals to obese individuals with T2DM, the E4 allele remained significantly associated with T2DM in the context of obesity (OR = 2.052, p = 0.003), while the E2 allele did not demonstrate a significant association (p = 0.284). For APOA1, the A allele showed a significant association with T2DM in obese subjects (OR = 2.029, p < 0.001), although genotype-specific comparisons (GA and AA) did not reach statistical significance.
Finally, comparisons between obese T2DM and non-obese T2DM subjects revealed no statistically significant differences for most APOE genotypes or alleles, although the E2 allele showed a modest association (OR = 2.017, p = 0.041). APOA1 genotypes and alleles did not show significant associations in this comparison, suggesting that rs5069 may be more relevant to obesity-linked metabolic changes than to T2DM independent of adiposity.
Interplay between APOE and APOA1 polymorphisms
The interaction between APOE and APOA1 genotypes was assessed (Table 4, Figs. 5 and 6). A significant positive correlation was observed in both the euglycemic obese (ρ = 0.264, p = 0.008) and obese T2DM (ρ = 0.347, p < 0.001) groups. This correlation was stronger in the presence of T2DM. Conversely, in subgroup analyses, the APOE × APOA1 interaction term was not statistically significant in the non-obese T2DM group. However, given the relatively small sample size of this subgroup (n = 50), the study had limited power to detect interaction effects of modest magnitude. Post hoc power analysis indicated that only large interaction effects (OR ≥ 2.5–3.0) could be detected with adequate power, whereas subtler effects may not have been captured. Therefore, the absence of a detected interaction should be interpreted cautiously and does not exclude the possibility of a biologically meaningful interaction in this subgroup. Table 4. The distribution and correlation between APOE genotypes across APOA1 rs5069 genotypes by study groupStudy groupAPOE genotypeAPOA1 rs5069 genotypeTotalStatistical analysisGGGAAAChi-Square χ^2^ (p-value)Spearman Correlation ρ (p-value)Euglycemic Obese (N = 100)E3/E3111002128.3 **(< 0.001)**0.264 **(0.008)**E2/E23003E2/E31313026E3/E47211139E2/E465011Total404911100T2DM Obese (N = 100)E3/E311201330.2 **(0.001)**0.347 **(< 0.001)**E2/E26017E2/E362210E3/E41115531E2/E41012022E4/E446717Total483715100Non-Obese T2DM (N = 50)E3/E351176.01 (0.422)0.050 (0.731)E2/E32316E3/E41412127E2/E446010Total2522350Bold values indicate significant p-valuesFig. 5Illustrates the correlation between APOE and APOA1 genotypes in the study groups (euglycemic obese, non-obese T2DM, and obese T2DM). Each tile represents the number of individuals with a given APOE genotype (rows) and APOA1 genotype (columns). The percentages shown in parentheses indicate the proportion of individuals within each APOE genotype row who carry the specified APOA1 genotype (i.e., the percentage of the APOA1 genotype out of the total count for that APOE genotype within the same clinical group). Darker shading indicates a higher percentage. This row-wise percentage representation highlights the distribution of APOA1 genotypes within each APOE background and facilitates comparison of genotype patterns across the three metabolic groupsFig. 6The bar chart illustrates a significant spearman correlation between APOE and APOA1 genotyping across studied groups
Table 5 shows A multivariate binary logistic regression model was constructed to evaluate the independent and joint effects of APOE ε4 carriage, APOA1 rs5069 A-allele carriage, and their interaction on the risk of T2DM, adjusting for sex, age, and BMI. The model was statistically significant overall (χ^2^ = 13.139, p = 0.041), although it explained a modest proportion of the variance in T2DM risk (Nagelkerke R^2^ = 0.049) and had an overall classification accuracy of 60.3%. Table 5. Multivariate logistic regression model examining the effects of APOE, APOA1, their interaction, and clinical covariates on T2DM riskPredictor VariableBSEWaldp-valueOR (Exp B)APOA1_A (A-carrier) − 0.4170.4021.0720.3000.659APOE_e4 (ε4-carrier)0.2850.3150.8210.3651.330APOE × APOA1 Interaction0.7260.4902.1970.1382.066Sex0.4560.2313.9110.0481.578Age − 0.0060.0240.0580.8090.994BMI − 0.0010.0190.0040.9520.999
APOE ε4 carriage (OR = 1.330, p = 0.365) and APOA1 A-allele status (OR = 0.659, p = 0.300) were not independently associated with T2DM. The APOE × APOA1 interaction term showed a trend toward increased odds of T2DM (OR = 2.066) but did not reach statistical significance (p = 0.138). Among the covariates, sex emerged as a statistically significant predictor (OR = 1.578, p = 0.048), while age and BMI did not contribute significantly to the model.”
Discussion
This study examined the associations of APOE and APOA1 gene polymorphisms with obesity and type 2 diabetes mellitus (T2DM), with particular attention to their distribution patterns across metabolic phenotypes. Several key observations emerged. First, pronounced dyslipidemia and insulin resistance were confirmed in obese individuals with T2DM, consistent with established metabolic profiles. Second, the APOE ε4 allele and ε4/ε4 genotype were significantly associated with T2DM in the context of obesity. Third, the APOA1 rs5069 A allele and AA genotype were more frequent among obese and diabetic individuals compared with controls. Finally, correlated distribution patterns between APOE and APOA1 genotypes were observed in obese groups but not among non-obese individuals with T2DM, suggesting that adiposity may influence how these genetic variants cluster within metabolic disease states.
All patient groups exhibited significant elevations in glycemic indices (fasting blood glucose, HbA1c, fasting insulin, and HOMA-IR) compared with controls, with obese T2DM participants demonstrating the most severe insulin resistance. Dyslipidemia characterized by elevated total cholesterol, triglycerides, LDL-C, and reduced HDL-C was particularly evident in obese individuals with T2DM. These findings align with previous reports indicating that obesity exacerbates the atherogenic lipid profile associated with T2DM [15, 16]. Clinical and mechanistic studies demonstrate that increased adiposity, especially visceral fat accumulation, amplifies insulin resistance and disrupts lipid metabolism through elevated triglycerides, reduced HDL-C, and increased small dense LDL particles [17]. In contrast, non-obese T2DM participants displayed lipid profiles closer to those of controls, supporting the view that obesity substantially contributes to dyslipidemia in diabetic populations.
Genetic analyses support a role for APOE variation in metabolic disease susceptibility. The enrichment of the ε4 allele in obese individuals with T2DM, relative to both controls and euglycemic obese participants, is consistent with findings from multiple populations. Studies in East Asian cohorts, including the Hakka population in southern China, have reported associations between ε4 (rs429358) and increased T2DM risk accompanied by adverse lipid profiles [18]. Similarly, investigations conducted in Egypt [19, 20], Saudi Arabia [21], Lebanon [22], Iran [23], Mexico [24], and Chile [25] have reported higher frequencies of ε4-containing genotypes among individuals with T2DM or dyslipidemia. Meta-analyses further suggest that the ε2 allele may be associated with obesity or altered lipid metabolism in certain populations [26–28], findings supported by studies such as that of Željko et al. [29]. In the present study, the ε2 allele appeared more closely associated with obesity than with overt diabetes, suggesting a potential role in lipid accumulation without marked glycemic dysregulation.
Regarding APOA1, the rs5069 A allele and AA genotype were significantly more frequent in obese and diabetic groups compared with controls. Apolipoprotein A-I, which constitutes the majority of HDL protein content, plays a critical role in reverse cholesterol transport and anti-inflammatory processes [30–33]. Variants within the APOA1 gene have been associated with alterations in HDL levels and functionality across multiple populations. In our cohort, the absence of the AA genotype in controls and its presence in metabolically affected groups suggest that the rs5069 A allele may be linked to less favorable HDL characteristics. Such alterations could be associated with reduced cholesterol efflux capacity and diminished anti-inflammatory effects, features commonly reported in metabolic disease states [34, 36].
The most distinctive observation of this study was the presence of correlated APOE–APOA1 genotype distributions in obese individuals, including both euglycemic obese and obese T2DM groups, but not in non-obese T2DM participants. This pattern suggests that obesity may provide a metabolic context in which coordinated genetic associations related to lipid metabolism become more apparent. One interpretive framework is that the co-occurrence of the APOE ε4 allele associated with less efficient clearance of triglyceride-rich lipoproteins and the APOA1 rs5069 A allele linked to altered HDL properties may coincide with metabolic environments characterized by impaired lipid handling. However, these observations reflect genotypic co-distribution rather than a confirmed synergistic effect on disease risk.
Consistent with this interpretation, multivariate logistic regression analyses adjusting for age, sex, and BMI did not demonstrate a statistically significant APOE × APOA1 interaction on T2DM risk. Although the interaction term yielded an odds ratio greater than two, this estimate did not reach statistical significance (p = 0.138), likely reflecting limited statistical power to detect interaction effects in a moderate-sized cohort. The modest explained variance (Nagelkerke R^2^ = 0.049) indicates that clinical and metabolic factors remain the principal determinants of overt T2DM status, whereas genetic variation may be more relevant earlier in the metabolic trajectory, particularly in shaping lipid metabolism, adiposity, and insulin resistance. The observed association with sex further underscores the contribution of biological and hormonal factors to diabetes susceptibility.
From a mechanistic perspective, obesity is increasingly recognized as a state of chronic low-grade inflammation marked by adipocyte hypertrophy, macrophage infiltration, dysregulated adipokine secretion, and elevated circulating free fatty acids [35–37]. APOE is highly expressed in adipose tissue and participates in triglyceride-rich lipoprotein clearance and immunometabolism regulation. Experimental models have shown that APOE influences adipose tissue expansion, macrophage activation, and inflammasome signaling [38]. The ε4 isoform has been associated with a more atherogenic lipoprotein profile and heightened inflammatory responses [39], features that may be particularly relevant in obesogenic environments. Similarly, APOA1and functional HDL exert anti-inflammatory and antioxidant effects through cholesterol efflux and modulation of macrophage activity [40]. Variants such as APOA1 rs5069 have been linked to altered APOA1 expression and HDL function [41], which in obese individuals may coincide with reduced capacity to counterbalance lipid accumulation and inflammation.
Several limitations of our study should be considered when interpreting the findings. First, deviations from Hardy–Weinberg equilibrium (HWE) were observed for APOE rs429358 in multiple groups and for APOA1 rs5069 across all study categories. To ensure data reliability, we conducted genotyping quality control, including re-genotyping approximately 5% of randomly selected samples, which demonstrated 100% concordance. Principal component analysis (PCA) of the genotype data also showed no evidence of population stratification within the cohort. Importantly, the deviation from HWE for APOA1 rs5069 observed in the control group represents a methodological limitation, as departures from HWE in healthy controls are suboptimal even in the absence of detectable stratification or technical error. While HWE deviations in disease-enriched subgroups may arise from non-random sampling and true genotype–phenotype associations, this issue underscores the need for cautious interpretation of the APOA1 findings and for independent replication in larger, population-based cohorts. Second, the relatively small sample size of the non-obese T2DM group may have reduced statistical power for detecting associations in this subgroup. Third, the case control design precludes establishing causal relationships and restricts interpretation to associations.
Future studies should aim to replicate these findings in larger, ethnically diverse populations and, ideally, through longitudinal designs to clarify temporal relationships between these polymorphisms, obesity, and T2DM. Functional and multi-omics investigations are also needed to elucidate the biological pathways underlying the context-dependent genetic effects observed here and to examine gene–environment interactions that may refine metabolic risk stratification.
In conclusion, this study identifies significant associations between the APOE ε4 allele and T2DM in obese individuals, as well as between the APOA1 rs5069 A allele and both obesity and T2DM. Although APOE and APOA1 genotypes showed correlated distribution patterns in obese groups, the formal gene–gene interaction did not reach statistical significance in multivariable analyses. These findings suggest that obesity may act as a contextual modifier of genetic associations related to lipid metabolism and insulin resistance. Larger, well-powered, and longitudinal studies are needed to determine whether true biological interaction exists between these loci.
Supplementary Information
Additional file 1
The reference list from the paper itself. Each links out to its DOI / PubMed record.
- 1Feingold KR. (Updated 2023 Jun 19). Obesity and Dyslipidemia. In: Feingold KR, Ahmed SF, Anawalt B, et al., editors. Endotext [Internet]. South Dartmouth (MA): MD Text.com, Inc.; 2000-. Available from: https://www.ncbi.nlm.nih.gov/books/NBK 305895//?utm_source=chatgpt.com.
- 2Feng DW, Ma RL, Guo H, He J, Yan YZ, Muratbek, Niu Q, Li SG, Rui DS, Sun F, Zhang M, Zhang JY, Ding YS, Liu JM, Wang K, Guo SX. Association of APOA 1 gene polymorphisms (rs 670, rs 5069, and rs 2070665) with dyslipidemia in the Kazakhs of Xinjiang. Genet Mol Res. 2016. 10.4238/gmr.15028094. PMID: 27173266.10.4238/gmr.1502809427173266 · doi ↗ · pubmed ↗