Calibrated, explainable machine learning on routine laboratory data to characterize diagnostic assignment patterns in rheumatic diseases: a retrospective study of 12,085 patients
Amal Mohamed Elmesiry, Amira Shahin Ibrahim, Hemmat A. Elabd, Basma Mohamed El Naggar, Eman E. Abd Elsalam, Mai Abd El Halim Moussa, Eman A. Rageh, Mona Mokhtar, Muhammad M. Harb, Aya H. Elshazly, Mohamed A. Khalafallah, Atef A. Hassan

TL;DR
This study uses machine learning on lab data to understand how rheumatic diseases are diagnosed, finding that some models can provide reliable, explainable probabilities but struggle with certain conditions like ankylosing spondylitis.
Contribution
The study introduces a calibrated, explainable machine learning approach using routine lab data to characterize diagnostic patterns in rheumatic diseases.
Findings
XGBoost achieved the highest test accuracy (85.48%) among models trained on routine lab data.
Random Forest was selected for interpretation due to superior calibration, with SLE recall at 97.9% and AS recall at 57.6%.
In seronegative patients, HLA-B27 prevalence was higher and anti-La prevalence was lower compared to the general group.
Abstract
Overlap in routine laboratory profiles complicates differential diagnosis of rheumatic diseases, particularly seronegative spondyloarthritis. We examined whether models trained on routine labs reproduce diagnostic assignment patterns and yield calibrated, explainable probabilities. We analyzed a publicly available, fully de-identified dataset (n = 12,085). Adults (≥ 18 years) with confirmed diagnoses and ≤ 30% biomarker missingness were included. Nineteen routine variables (demographics, ESR/CRP, serology) plus four engineered features were used. Missingness (~ 14.5%) was imputed using MICE, variables were standardized, and the data were split 80/20 with stratification. Random Forest, LightGBM, XGBoost, CatBoost, and TabNet were trained with fixed, literature-informed hyperparameters. We assessed 5-fold CV, independent test performance, calibration (Brier/ECE), and SHAP; a predefined…
Genes, proteins, chemicals, diseases, species, mutations and cell lines named across the full text — each resolved to its canonical identifier and authoritative record.
Click any figure to enlarge with its caption.
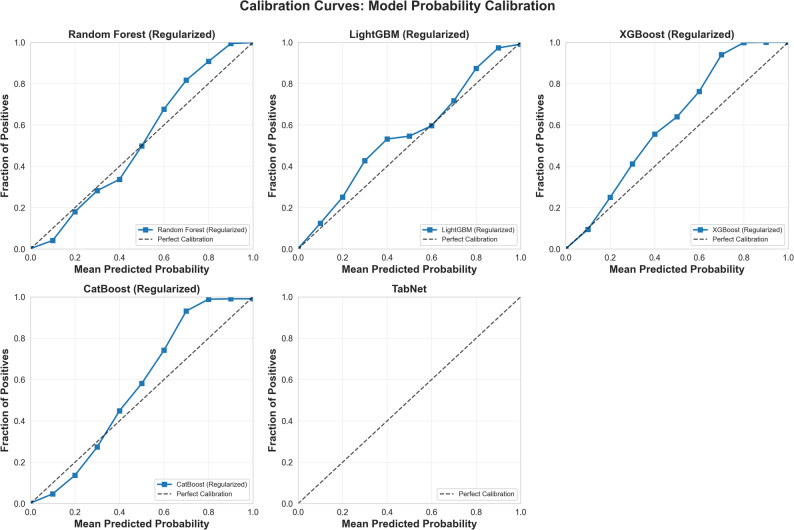 Figure 1
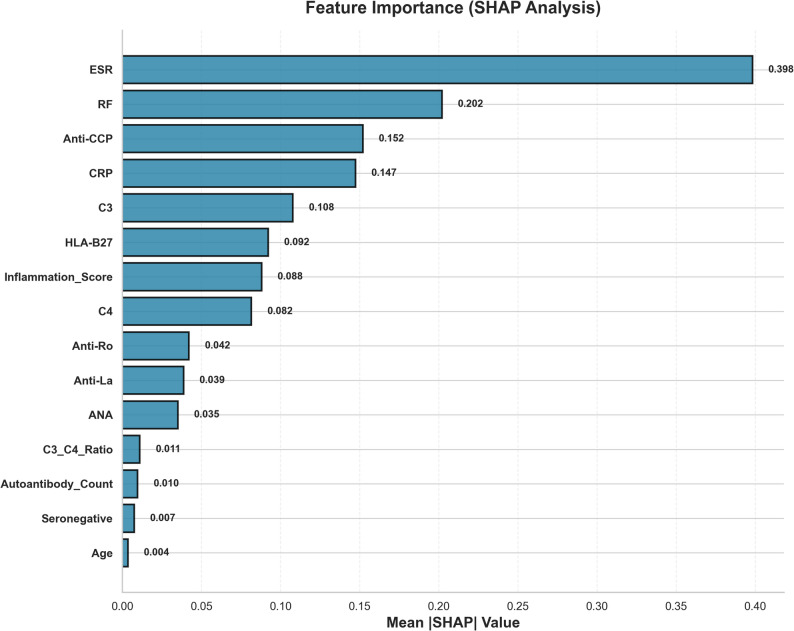 Figure 2
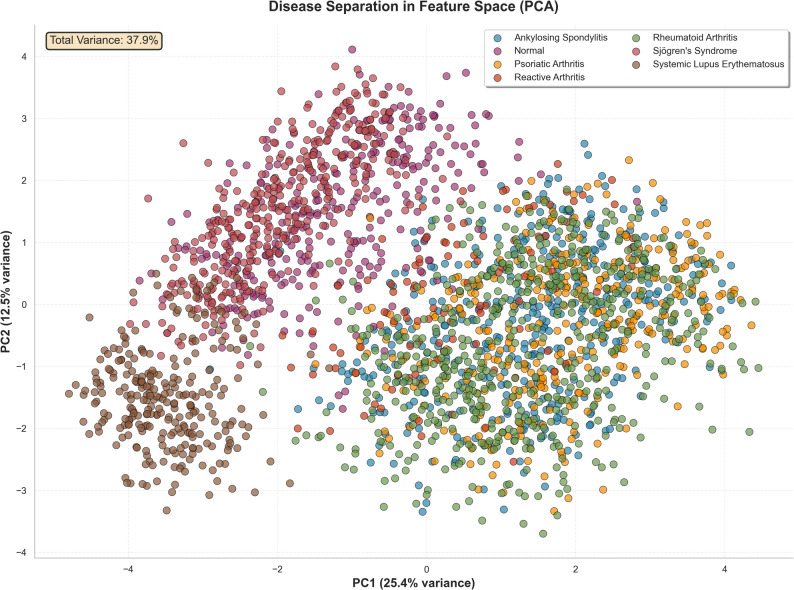 Figure 3
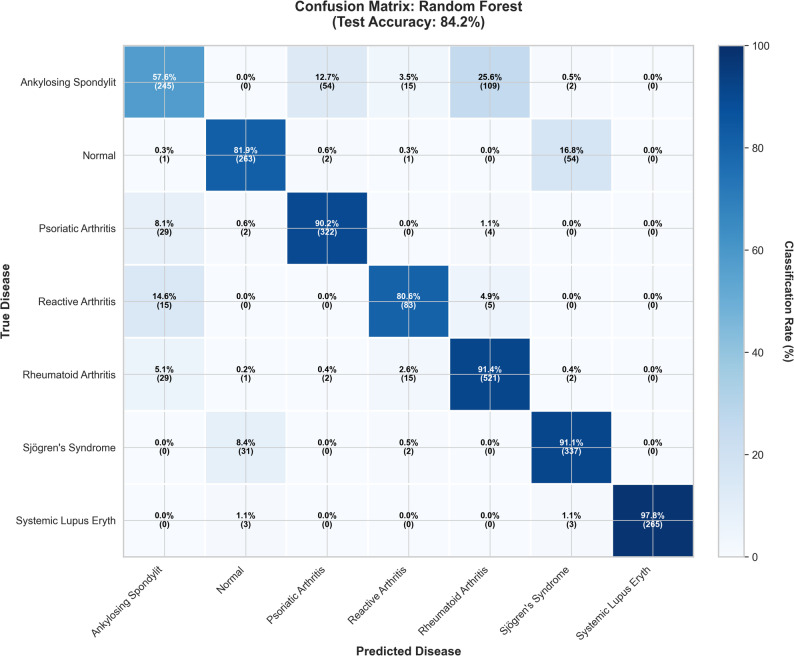 Figure 4
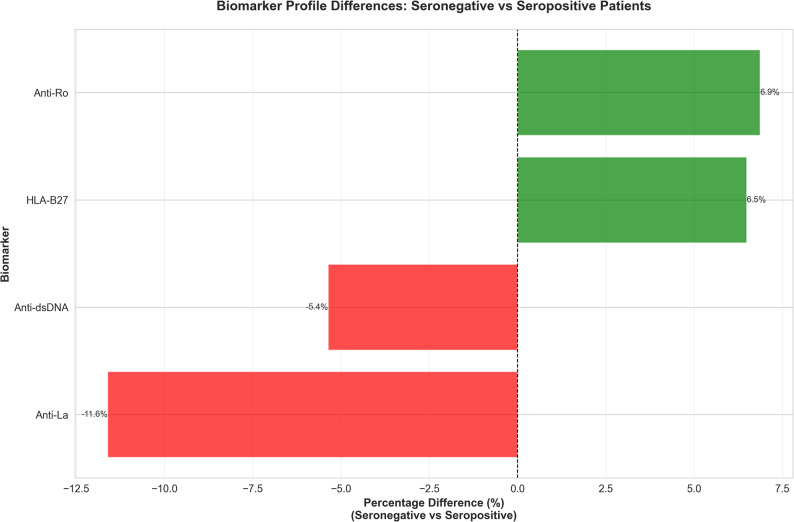 Figure 5
- —Al-Azhar University
Peer Reviews
No public reviews on file for this paper yet. If you reviewed it on a platform where reviews are public (OpenReview, ICLR, NeurIPS, ICML), you can paste yours below so the community can read it here.
Videos
No videos yet. Explain this paper in a talk, walkthrough, or lecture? Add one.
Taxonomy
TopicsSpondyloarthritis Studies and Treatments · Rheumatoid Arthritis Research and Therapies · Inflammatory Myopathies and Dermatomyositis
Introduction
Differentiating common rheumatic diseases remains challenging because clinical phenotypes and routine biomarkers often overlap, resulting in diagnostic delays and misclassification at the point of care, especially within the spondyloarthritis spectrum, where imaging and longitudinal context are crucial. Recent syntheses highlight both the persistence of diagnostic delays in axial spondyloarthritis and the parallel risks of over- or misdiagnosis when imaging is scarce or inconsistently interpreted, underscoring the need for scalable data-driven support tools [1].
Across rheumatology, machine learning (ML) and broader AI methods are increasingly utilized for classification, risk stratification, and treatment guidance, leveraging data from tabular laboratories, imaging, and multi-omics. However, concerns about generalizability, calibration, and transparency remain central barriers to its clinical adoption [2–4]. In parallel, reporting guidance has evolved. TRIPOD + AI emphasizes explicit handling of missingness, internal and external validation, probability calibration, and decision-analytic evaluation to support safe clinical translation [5].
Importantly, contemporary work demonstrates that models trained only on readily available laboratory indicators can distinguish early systemic autoimmune rheumatic diseases with promising discrimination, suggesting a practical path for settings in which advanced imaging or specialty testing is not immediately available [6]. Explainable AI methods such as SHAP further enable biomarker-level accountability by linking predictions to clinically recognizable drivers, thereby addressing a key adoption hurdle in high-stakes diagnostics [7].
Building on these advances, we analyzed a large, fully de-identified repository of 12,085 individuals with routine biomarker profiles and confirmed diagnoses made openly available for reproducible ML benchmarking via Harvard Dataverse (dataset record, mirrored listing, and accompanying description) [8].
Because many of the laboratory variables used here directly inform clinical diagnosis (e.g., RF/anti-CCP for RA, complements for SLE, HLA-B27 for axial SpA), our analysis is susceptible to incorporation (circularity) bias: features lie on the causal pathway from disease to diagnostic labeling. Accordingly, we frame our aim as characterizing how routinely collected biomarkers align with diagnostic assignment and producing calibrated probabilities that could support differential diagnosis, rather than claiming independent prediction divorced from clinical practice. Prospective, pre-diagnostic studies are needed to evaluate the independent predictive utility.
Our objective was to develop and validate modern tabular ML models using only routinely collected demographics and serologies, quantify discrimination and calibration, interrogate decision logic with explainability methods, and probe seronegative presentations where conventional serology underperforms, thereby assessing whether accessible lab data can be translated into transparent, calibrated probabilities that support earlier, more accurate differential diagnoses across seven rheumatic conditions.
Methods
Study design and data source
This study was a retrospective diagnostic analysis designed to develop and validate machine learning models for the differential diagnosis of seven rheumatic diseases. We used a publicly available anonymized dataset sourced from the Harvard Dataverse repository [8]. The dataset contained 12,085 de-identified patient records, each with a corresponding biomarker profile and a confirmed diagnosis.
Ethical considerations
All analyses used a publicly available, fully de-identified dataset from Harvard Dataverse, and complied with the dataset’s stated license and terms of use, as posted on the repository record [8]. No attempt has been made to reidentify individuals or link records to external data sources. The results are reported only in aggregate, and potentially identifying small cell sizes was avoided or suppressed where relevant.
Study population and variables
The inclusion criteria stipulated a confirmed diagnosis of one of the seven rheumatic diseases or a healthy control status, an age of ≥ 18 years, and a biomarker profile with ≤ 30% missing data.
Nineteen predictors were used, including demographic variables (age and sex), inflammatory markers (ESR and CRP), and a panel of 11 serological markers (RF, Anti-CCP, HLA-B27, ANA, Complement C3, Complement C4). Four features were clinically engineered, including the Inflammation Score (ESR + CRP level). The target variable for prediction was the disease diagnosis, which was treated as a 7-class categorical outcome.
Data handling and preprocessing
Missing data were a significant consideration, affecting approximately 14.5% of all data points, primarily in specialized serological tests, such as anti-Sm (43.0% missing). A detailed breakdown of missingness by variable is provided in Supplementary Table S1. We assumed that the data were Missing At Random (MAR) because test ordering is typically guided by clinical suspicion. All missing values were imputed using Multivariate Imputation by Chained Equations (MICE) [9]. Following imputation, continuous variables were standardized (standard scale). The cohort was split into training (n = 9,668; 80%) and test (n = 2,417; 20%) sets using stratified random sampling [10].
Model development and validation
Five supervised machine learning models were created: Random Forest [11], LightGBM [12], XGBoost [13], CatBoost [14], and TabNet [15]. Hyperparameters were set in advance (not adjusted on the test set) to regularize the models and restrict their capacity—for example, Random Forest (n_estimators = 500, max_depth = 8, min_samples_leaf = 20), XGBoost (eta = 0.05, max_depth = 5, subsample = 0.8, colsample_bytree = 0.8), and LightGBM (num_leaves = 31, feature_fraction = 0.8, bagging_fraction = 0.8).
Model performance was assessed using an independent test set. Internal validation was confirmed using 5-fold stratified cross-validation, and the detailed fold-by-fold results demonstrating model stability are shown in Supplementary Table S2. Statistical comparisons between the models were performed using McNemar’s test [16]. Explainability analysis was conducted using SHAP (Shapley Additive exPlanations) to identify the clinical drivers of model predictions. Subgroup analysis was performed on seronegative patients (RF- and anti-CCP-negative) to identify alternative diagnostic pathways [17].
Software and reproducibility
All analyses were conducted using Python 3.12, with a random state of 42 to ensure reproducibility. The computational performance, including the training time and model size, for each of the five models is reported in Supplementary Table S3. This report adhered to the TRIPOD + AI guidelines [5].
Results
Patient population
The study cohort included 12,085 patients with 9,668 (80%) in the training set and 2,417 (20%) in the test set. The cohort included 2,848 (23.6%) patients with Rheumatoid Arthritis (RA) and 2,123 (17.6%) with Ankylosing Spondylitis (AS). A clinically significant subgroup of 390 (3.2%) seronegative patients was identified in this study. The complete demographic and disease distributions of the cohort are presented in Table 1.
Table 1. Study population characteristicsCharacteristicTotal Cohort (n = 12,085)Age, years49.91 ± 17.65Gender, n (%)Female5,934 (49.1%)Male6,151 (50.9%)Disease Distribution, n (%)Rheumatoid Arthritis2,848 (23.6%)Ankylosing Spondylitis2,123 (17.6%)Sjögren’s Syndrome1,850 (15.3%)Psoriatic Arthritis1,784 (14.8%)Normal/Controls1,614 (13.4%)Systemic Lupus Erythematosus1,353 (11.2%)Reactive Arthritis513 (4.2%)Seronegative Patients390 (3.2%)Data SplitTraining set9,668 (80.0%)Test set2,417 (20.0%)
Overall model classification performance
All five models showed high classification accuracy on the independent test set, as indicated in Table 2. The XGBoost model achieved the highest accuracy (85.48%), with no signs of overfitting (+ 0.32% gap). The Random Forest model was chosen for the next detailed analysis due to its solid balance of accuracy (83.78%) and calibration.
Table 2. Overall model performance comparisonModelTraining AccuracyCV Accuracy (± SD)Test AccuracyOverfitting GapRankXGBoost 85.16%
83.94% (± 0.92%)
85.48%
-0.32% 1TabNet84.47%82.89% (± 0.86%)84.44%+ 0.03%2Random Forest84.82%82.17% (± 0.58%)83.78%+ 1.03%3LightGBM86.92%82.30% (± 0.78%)82.79%+ 4.13%4CatBoost79.41%79.34% (± 0.56%)79.85%-0.44%5
Statistical validation and model reliability
A statistical comparison using McNemar’s test revealed no significant difference in classification error rates among the top three models (Random Forest, XGBoost, and LightGBM; all p > 0.05), as detailed in Supplementary Table S4. All models showed excellent discriminative ability for most diseases, with macro-averaged Area Under the Curve (AUC) scores exceeding 0.92 (Supplementary Table S5).
Model calibration was assessed for clinical utility. The calibration curves in Fig. 1 demonstrate a close alignment between the predicted probabilities and actual patient outcomes. This visual finding was supported by excellent quantitative metrics, including low Brier scores and Expected Calibration Errors (ECE) for all models (Supplementary Table S6).
Fig. 1. Model Calibration Curves. Description: Shows the calibration plots for all 5 models, comparing mean predicted probability to the actual fraction of positives to assess the reliability of probability scores
Clinical drivers of diagnosis (explainability)
Explainability analysis identified key biomarkers that drive the model’s diagnostic logic. Figure 2 provides a visual ranking of these features, showing nonspecific inflammatory markers (ESR and CRP) and key autoantibodies (RF and anti-CCP) as the most dominant factors.
Fig. 2. Feature Importance (SHAP Analysis). Description: A bar chart ranking the top clinical and laboratory features by their mean absolute SHAP value, indicating their overall importance in driving the models’ predictions
Table 3 provides the complete list, confirming that the model’s logic aligns with the established clinical pathophysiology: ESR (mean SHAP 0.398) was the most critical feature, followed by RF (0.202) and anti-CCP (0.152) for RA, and HLA-B27 (0.092) for spondyloarthropathies. Complement proteins C3 (0.108) and C4 (0.082) played a key role in identifying SLE. A comprehensive breakdown of the SHAP values for all 19 features is presented in Supplementary Table S7.
Table 3. Feature importance (SHAP Values)RankFeatureMean |SHAP| ValueRelative ImportanceClinical Interpretation1ESR0.398100%Non-specific inflammation marker; elevated in most rheumatic diseases2RF0.20251%RA-specific; highly predictive of RA vs. other conditions3Anti-CCP0.15238%RA-specific; >95% specificity for RA4CRP0.14737%Acute phase reactant; complements ESR5C30.10827%Complement consumption in SLE/autoimmune disease6HLA-B270.09223%Spondyloarthropathy marker (AS, PsA, Reactive)7Inflammation Score0.08822%Combined ESR + CRP; overall inflammation burden8C40.08221%Complement; often low in SLE9Anti-Ro0.04211%Sjögren’s and SLE marker10Anti-La0.03910%Sjögren’s-specific (higher specificity than Anti-Ro)11ANA0.0359%Non-specific; present in multiple autoimmune diseases12C3/C4 Ratio0.0113%SLE marker (low ratio when both consumed)13Autoantibody Count0.0102%Severity/polyautoimmunity indicator14Seronegative0.0072%Identifies seronegative arthropathy group15Age0.0041%Minimal importance: diseases span age ranges16Anti-Sm0.002< 1%SLE-specific but rare; low impact17Anti-dsDNA0.001< 1%SLE-specific but low prevalence18Gender0.0004< 1%Minimal importance; models disease-agnostic to sex19Classical_RA_Positive0.0000%Redundant with RF + Anti-CCP individual values
Per-class classification performance
The Classification performance of the Random Forest model varied significantly across the seven diseases, reflecting the known clinical challenges (Table 4). The model was exceptionally effective in identifying Systemic Lupus Erythematosus (SLE), achieving 100.0% precision and 97.9% recall (sensitivity). The most significant diagnostic challenge was Ankylosing Spondylitis (AS), which had the lowest recall (57.6%), indicating that 42.4% of patients with AS were misclassified. A comprehensive comparison of the per-class metrics for all five models is presented in Supplementary Table S8.
Table 4. Per-class performance metrics (Random Forest, test set n = 2,417)DiseasePrecisionRecallF1-ScoreSpecificitySensitivityPPVNPVSupportSLE 100.0%
97.9%
98.9%
100.0%
97.9%
100.0%
99.7% 271Sjögren’s84.7%91.1%87.8%97.0%91.1%84.7%98.4%370PsA84.7%90.2%87.4%97.2%90.2%84.7%98.3%357Normal87.7%81.9%84.7%98.2%81.9%87.7%97.3%321RA81.5%91.4%86.2%93.6%91.4%81.5%97.2%570Reactive71.6%80.6%75.8%98.6%80.6%71.6%99.1%103AS 76.8%
57.6%
65.9%
96.3%
57.6%
76.8%
91.4% 425Mean83.9%84.4%83.8%97.3%84.4%83.9%97.3%-SD± 7.4%± 11.3%± 9.2%± 2.0%± 11.3%± 7.4%± 2.7%-
Analysis of classification errors
The Principal Component Analysis (PCA) plot (Fig. 3) shows the natural separation of the classes: SLE forms a compact, well-separated group, while the seronegative spondyloarthropathies (AS, PsA, and reactive arthritis) occupy an overlapping area of feature space. This overlap causes most classification errors. Out of 2,417 test cases, 381 (15.76%) were misclassified. The confusion matrix (Fig. 4) and ranked error pairs (Table 5; Supplementary Figure S1) indicate that the most common error was predicting AS as RA (109 cases; 28.6% of all errors). These patterns align with the model explanations (Fig. 2), where inflammation markers and RF/anti-CCP have a more substantial influence than HLA-B27, resulting in a higher likelihood of assigning cases to RA. Full cell counts for the confusion matrix are available in Supplementary Table S9.
Fig. 3. Disease Separation in Feature Space (PCA). Description: A Principal Component Analysis (PCA) plot visualizing all 7 disease classes, illustrating the inherent biomarker overlap between certain diseases (like AS, PsA, and Reactive Arthritis) and the distinct separation of others (like SLE)
Fig. 4. Confusion Matrix (Random Forest). Description: A detailed 7 × 7 confusion matrix for the selected Random Forest model (Test Accuracy: 83.78%), showing the classification rate (percentage) and raw count (number) of patients for all predictions
Table 5. Top 10 misclassification patternsRankTrue DiseasePredicted DiseaseErrors (n)% of All Errors% of True ClassClinical Explanation1 AS
RA
109
28.6%
25.6% Overlapping inflammatory profiles; seronegative RA mimics AS2ASPsA5414.2%12.7%Both HLA-B27 + spondyloarthropathies3NormalSjögren’s5414.2%16.8%Early/subclinical Sjögren’s with low-titer antibodies4Sjögren’sNormal318.1%8.4%Mild presentation, borderline serology5PsAAS297.6%8.1%Shared spondyloarthropathy features6RAAS297.6%5.1%Seronegative RA with axial involvement7RAReactive153.9%2.6%Similar inflammatory pattern8ReactiveAS153.9%14.6%HLA-B27 association9ASReactive153.9%3.5%Both seronegative spondyloarthropathies10ReactiveRA51.3%4.9%Post-infectious inflammatory arthritis Top 10 Total
356
93.4%
Insights from the seronegative patient subgroup
Analysis of 390 seronegative patients revealed critical insights into this hard-to-diagnose population.
- Biomarker Differences: As shown in Fig. 5, seronegative patients had a 6.5% higher prevalence of HLA-B27 (p = 0.024) and an 11.6% lower prevalence of anti-La (p = 0.001) compared to the seropositive group. Full comparison data, which confirmed no significant differences in inflammatory markers, are shown in Supplementary Table S10.
Fig. 5. Biomarker Profile Differences (Seronegative vs. Seropositive). Description: A bar chart showing the statistically significant percentage difference in prevalence for key biomarkers (e.g., Anti-La, HLA-B27) when comparing the seronegative subgroup to the main seropositive cohort
- Seronegative Subtypes: This subgroup is not uniform. Clustering revealed four distinct clinical subtypes (Supplementary Figure S2). Detailed biomarker profiles for these clusters are provided in Supplementary Table S11, corresponding to (1) a “High HLA-B27/High Inflammation” group (likely AS), (2) an “Anti-Ro+” group (likely Sjögren’s), (3) a “Low-Marker” group (likely seronegative RA or Normal), and (4) an “ANA+/Low Complement” group (likely SLE or Undifferentiated CTD).
- Alternative Diagnostic Markers: A separate SHAP analysis of this subgroup confirmed that in the absence of RF and anti-CCP, HLA-B27 becomes the single most important diagnostic marker, followed by ESR, CRP, and ANA.
Discussion
This descriptive diagnostic analysis demonstrates that tabular machine-learning models trained on routine laboratory data recover recognizable diagnostic assignment patterns and produce calibrated probabilities that may support multi-disease differential diagnosis across common rheumatic conditions, while maintaining good discrimination and calibration in an independent test set. These observations are clinically plausible: acute-phase reactants (ESR and CRP) and RA-related autoantibodies (RF and anti-CCP) are central to the 2010 ACR/ 2019 EULAR RA classification framework, and SLE classification is associated with high weight to ANA entry plus complement consumption, whereas HLA-B27 is a defining genetic marker in axial spondyloarthritis classification schemes [18, 19].
The explainability profile is also consistent with clinical knowledge: SHAP theory provides locally faithful, consistent attributions for tree-based models, which helps align model logic with established disease biology when inflammatory markers and autoantibodies dominate the importance rankings [17].
A recurring challenge was the diagnostic separation within the spondyloarthritis spectrum, particularly for presumed seronegative presentations where biomarker overlap is expected and classification criteria rely on HLA-B27 and imaging patterns rather than serum autoantibodies.
Finally, the models’ favorable calibration is clinically meaningful because probability estimates can inform threshold-based decisions (e.g., “test-and-refer” strategies), a requirement emphasized by the reporting guidance for prediction models in clinical AI [5, 20].
Our study extends the growing body of literature that uses readily available laboratory variables to stratify systemic autoimmune/rheumatic diseases. A recent multicenter study in Lupus Science & Medicine classified early-stage systemic autoimmune rheumatic diseases using accessible laboratory indicators and reported intense discrimination, supporting the feasibility of lab-only models for early differential diagnosis [21].
Relative to this work, the present analysis leverages a larger, fully de-identified public dataset from Harvard Dataverse spanning multiple rheumatic conditions and evaluates several modern tabular learners (gradient-boosting variants, random forests, and a neural tabular model) while pairing performance with global and local explainability grounded in SHAP theory [17].
Our findings are also consistent with disease-specific paradigms: RA models tend to weigh RF/anti-CCP and acute-phase reactants, SLE models weigh ANA/low complements, and spondyloarthritis models benefit most from HLA-B27 patterns that mirror contemporary classification frameworks rather than relying on niche biomarkers [22].
Taken together, these results support the pragmatic role of lab-based ML as an adjunct to clinician judgment, particularly for triage and early diagnostic guidance when definitive findings (e.g., imaging changes and characteristic exam features) are pending. This is directionally aligned with guideline-based constructs: RA classification leverages serology and acute-phase reactants; SLE incorporates ANA entry and complement; and axial SpA elevates HLA-B27. This suggests that such models may operationalize existing clinical knowledge into calibrated probabilities for shared decision-making.
Strengths and limitations
This study has several strengths that enhance its credibility and potential clinical relevance, as it leverages a large, fully de-identified, publicly available dataset that spans multiple rheumatic conditions, enabling a pragmatic, multiclass differential diagnosis setting. The modeling strategy emphasizes reproducibility (pre-specified hyperparameters, independent test evaluation, and internal cross-validation) and clinical interpretability via SHAP, which provides locally faithful and consistent attributions for tree-based learners. In addition, we assessed probability calibration alongside discrimination and followed contemporary reporting guidance for AI-enabled prediction models, aligning model reporting with best practices intended to support clinical translation.
Significant limitations of this study should also be acknowledged. First, the analysis relied on a single curated public repository. However, large and diverse, a one-source design may not capture cross-institutional differences in test utilization, disease prevalence, or care pathways.
A central limitation is the underperformance in ankylosing spondylitis (recall 57.6%), as well as broader mixing among spondyloarthropathies, with AS→RA being the most common error (28.6%). This is plausibly driven by (i) the dominance of RF/anti-CCP and inflammation markers in the global model logic, which favors RA, and (ii) modest HLA-B27 signal and the absence of imaging/clinical patterning that typically disambiguates axial SpA. Consequently, the current model should not be used to differentiate spondyloarthropathies from RA without additional data.
Second, although we performed internal validation, we did not conduct temporal or geographic external validation, which is specifically recommended for ensuring the trustworthy deployment and transportability of our results.
Third, missing data were handled under a Missing-At-Random (MAR) assumption using multivariate imputation by chained equations. Violations of MAR (e.g., clinically informative test-ordering patterns tied to unobserved factors) could bias imputations, motivating sensitivity analyses to alternative mechanisms.
Fourth, our feature set was restricted to demographics and laboratory biomarkers. In contrast, contemporary classification frameworks for RA, SLE, and axial spondyloarthritis integrate clinical features and, for spondyloarthritis, imaging. Therefore, excluding these modalities may particularly hinder the recognition of seronegative spondyloarthropathy phenotypes. Relatedly, we observed error concentration in spondyloarthritis, which is biologically plausible given the shared inflammatory signatures and the centrality of HLA-B27 and imaging in discriminating against axial disease; incorporating imaging, structured symptom trajectories, and physical examination findings may mitigate this limitation.
Fifth, Incorporation (circularity) bias is an additional limitation: many predictors (RF/anti-CCP, complements, HLA-B27) are on the causal pathway to diagnostic labeling. Therefore, our models mainly identify correlates of the diagnostic process rather than proving independent predictive validity. Prospective, pre-diagnostic evaluation and external/temporal validation are necessary to confirm transportability and independent prediction.
Sixth, pairwise model comparisons used McNemar’s test on dichotomized outcomes. While standard for paired classification error, this does not contrast complete probability distributions or clinical utility across thresholds, supporting the complementary use of decision curve analysis and net benefit reporting in future work.
Seventh, we did not pre-specify or evaluate fairness metrics or calibration across demographic strata; given known age and sex effects on autoimmunity, stratified performance and recalibration should accompany external validation.
Finally, as a retrospective diagnostic study, we did not measure prospective clinical impact; future prospective evaluations should quantify the effects on diagnostic delay, downstream testing, treatment initiation, and model-in-the-loop behaviors with appropriate safety monitoring.
Future directions
External, multi-site validation with temporal holdouts; additive data modalities (clinical features, imaging), particularly for suspected seronegative spondyloarthritis; prospectively defined decision thresholds with decision-curve analysis; fairness auditing and recalibration by subgroup; and pre-registered implementation studies are warranted to confirm transportability and clinical utility.
Conclusion
Using a large, de-identified dataset, we developed and validated several machine-learning models that demonstrated intense discrimination and well-calibrated probabilities for distinguishing between the seven rheumatic diseases. Model explanations aligned with known pathophysiology and error patterns, especially within the spondyloarthritis spectrum, and seronegative presentations were clinically plausible. These findings support lab-based ML as a supplemental tool that identifies diagnostic patterns and provides calibrated probabilities; however, additional clinical and imaging data, along with external validation, are needed before relying on this approach to differentiate spondyloarthropathies from RA. The next steps are clear: rigorous external and temporal validation, integration of clinical and imaging data to resolve ambiguity in spondyloarthritis, prospective evaluation of workflow impact and safety, and predefined fairness assessments with recalibration across demographic groups.
Supplementary Information
Below is the link to the electronic supplementary material.
Supplementary Material 1
Supplementary Material 2
Supplementary Material 3
Supplementary Material 4
Supplementary Material 5
Supplementary Material 6
Supplementary Material 7
Supplementary Material 8
Supplementary Material 9
Supplementary Material 10
Supplementary Material 11
Supplementary Material 12
Supplementary Material 13
The reference list from the paper itself. Each links out to its DOI / PubMed record.