Frequency-reduction strategy of roxadustat in patients undergoing peritoneal dialysis: a multi-center retrospective cohort study
Xi Mi, Guanying Lin, Yijing Fang, Lu Zhu, Yanhong Lin, Tingting Zhang, Xiaohong Zhong, Xiaoyan Su, Xianrui Dou, Jun Ai

TL;DR
This study compares two strategies for reducing roxadustat in peritoneal dialysis patients and finds that reducing dosing frequency is more effective at maintaining target hemoglobin levels.
Contribution
Demonstrates that frequency-reduction of roxadustat is more effective than dose-reduction in maintaining hemoglobin levels in PD patients.
Findings
Frequency-reduction group had higher hemoglobin target attainment rates at months 3, 6, and 12 compared to dose-reduction group.
Frequency-reduction group showed lower hemoglobin variability and reduced risk of hemoglobin target non-attainment.
Frequency-reduction strategy was associated with adjusted hazards ratio of 0.64 for hemoglobin target non-attainment.
Abstract
Although dose reduction is the guideline-recommended tapering strategy for roxadustat to maintain target hemoglobin levels in peritoneal dialysis (PD) patients during the maintenance phase, reducing the administration frequency represents another potential clinical approach. However, the specific efficacy of this strategy in sustaining target hemoglobin levels remains unclear. This was a retrospective cohort study conducted from 1 January 2021 to 31 December 2024, enrolling PD patients from three dialysis centers in South China. Participants who achieved target hemoglobin levels were stratified into two groups based on roxadustat tapering strategies: The dose-reduction group, in which the per-dose amount was gradually decreased while maintaining the administration frequency, and the frequency-reduction group, in which the administration frequency was reduced without changing the…
Genes, proteins, chemicals, diseases, species, mutations and cell lines named across the full text — each resolved to its canonical identifier and authoritative record.
Click any figure to enlarge with its caption.
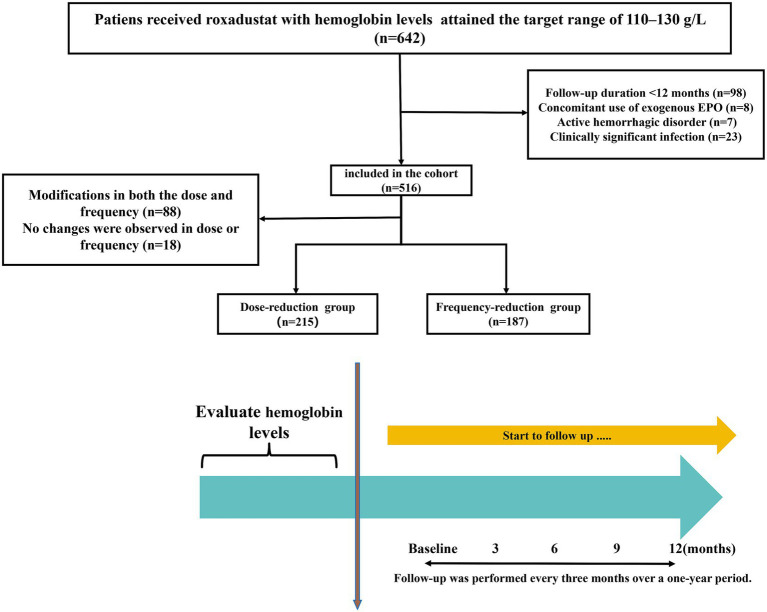 Figure 1
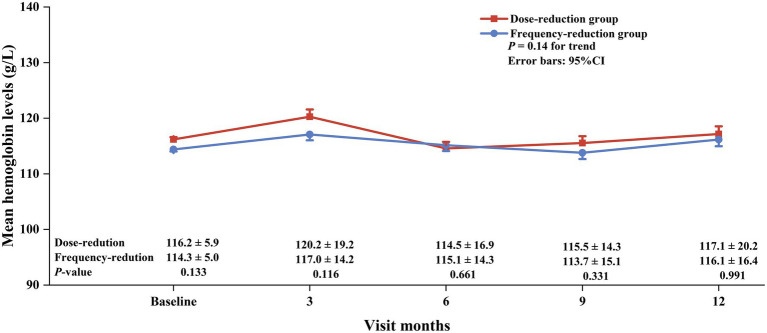 Figure 2
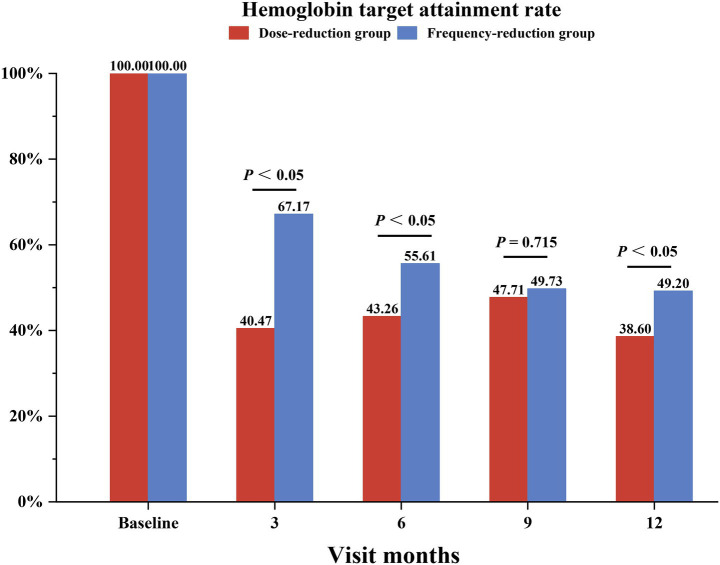 Figure 3
 Figure 4
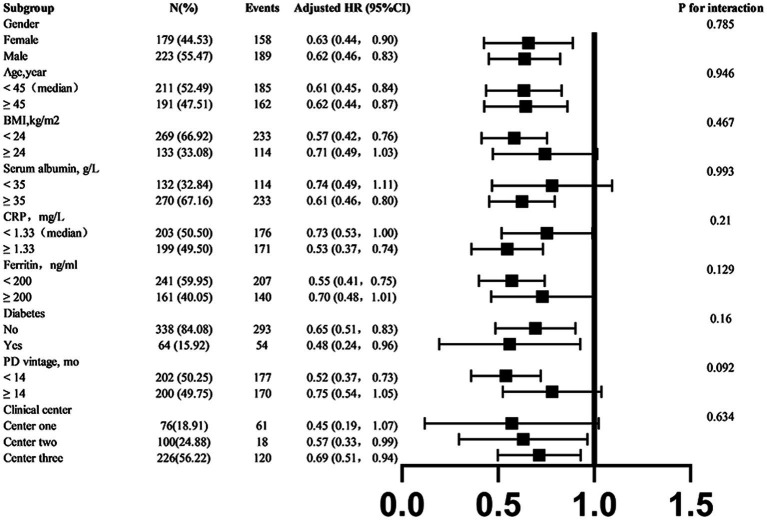 Figure 5
| Characteristic | Total | Dose-reduction | Frequency-reduction | |
|---|---|---|---|---|
|
| 402 | 215 | 187 | |
| Male, No. (%) | 223 (55.5) | 117 (54.4) | 106 (56.7) | 0.649 |
| Age, y | 45.3 ± 13.8 | 45.8 ± 13.1 | 44.7 ± 14.6 | 0.327 |
| BMI | 22.6 ± 3.9 | 22.3 ± 3.7 | 23.0 ± 4.1 | 0.216 |
| Diabetes mellitus | 64 (15.9) | 43 (20.0) | 21 (11.2) |
|
| SBP, mmHg | 136.2 ± 17.2 | 136.6 ± 17.1 | 135.7 ± 14.6 | 0.222 |
| DBP, mmHg | 87.1 ± 10.4 | 87.2 ± 10.3 | 87.0 ± 10.4 | 0.668 |
| Iron supplementation, No. (%) | 203 (50.4) | 111 (51.6) | 92 (49.1) | 0.119 |
| Baseline laboratory examinations | ||||
| Phosphorus, mmol/L | 1.6 ± 0.5 | 1.6 ± 0.5 | 1.6 ± 0.5 | 0.959 |
| Blood hemoglobin, g/L | 115.3 ± 5.6 | 116.2 ± 6.0 | 114.4 ± 5.1 | 0.133 |
| Serum albumin, g/L | 37.0 ± 6.1 | 36.4 ± 6.2 | 37.5 ± 5.9 | 0.138 |
| Serum creatinine, μmol/L | 925.6 ± 322.3 | 912.8 ± 346.2 | 940.2 ± 292.8 | 0.201 |
| CRP, mg/L | 4.3 ± 8.2 | 3.7 ± 5.8 | 5.0 ± 10.2 | 0.493 |
| iPTH, pg/mL | 421.8 ± 405.2 | 421.9 ± 431.3 | 421.8 ± 374.1 | 0.999 |
| Ferritin, ng/mL | 224.3 ± 228.0 | 211.9 ± 210.5 | 238.2 ± 246.0 | 0.409 |
| Transferrin saturation, % | 28.12 ± 16.16 | 28.07 ± 16.02 | 28.16 ± 16.32 | 0.960 |
| Total cholesterol, mmol/L | 4.0 (3.3, 4.9) | 3.9 (3.2, 4.8) | 4.0 (3.3, 5.0) | 0.353 |
| Baseline PD characteristics | ||||
| PD vintage, mo | 28.6 ± 26.7 | 27.9 ± 27.8 | 29.4 ± 25.1 |
|
| 24-h UF volume, ml/d | 350.0 (200.0, 612.5) | 425.0 (312.5, 637.5) | 312.5 (200.0, 600.0) | 0.342 |
| 24-h Urine volume, ml/d | 600.0 (350.0, 900.0) | 400.0 (212.5, 712.5) | 600.0 (400.0, 900.0) | 0.145 |
| Dialysate GLUC, % | 1.5 ± 0.1 | 1.5 ± 0.1 | 1.5 ± 0.1 | 0.222 |
| Total Kt/V score | 2.1 ± 0.2 | 2.1 ± 0.1 | 2.1 ± 0.2 | 0.548 |
| Cause of ESRD | ||||
| Primary glomerular disease, No. (%) | 232 (57.7) | 122 (56.7) | 110 (58.8) | |
| Hypertensive nephropathy, No. (%) | 20 (4.9) | 11 (5.11) | 9 (4.8) | |
| Diabetic nephropathy, No. (%) | 20 (4.9) | 12 (5.5) | 8 (4.2) | |
| Other, No. (%) | 110 (27.3) | 50 (23.2) | 60 (32.0) | |
| Hemoglobin target non-attainment, mo | Crude model | Adjusted model | ||
|---|---|---|---|---|
| HR (95% CI) | HR (95% CI) | |||
| Male | 0.95 (0.77, 1.18) | 0.664 | 1.02 (0.80, 1.30) | 0.847 |
| Age, y | 1.00 (0.99, 1.00) | 0.394 | 1.00 (0.99, 1.00) | 0.270 |
| BMI | 0.99 (0.96, 1.02) | 0.437 | 0.99 (0.96, 1.02) | 0.538 |
| Mean arterial pressure, mmHg | 1.00 (0.99, 1.01) | 0.519 | 0.99 (0.98, 1.01) | 0.325 |
| Diabetes mellitus | 0.93 (0.69, 1.24) | 0.603 | 0.86 (0.62, 1.18) | 0.343 |
| PD vintage, mo | 1.00 (0.99, 1.00) | 0.355 | 1.00 (0.99, 1.00) | 0.749 |
| Mean daily roxadustat exposure, mg/d | 1.01 (1.00, 1.02) | 0.142 | 1.00 (0.99, 1.01) | 0.876 |
| Phosphorus, mmol/L | 1.06 (0.84, 1.33) | 0.628 | 1.03 (0.80, 1.34) | 0.797 |
| iPTH, pg/mL | 1.00 (1.00, 1.00) | 0.929 | 1.00 (1.00, 1.00) | 0.841 |
| Serum albumin, g/L | 1.00 (0.98, 1.01) | 0.676 | 1.00 (0.98, 1.02) | 0.661 |
| CRP, mg/L | 1.00 (0.99, 1.01) | 0.993 | 1.01 (0.99, 1.02) | 0.393 |
| Serum ferritin, ng/mL | 1.00 (1.00, 1.00) | 0.681 | 1.00 (1.00, 1.00) | 0.813 |
| 24-h UV, ml/d | 1.00 (1.00, 1.00) | 0.185 | 1.00 (1.00, 1.00) | 0.670 |
| Total Kt/V score | 1.18 (0.42, 3.29) | 0.757 | 1.04 (0.32, 3.26) | 0.973 |
| Groups | ||||
| Dose-reduction group | REF | REF | ||
| Frequency-reduction group | 0.65 (0.52, 0.80) |
| 0.64 (0.50, 0.82) |
|
Peer Reviews
No public reviews on file for this paper yet. If you reviewed it on a platform where reviews are public (OpenReview, ICLR, NeurIPS, ICML), you can paste yours below so the community can read it here.
Videos
No videos yet. Explain this paper in a talk, walkthrough, or lecture? Add one.
Taxonomy
TopicsDialysis and Renal Disease Management · Erythropoietin and Anemia Treatment · Potassium and Related Disorders
Introduction
Chronic kidney disease (CKD) is one of the significant contributors to the global health burden, affecting more than 10% of the world’s population (1). Renal anemia, a common complication of CKD, has an incidence exceeding 50% in patients with Stage 5 CKD (2), with prevalence rates surpassing 50% in non-dialysis and 90% in dialysis-dependent populations (3). Evidence indicates that renal anemia not only impairs quality of life but also accelerates CKD progression (4–6). Despite treatment with iron supplementation and erythropoiesis-stimulating agents (ESAs), a significant proportion of patients with CKD struggle to maintain hemoglobin levels within the KDIGO guideline-recommended target range (110–130 g/L) (7). Even after temporary anemia correction, hemoglobin levels in these patients often show greater variability—fluctuating more widely around the target range compared to healthy individuals (8). Such variability has been linked to increased risks of hospitalization, cardiovascular events, and mortality in some reports (9–12). These fluctuations are attributable to blood loss during hemodialysis, inflammatory conditions, endogenous erythropoietin (EPO) resistance, and modifications in the dosing of exogenous erythropoietic agents.
In this context, roxadustat has emerged as a groundbreaking therapeutic alternative for renal anemia. As an oral hypoxia-inducible factor prolyl hydroxylase inhibitor (HIF-PHI), roxadustat mimics the body’s physiological response to hypoxia, thereby enhancing endogenous erythropoietin (EPO) production and improving iron metabolism (13). Clinically, roxadustat has been proven to remain equally effective in patients with EPO resistance or underlying inflammatory conditions (14). Notably, recent evidence suggests that roxadustat induces lower hemoglobin variability compared to erythropoiesis-stimulating agents (ESAs) in hemodialysis patients (15).
Since its approval, roxadustat dosage optimization has been a clinical priority. Prior studies have extensively explored optimal initial strategies—including dose and frequency—to achieve hemoglobin correction in both dialysis-dependent and non-dialysis-dependent CKD populations (16–20). However, only a few studies have been conducted on tapering strategies during maintenance therapy. Current guidelines predominantly recommend dose reduction as the exclusive tapering strategy after achieving hemoglobin targets (21). Given that both dose magnitude and administration frequency are adjustable during clinical therapy (19, 20), frequency reduction might be a potential tapering strategy during the maintenance phase. To explore this possibility, we conducted a multi-center retrospective cohort study comparing dose-reduction and frequency-reduction strategies in terms of longitudinal hemoglobin control among peritoneal dialysis (PD) patients who had achieved target levels.
Methods
Study population
This multi-center retrospective cohort study was conducted across three dialysis centers in Southern China—Nanfang Hospital, the First People’s Hospital of Foshan, and Shunde Hospital of Southern Medical University—from 1 January 2021 to 31 December 2024. The initial cohort comprised 642 adult patients on maintenance peritoneal dialysis (PD) who had received roxadustat for ≥ 4 weeks and achieved target hemoglobin levels (110–130 g/L). After applying the exclusion criteria, 227 patients were excluded for the following reasons: (i) follow-up duration less than 12 months (98), (ii) concomitant use of exogenous erythropoietin (8), (iii) active hemorrhagic disorder (7), and (iv) clinically significant infection (23). Among the 516 eligible participants, 88 patients underwent adjustments in both roxadustat dose and frequency, while 18 maintained unchanged regimens. Consequently, 402 patients were included in the final cohort analysis (Figure 1).
Flowchart of patient selection into the study cohort. EPO, erythropoietin.
Inclusion criteria
Patients aged > 18 years.CKD patients on PD for more than 3 months.Patients diagnosed with renal anemia and treated with roxadustat for ≥ 4 weeks.Patients with hemoglobin levels within the range of 110–130 g/L (inclusive).Patients with body weight between 45 and 100 kg (inclusive).
Exclusion criteria
Evidence of any clinically significant infection.Concomitant use of exogenous erythropoietin.History of malignancy.Active hemorrhagic disorder.Anemia due to causes other than chronic kidney disease.Blood transfusion within 12 weeks prior to baseline.Pregnancy.Life expectancy less than 12 months.
Data collection and measurement
Baseline demographic characteristics (age, sex, and body mass index [BMI]) were collected from medical records. Systolic blood pressure (SBP), diastolic blood pressure (DBP), laboratory parameters (including blood hemoglobin, serum creatinine, serum albumin, total cholesterol, C-reactive protein, and serum ferritin), and PD-related characteristics (dialysate glucose concentration [GLUC], 24-h ultrafiltration volume, 24-h urine volume, and weekly total Kt/V) were collected at baseline and at each follow-up visit. All biochemical parameters were measured using standardized, automated methods.
Conventional weekly total Kt/V was measured using standard methods (22).
The hemoglobin target achievement rate was defined as the percentage of patients whose hemoglobin levels were maintained within the target range of 110–130 g/L at every measurement, in accordance with the KDIGO guidelines.
A patient was considered to have achieved the hemoglobin target status for the subsequent 3 months if the hemoglobin level met the criterion of 110–130 g/L at a given follow-up visit. Time to hemoglobin target non-attainment was defined as the cumulative duration (in months) from baseline until the hemoglobin level first fell outside the target range.
The standard deviation of residual hemoglobin (Res-SD) was used to assess hemoglobin variability (23).
Res-SD: Res-SD was defined as the square root of the sum of the squared differences between the observed hemoglobin values and the linear regression-predicted values, divided by the number of observations. The formula is as follows:
Treatment methods
In both patient groups, the starting dose of roxadustat was 100 mg three times per week for patients weighing 45–60 kg and 120 mg three times per week for patients weighing ≥ 60 kg. Dose-reduction group: The dose was adjusted using a predefined gradient (250 mg, 200 mg, 150 mg, 120 mg, 100 mg, 70 mg, 50 mg, 40 mg, and 20 mg) based on changes in hemoglobin levels to maintain the target range. Frequency-reduction group: The administration frequency was adjusted using a predefined gradient (3 times weekly, 2 times weekly, or 1 time weekly) based on changes in hemoglobin levels to maintain the target range. All patients were required to follow the dose-adjustment rule according to the hemoglobin response outlined in the study by Chen et al. (21). The specific adjustment regimen is detailed in Supplementary Table 1. Oral and intravenous iron supplementation was permitted, and blood transfusion therapy was allowed when hemoglobin levels were below 60 g/L.
Statistics
Means ± SDs or medians (interquartile range) for continuous variables and proportions for categorical variables were calculated. Differences in baseline characteristics between the dose-reduction group and the frequency-reduction group were compared using t-tests, Kruskal–Wallis tests, or chi-squared tests, respectively. Comparisons of continuous measurements within each group were performed using repeated measures ANOVA. The association between tapering strategies and hemoglobin target non-attainment was evaluated using Cox proportional hazards models (hazards ratio [HR] and 95% confidence interval [95% CI]), without or with adjustments for age, sex, history of diabetes mellitus, PD vintage, mean daily roxadustat exposure and baseline BMI, arterial pressure, 24-h urine volume, weekly total Kt/V score, phosphorus, intact parathyroid hormone (iPTH), serum albumin, C-reactive protein, and ferritin. Moreover, we further divided the patients into subgroups based on sex (male vs. female), age (< 45 vs. ≥ 45 years), BMI (< 24 vs. ≥ 24 kg/m^2^), mean serum albumin level (< 35 vs. ≥ 35 g/L), mean serum ferritin level (< 200 vs. ≥ 200 ng/mL), history of diabetes mellitus (yes vs. no), PD vintage (< 14 vs. ≥ 14 month), and clinical center (clinical center 1, 2, 3). Potential effect modifiers in the relationship between tapering strategies and hemoglobin target non-attainment were evaluated using subgroup analysis, and their interactions were assessed.
A two-tailed p-value of < 0.05 was considered statistically significant in all the analyses. SPSS software package version 22.0 and R software were used for all data analyses.
Results
Participant characteristics
As shown in the flowchart (Figure 1), a total of 402 PD patients were included in the final analyses. Among them, the mean age was 45.3 ± 13.8 years, 55.5% were male, and the mean baseline SBP and DBP were 136.2 ± 17.2 and 87.1 ± 10.4 mmHg, respectively. The patients in the frequency-reduction group were more likely to have a longer PD vintage and a lower prevalence of diabetes. Detailed baseline characteristics are presented in Table 1.
Mean hemoglobin levels and hemoglobin target attainment rates
We first analyzed the mean hemoglobin levels and hemoglobin target attainment rates during the follow-up period. As shown in Figures 2, 3, the mean hemoglobin levels were 116.2 ± 5.8, 120.2 ± 19.2, 114.5 ± 16.9, 115.5 ± 14.3, and 117.1 ± 20.2 in the dose-reduction group and 114.3 ± 5.0, 117.0 ± 14.2, 115.1 ± 14.3, 113.7 ± 15.1, and 116.1 ± 16.4 in the frequency-reduction group at baseline and at months 3, 6, 9, and 12, respectively. Overall, there was no difference in the changing trend of hemoglobin (p = 0.14) or in hemoglobin levels at each visit (all p > 0.05). The patients in the frequency-reduction group had significant higher hemoglobin target attainment rates at months 3, 6, and 12 compared to those in the dose-reduction group (64.1% vs. 40.4%, p < 0.05; 55.6% vs. 43.2%, p < 0.05; 49.2% vs. 36.6%, p < 0.05).
Mean hemoglobin levels in the dose-reduction and frequency-reduction groups during the follow-up period. p for trend compared the hemoglobin change trend.
Hemoglobin target attainment rates in the dose-reduction and frequency-reduction groups at baseline and each follow-up visit. Target hemoglobin levels were 110–130 g/L.
Hemoglobin variability
We next calculated the Res-SD among the patients. The patients in the dose-reduction group had a mean Res-SD value of 15.5 (95% CI 14.6–16.4), which was significantly greater than that of the frequency-reduction group (12.3, 95% CI 11.5–13.2, p < 0.001; Figure 4).
Res-SD scores in the dose-reduction and frequency-reduction groups. Res-SD was calculated by fitting a regression line to each patient’s hemoglobin measurements and then computing the square root of the sum of the squared vertical deviations between each actual hemoglobin value and its corresponding linear regression-predicted value. Res-SD, Standard deviation of residual hemoglobin.
Association between tapering strategies and hemoglobin target non-attainment
We also analyzed the association between tapering strategies and hemoglobin target non-attainment using a Cox regression model. As shown in Table 2, the frequency-reduction group was associated with a lower risk of hemoglobin target non-attainment compared to the dose-reduction group, with an HR of 0.65 (95% CI 0.52–0.80, p < 0.001). After adjustment for age, sex, history of diabetes mellitus, PD vintage, mean daily roxadustat exposure and baseline BMI, arterial pressure, 24-h urine volume, weekly total Kt/V score, phosphorus, iPTH, serum albumin, C-reactive protein, and ferritin, the risk of hemoglobin target non-attainment remained lower in the frequency-reduction group, with a HR of 0.64 (95% CI 0.50–0.82, p < 0.001). A similar trend was found in the Kaplan–Meier curve using the log-rank test (Supplementary Figure 1).
Stratified analyses
To better understand other possible influencing factors in the relationship between tapering strategies and hemoglobin target non-attainment, we conducted additional exploratory subgroup analyses. None of the variables, including sex (male vs. female), age (< 45 vs. ≥ 45 years), BMI (< 24 vs. ≥ 24 kg/m^2^), mean serum albumin level (< 35 vs. ≥ 35 g/L), mean serum ferritin level (< 200 vs. ≥ 200 ng/mL), history of diabetes mellitus (yes vs. no), PD vintage (< 14 vs. ≥ 14 month), and clinical center (clinical center 1,2,3) significantly modified the association between tapering strategies and hemoglobin target non-attainment (all p-interactions > 0.05) (Figure 5).
Subgroup analyses of the association between tapering strategies and hemoglobin target non-attainment. If a variable was not used for stratification, analyses were adjusted for age, sex, history of diabetes mellitus, PD vintage, clinical center, baseline arterial pressure, BMI, total Kt/V score, 24-h urine volume, serum albumin, CRP, and serum ferritin. BMI, body mass index; CRP, C-reactive protein.
Discussion
In this multi-center retrospective study, the patients receiving the roxadustat frequency-reduction strategy exhibited higher hemoglobin target attainment rates, lower mean Res-SD values, and a reduced risk of hemoglobin target non-attainment compared to those in the dose-reduction group. These findings support frequency reduction as a potential tapering strategy for roxadustat in PD patients.
Roxadustat is increasingly used in clinical practice for anemia management in CKD patients, demonstrating benefits including enhanced iron metabolism, attenuated inflammation, reduced ESA resistance, oral administration convenience, and broad insurance coverage (16, 24–26). Within our center, adoption was significantly higher among PD patients, with approximately 70% receiving oral roxadustat compared to fewer than 20% continuing ESA injections. This disparity may be attributable to the standardized 1–3 month follow-up intervals for the PD population.
Current guidelines in China recommend initiating roxadustat at 100 mg (45–60 kg) or 120 mg (≥ 60 kg), administered thrice weekly (TIW) for dialysis-dependent patients. During the maintenance phase, target hemoglobin levels are maintained through stepwise dose reductions based on hemoglobin dynamics while retaining the TIW frequency (21). The rationale for this regimen is primarily based on pharmacokinetic studies: endogenous erythropoietin (EPO) peaks within 24 h post-dose and returns to baseline within 48 h after discontinuation, necessitating TIW dosing to sustain effective erythropoietic activity (27). However, the cascade of cellular signals drives the proliferation and differentiation of erythroid progenitor cells, leading to a stable lifespan of mature red blood cells and a sustained increase in hemoglobin levels (more than 60 days) (27). This provides a pharmacological basis for frequency reduction after anemia correction. A few trials have explored the feasibility of adopting a reduced fixed frequency of roxadustat after hemoglobin reached target levels (19, 20, 28). In a phase II study conducted in Japan in a non-dialysis-dependent population, patients were re-randomized into groups receiving roxadustat either TIW or once weekly after achieving target hemoglobin levels. No difference was observed in subsequent mean hemoglobin levels between the groups. Taken together, frequency reduction might be a potential tapering strategy in clinical practice.
In our study, nearly half of the patients (46.5%) adopted the frequency reduction strategy. Compared to the dose-reduction group, the patients in the frequency-reduction group exhibited higher hemoglobin target attainment rates at months 3, 6, and 12 and lower mean Res-SD values after calculation, along with similar mean hemoglobin levels and trends during subsequent follow-up visits. These results suggest the feasibility of the frequency reduction tapering strategy in peritoneal dialysis populations. Moreover, the frequency-reduction strategy seemed to be better for hemoglobin stability. Further analysis revealed that the dose-reduction group exhibited a higher mean roxadustat dose and a higher proportion of patients with hemoglobin > 130 g/L, while the proportions of patients with hemoglobin < 110 g/L were comparable at months 3, 6, 9, and 12 (Supplementary Figure 2). These findings suggest that relatively higher drug exposure might cause lower hemoglobin stability. Same protocol designs in non-dialysis CKD (29) and PD (30) populations also exhibited comparable efficacy, with significantly lower hemoglobin variability observed in patients receiving low-dose roxadustat compared to standard-dose therapy for anemia correction.
Roxadustat is commonly available in two tablet strengths: 20 mg and 50 mg. However, the 50 mg tablet was the only formulation stocked in many centers, which often precluded precise small dose reductions (e.g., from 100 mg to 70 mg). Consequently, physicians were sometimes compelled to make larger dose adjustments (e.g., from 100 mg to 50 mg). Due to concerns that such significant reductions could induce hemoglobin fluctuations, some clinicians preferred to reduce the administration frequency (e.g., from three times per week to twice per week) as a more manageable alternative. In addition, for patients with sub-optimal medication adherence or those seeking to reduce the administration frequency, physicians might prefer the frequency-reduction strategy to simplify the regimen. Furthermore, after achieving target hemoglobin levels, some physicians were hesitant to discontinue the drug completely due to concerns about potential hemoglobin decline, opting instead to reduce the dosing frequency to maintain a lower level of drug exposure. Therefore, both frequency- and dose-reduction strategies were applied in clinical practice. In our data, the patients in the frequency-reduction group exhibited higher hemoglobin target attainment rates and lower mean Res-SD values while maintaining similar mean hemoglobin levels and trends compared to the dose-reduction group. Therefore, in situations where the 20 mg tablet is unavailable or for patients who wish to reduce the administration frequency, the frequency-reduction strategy might be a potentially feasible alternative method. In other situations, both tapering strategies might be suitable.
Our study has several limitations that should be considered when interpreting the findings. First, as a retrospective cohort study, the design is inherently observational and cannot establish causal relationships between variables. Second, although we adjusted for a broad set of covariates in the analysis, residual confounding may persist due to unmeasured factors such as physicians’ individualized prescribing preferences, undocumented patient comorbidities, variations in medication adherence, and differences in iron dosage and administration patterns. Third, the frequency of hemoglobin monitoring in our study population may have been insufficient to capture more dynamic fluctuations, potentially affecting the accuracy of the conclusions. Fourth, the direct dose reduction of roxadustat from 100 mg to 50 mg, as observed in some of our clinical centers, may affect the validity of our conclusions. Finally, the study participants were recruited exclusively from southern China, which may limit the generalizability of the findings to other geographic or ethnic populations. Further validation in broader and more diverse cohorts is warranted.
Conclusion
Collectively, our retrospective cohort study provides clinical evidence supporting the roxadustat frequency-reduction strategy for maintaining hemoglobin stability in PD patients, indicating its potential feasibility in this population. Further high-quality clinical studies are warranted to confirm these findings.
The reference list from the paper itself. Each links out to its DOI / PubMed record.
- 1Zaimi M Grapsa E. Current therapeutic approach of chronic kidney disease-mineral and bone disorder. Ther Apher Dial. (2024) 28:671–89. doi: 10.1111/1744-9987.14177, 38898685 · doi ↗ · pubmed ↗
- 2Portoles J Martin L Broseta JJ Cases A. Anemia in chronic kidney disease: from pathophysiology and current treatments, to future agents. Front Med. (2021) 8:642296. doi: 10.3389/fmed.2021.642296, 33842503 PMC 8032930 · doi ↗ · pubmed ↗
- 3Evans M Bower H Cockburn E Jacobson SH Barany P Carrero J. Contemporary management of anaemia, erythropoietin resistance and cardiovascular risk in patients with advanced chronic kidney disease: a nationwide analysis. Clin Kidney J. (2020) 13:821–7. doi: 10.1093/ckj/sfaa 054, 33123358 PMC 7577763 · doi ↗ · pubmed ↗
- 4van Haalen H Jackson J Spinowitz B Milligan G Moon R. Impact of chronic kidney disease and anemia on health-related quality of life and work productivity: analysis of multinational real-world data. BMC Nephrol. (2020) 21:88. doi: 10.1186/s 12882-020-01746-4, 32143582 PMC 7060645 · doi ↗ · pubmed ↗
- 5Hoshino J Muenz D Zee J Sukul N Speyer E Guedes M . Associations of hemoglobin levels with health-related quality of life, physical activity, and clinical outcomes in persons with stage 3-5 nondialysis ckd. J Ren Nutr. (2020) 30:404–14. doi: 10.1053/j.jrn.2019.11.003, 31980326 · doi ↗ · pubmed ↗
- 6Akizawa T Okumura H Alexandre AF Fukushima A Kiyabu G Dorey J. Burden of anemia in chronic kidney disease patients in Japan: a literature review. Ther Apher Dial. (2018) 22:444–56. doi: 10.1111/1744-9987.12712, 30022586 · doi ↗ · pubmed ↗
- 7Kidney Disease: Improving Global Outcomes (KDIGO) CKD Work Group. KDIGO 2024 clinical practice guideline for the evaluation and management of chronic kidney disease. Kidney Int. (2024) 105:S 117–314. doi: 10.1016/j.kint.2023.10.01838490803 · doi ↗ · pubmed ↗
- 8Cases-Amenos A Martinez-Castelao A Fort-Ros J Bonal-Bastons J Ruiz MP Valles-Prats M . Prevalence of anaemia and its clinical management in patients with stages 3-5 chronic kidney disease not on dialysis in Catalonia: micenas i study. Nefrologia. (2014) 34:189–98. doi: 10.3265/Nefrologia.pre 2013.Dec.1226124658193 · doi ↗ · pubmed ↗