Independent and combined association of milk tea and takeaway food consumption on depression, anxiety, and comorbid symptoms among Chinese university students
Juncheng Zhu, Jinkui Lu, Lijun Tang, Helin Jin, Cong Liu, Xinping Yuan, Hao Luo, Zhixiu He, Jiancai Song, Shuaicheng Luo

TL;DR
This study finds that milk tea and takeaway food consumption are linked to increased anxiety and comorbid mental health symptoms in Chinese university students.
Contribution
The study reveals novel combined associations between milk tea and takeaway food consumption and mental health outcomes in university students.
Findings
Milk tea consumption is independently linked to higher odds of anxiety and comorbid symptoms.
Combined milk tea and takeaway food consumption significantly increases risk of anxiety and comorbidity.
Specific combinations like cream cap milk tea with fried skewers show the highest risk for comorbidity.
Abstract
Milk tea and takeaway food consumption are increasingly prevalent among Chinese university students and may contribute to adverse mental health outcomes. However, the combined association of these dietary behaviors on psychological symptoms remain unclear. A multicenter cross-sectional survey was conducted from September to November 2023 among 15,440 students from seven universities in four provinces of China. Single-factor associations between psychological symptom types and milk tea/takeaway food consumption were examined using the Chi-square test. Multivariate logistic regression was then employed to assess independent associations, adjusting for demographic and lifestyle confounders. Finally, interaction models were used to explore the combined association of milk tea and takeaway food consumption, as well as the impact of specific consumption combinations, on depression symptoms,…
Genes, proteins, chemicals, diseases, species, mutations and cell lines named across the full text — each resolved to its canonical identifier and authoritative record.
Click any figure to enlarge with its caption.
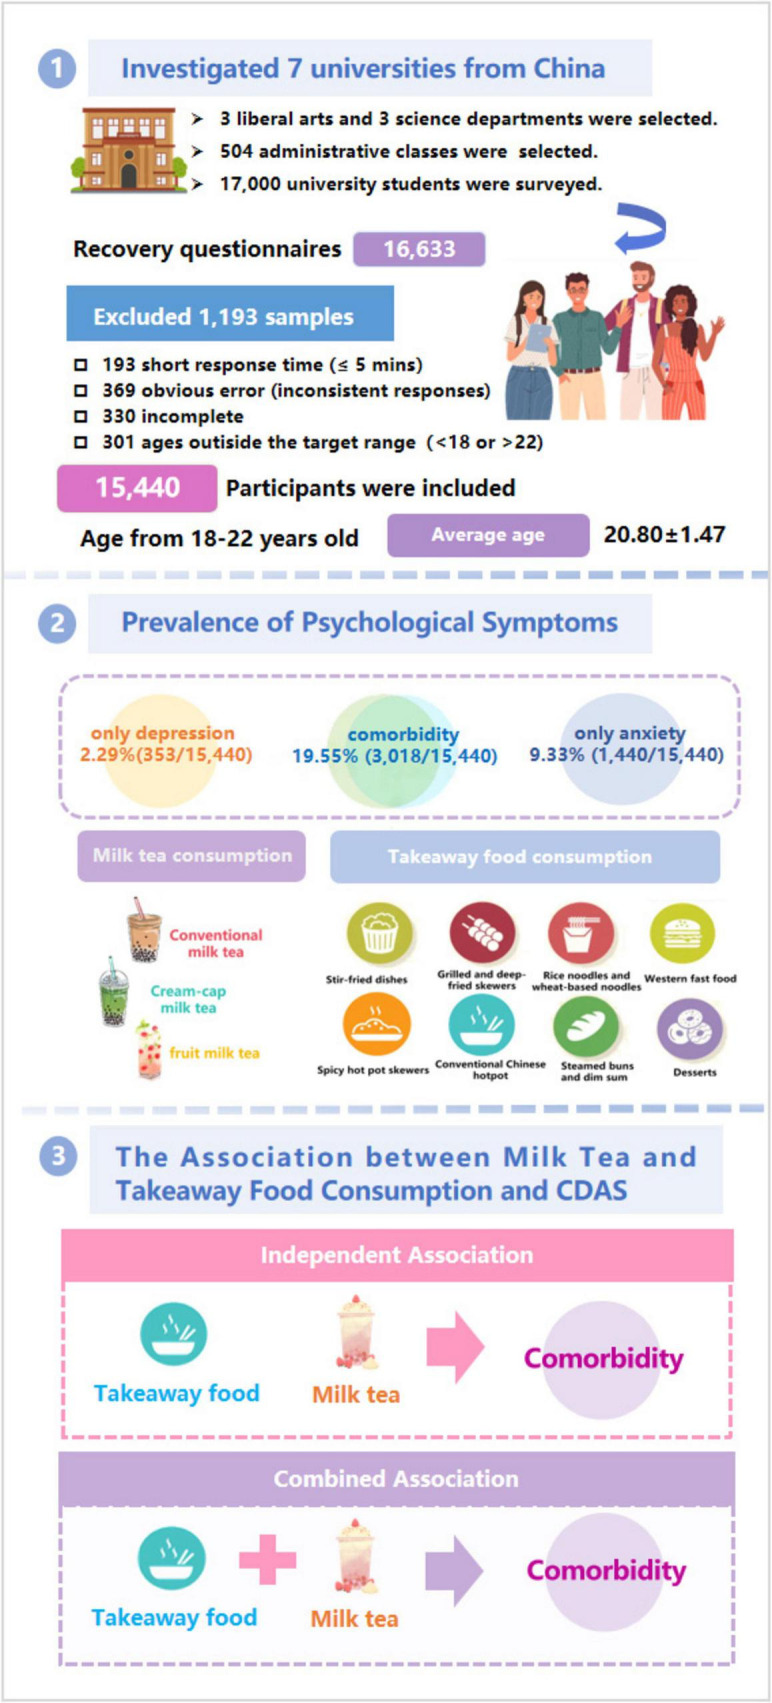 FIGURE 1
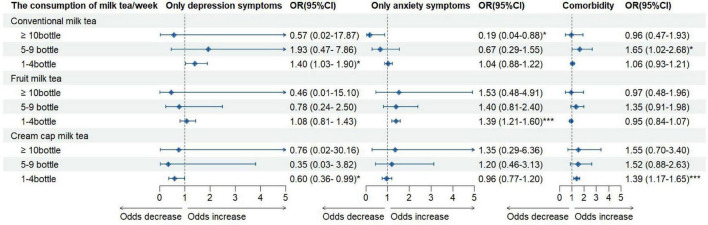 FIGURE 2
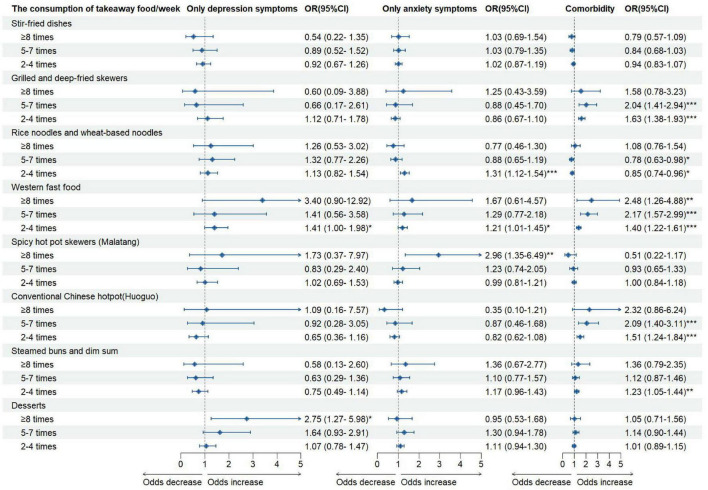 FIGURE 3
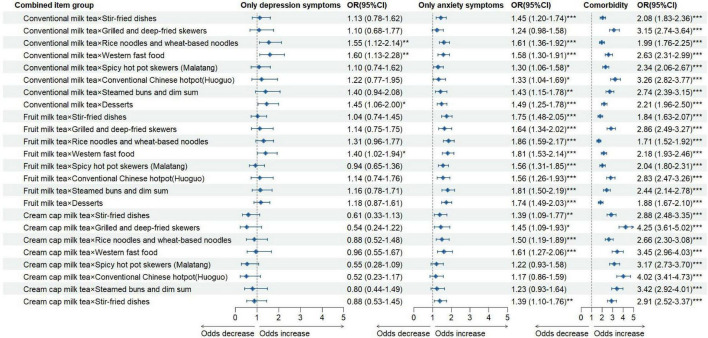 FIGURE 4
| Groups | Overall ( | Male ( | Female ( |
|---|---|---|---|
| Age | 20.80 ± 1.42 | 20.80 ± 1.47 | 20.80 ± 1.38 |
|
| |||
| Urban | 6,457 | 2,475 (40.1) | 3,982 (43.0) |
| Rural | 8,983 | 3,696 (59.9) | 5,287 (57.0) |
|
| |||
| Freshman | 9,040 | 3,920 (63.5) | 5,120 (55.2) |
| Sophomore | 3,022 | 1,181 (19.1) | 1,841 (19.9) |
| Junior | 2,066 | 629 (10.2) | 1,437 (15.5) |
| Senior | 1,312 | 441 (7.2) | 871 (9.4) |
|
| |||
| Primary school or below | 2,288 | 951 (15.4) | 1,337 (14.4) |
| Middle school | 6,078 | 2,514 (40.7) | 3,564 (38.5) |
| High school/vocational school | 4,409 | 1,709 (27.7) | 2,700 (29.1) |
| College or above | 2,665 | 997 (16.2) | 1,668 (18.0) |
|
| |||
| Primary school or below | 3,978 | 1,664 (27.0) | 2,314 (25.0) |
| Middle school | 5,597 | 2,280 (36.9) | 3,317 (35.8) |
| High school/vocational school | 3,752 | 1,441 (23.4) | 2,311 (24.9) |
| College or above | 2,113 | 786 (12.7) | 1,327 (14.3) |
|
| |||
| ≤50,000 | 7,177 | 2,859 (46.3) | 4,318 (46.6) |
| 50,001–100,000 | 3,096 | 1,281 (20.8) | 1,815 (19.6) |
| 100,001–300,000 | 4,065 | 1,573 (25.5) | 2,492 (26.9) |
| ≥300,001 | 1,102 | 458 (7.4) | 644 (6.9) |
|
| |||
| Underweight | 1,061 | 364 (5.9) | 697 (7.5) |
| Normal | 10,886 | 3,953 (64.1) | 6,933 (74.8) |
| Overweight | 1,982 | 1,213 (19.6) | 769(8.3) |
| Obese | 1,511 | 641 (10.4) | 870 (9.4) |
|
| |||
| <75 min | 8,840 | 2,859 (46.3) | 5,981 (64.5) |
| 75∼150 min | 119 | 35 (0.6) | 84 (0.9) |
| 151∼225 min | 484 | 145 (2.3) | 339 (3.7) |
| >225 min | 5,597 | 3,132 (50.8) | 2,865 (30.9) |
|
| |||
| <4.0 h | 9,682 | 4,128 (66.9) | 5,554 (59.9) |
| 4.0∼6.0 h | 4,246 | 1,586 (25.7) | 2,660 (28.7) |
| >6 h | 1,512 | 457(7.4) | 1,055 (11.4) |
|
| |||
| <7.0 h | 2,483 | 1,054 (17.1) | 1,429 (15.4) |
| 7.0∼8.0 h | 7,236 | 2,898 (46.9) | 4,338 (46.8) |
| 8.1∼9.0 h | 4,196 | 1,646 (26.7) | 2,550 (27.5) |
| >9.0 h | 1,525 | 573(9.3) | 952(10.3) |
| Groups | Overall ( | Male ( | Female ( | χ2-value | |
|---|---|---|---|---|---|
| Depression and anxiety symptoms status | 71.52 |
| |||
| Only depression | 353 | 141 (2.3) | 212 (2.3) | – | – |
| Only anxiety | 1,440 | 445 (7.2) | 995 (10.7) | – | – |
| Comorbidity | 3,018 | 1,333 (21.6) | 1,685 (18.2) | – | – |
| No symptoms | 10,629 | 4,252(68.9) | 6,377 (68.8) | – | – |
|
| |||||
| Drinking milk tea | 853.41 |
| |||
| Yes | 8,430 | 2,484 (40.3) | 5,946 (64.1) | – | – |
| No | 7,010 | 3,687 (59.7) | 3,323 (35.9) | – | – |
|
| |||||
| Conventional milk tea | 160.30 |
| |||
| ≥10 bottle | 204 | 118 (1.9) | 86 (0.9) | – | – |
| 5–9 bottle | 194 | 92 (1.5) | 102 (1.1) | – | – |
| 1–4 bottle | 2,769 | 834 (13.5) | 1,935 (20.9) | – | – |
| No consumption | 12,273 | 5,127 (83.1) | 7,146 (77.1) | – | – |
| Fruit milk tea | 317.68 |
| |||
| ≥10 bottle | 199 | 106 (1.7) | 93 (1.0) | – | – |
| 5–9 bottle | 273 | 104 (1.7) | 169 (1.8) | – | – |
| 1–4 bottle | 3,433 | 929 (15.1) | 2,504 (27.0) | – | – |
| No consumption | 11,535 | 5,032 (81.5) | 6,503 (70.2) | – | – |
| Cream cap milk tea | 100.12 |
| |||
| ≥10 bottle | 186 | 111 (1.8) | 75 (0.8) | – | – |
| 5–9 bottle | 161 | 76 (1.2) | 85 (0.9) | – | – |
| 1–4 bottle | 1,316 | 384 (6.2) | 932 (10.1) | – | – |
| No consumption | 13,777 | 5,600 (90.8) | 8,177 (88.2) | – | – |
| The volume of drinking milk tea/time | 933.52 |
| |||
| Oversize cup (around 1,000 ml) | 134 | 75 (1.2) | 59 (0.6) | – | – |
| Large cup (around 750 ml) | 2,610 | 827 (13.4) | 1,783 (19.2) | – | – |
| Medium cup (around 500 ml) | 4,825 | 1,271 (20.6) | 354 (38.3) | – | – |
| Small cup (around 380 ml) | 861 | 311 (5.0) | 550 (5.9) | – | – |
| No consumption | 7,010 | 3,687 (59.8) | 3,323 (36.0) | – | – |
|
| |||||
| Eating takeaway food | 199.51 |
| |||
| Yes | 9,959 | 3,569 (57.8) | 6,390 (68.9) | – | – |
| No | 5,481 | 2,602 (42.2) | 2,879 (31.1) | – | – |
|
| |||||
| Stir-fried dishes | 55.71 |
| |||
| ≥8 times | 386 | 184 (3.0) | 202 (2.2) | – | – |
| 5–7 times | 945 | 382 (6.2) | 563 (6.1) | – | – |
| 2–4 times | 3,441 | 1,198 (19.4) | 2,243 (24.2) | – | – |
| ≤1 times | 10,668 | 4,407 (71.4) | 6,261 (67.5) | – | – |
| Grilled and deep-fried skewers | 11.18 |
| |||
| ≥8 times | 109 | 57 (0.9) | 52 (0.6) | – | – |
| 5–7 times | 280 | 128 (2.1) | 152 (1.6) | – | – |
| 2–4 times | 1,351 | 530 (8.6) | 821 (8.9) | – | – |
| ≤1 times | 13,700 | 5,456 (88.4) | 8,244 (88.9) | – | – |
| Rice noodles and wheat-based noodles | 109.23 |
| |||
| ≥8 times | 310 | 143 (2.3) | 167 (1.8) | – | – |
| 5–7 times | 925 | 347 (5.6) | 578 (6.2) | – | – |
| 2–4 times | 3,843 | 1,275 (20.7) | 2,568 (27.7) | – | – |
| ≤1 times | 10,362 | 4,406 (71.4) | 5,956 (64.3) | – | – |
| Western fast food | 18.40 |
| |||
| ≥8 times | 110 | 63 (1.0) | 47 (0.5) | – | – |
| 5–7 times | 386 | 174 (2.8) | 212 (2.3) | – | – |
| 2–4 times | 2,289 | 904 (14.7) | 1,385 (14.9) | – | – |
| ≤1 times | 12,655 | 5,030 (81.5) | 7,625 (82.3) | – | – |
| Spicy hot pot skewers (Malatang) | 91.75 |
| |||
| ≥8 times | 143 | 61 (1.0) | 82 (0.9) | – | – |
| 5–7 times | 389 | 147 (2.4) | 242 (2.6) | – | – |
| 2–4 times | 2,172 | 668 (10.8) | 1,504 (16.2) | – | – |
| ≤1 times | 12,736 | 5,295 (85.8) | 7,441 (80.3) | – | – |
| Conventional Chinese hotpot (Huoguo) | 6.04 | 0.110 | |||
| ≥8 times | 104 | 48 (0.8) | 56 (0.6) | – | – |
| 5–7 times | 322 | 134 (2.2) | 188 (2.0) | – | – |
| 2–4 times | 1,308 | 488 (7.9) | 820 (8.9) | – | – |
| ≤1 times | 13,706 | 5,501 (89.1) | 8,205 (88.5) | – | – |
| Steamed buns and dim sum | 8.93 |
| |||
| ≥8 times | 144 | 61 (1.0) | 83 (0.9) | – | – |
| 5–7 times | 569 | 225 (3.6) | 344 (3.7) | – | – |
| 2–4 times | 1,931 | 713 (11.6) | 1,218 (13.1) | – | – |
| ≤1 times | 12,796 | 5,172 (83.8) | 7,624 (82.3) | – | – |
| Desserts | 238.71 |
| |||
| ≥8 times | 242 | 97 (1.6) | 145 (1.5) | – | – |
| 5–7 times | 703 | 240 (3.9) | 463 (5.0) | – | – |
| 2–4 times | 3,326 | 964 (15.6) | 2,362 (25.5) | – | – |
| ≤1 times | 11,169 | 4,870 (78.9) | 6,299 (68.0) | – | – |
| Groups | Total | Only depression | Only anxiety | Comorbidity | χ2-value | |
|---|---|---|---|---|---|---|
|
| ||||||
| Drinking milk tea | 47.22 |
| ||||
| Yes | 8,430 | 189 (2.2) | 892 (10.6) | 1,711 (20.3) | – | – |
| No | 7,010 | 164 (2.3) | 548 (7.8) | 1,307 (18.6) | – | – |
|
| ||||||
| Conventional milk tea | 207.08 |
| ||||
| ≥10 bottle | 204 | 1 (0.5) | 5 (2.5) | 76 (37.3) | – | – |
| 5–9 bottle | 194 | 3 (1.5) | 11 (5.7) | 99 (51.0) | – | – |
| 1–4 bottle | 2,769 | 71 (2.6) | 307 (11.1) | 596 (21.5) | – | – |
| No consumption | 12,273 | 278 (2.3) | 1,117 (9.1) | 2,247 (18.3) | – | – |
| Fruit milk tea | 203.11 |
| ||||
| ≥10 bottle | 199 | 1 (0.5) | 8 (4.0) | 72 (36.2) | – | – |
| 5–9 bottle | 273 | 4 (1.5) | 23 (8.4) | 120 (44.0) | – | – |
| 1–4 bottle | 3,433 | 83 (2.4) | 424 (12.4) | 684 (19.9) | – | – |
| No consumption | 11,535 | 265 (2.3) | 985 (8.5) | 2,142 (18.6) | – | – |
| Cream cap milk tea | 242.38 |
| ||||
| ≥10 bottle | 186 | 1 (0.5) | 6 (3.2) | 71 (38.2) | – | – |
| 5–9 bottle | 161 | 1 (0.6) | 9 (5.6) | 87 (54.0) | – | – |
| 1–4 bottle | 1,316 | 21 (1.6) | 138 (10.5) | 358 (27.2) | – | – |
| No consumption | 13,777 | 330 (2.4) | 1,287 (9.3) | 2,502 (18.2) | – | – |
|
| ||||||
| Eating takeaway food | 33.26 |
| ||||
| Yes | 9,959 | 233 (2.3) | 1,008 (10.1) | 2,007 (20.2) | – | – |
| No | 5,481 | 120 (2.2) | 432 (7.9) | 1,011 (18.4) | – | – |
|
| ||||||
| Stir-fried dishes | 140.27 |
| ||||
| ≥8 times | 386 | 8 (2.1) | 40 (10.4) | 98 (25.4) | – | – |
| 5–7 times | 945 | 20 (2.1) | 94 (9.9) | 271 (28.7) | – | – |
| 2–4 times | 3,441 | 76 (2.2) | 354 (10.3) | 800 (23.2) | – | – |
| ≤1 times | 10,668 | 249 (2.3) | 952 (8.9) | 1,849 (17.3) | – | – |
| Grilled and deep-fried skewers | 564.55 |
| ||||
| ≥8 times | 109 | 4 (3.7) | 10 (9.2) | 49 (45.0) | – | – |
| 5–7 times | 280 | 3 (1.1) | 17 (6.1) | 155 (55.4) | – | – |
| 2–4 times | 1,351 | 29 (2.1) | 108 (8.0) | 485 (35.9) | – | – |
| ≤1 times | 13,700 | 317 (2.3) | 1,305 (9.5) | 2,329 (17.0) | – | – |
| Rice noodles and wheat-based noodles | 200.07 |
| ||||
| ≥8 times | 310 | 10 (3.2) | 26 (8.4) | 95 (30.6) | – | – |
| 5–7 times | 925 | 23 (2.5) | 76 (8.2) | 290 (31.4) | – | – |
| 2–4 times | 3,843 | 89 (2.3) | 450 (11.7) | 835 (21.7) | – | – |
| ≤1 times | 10,362 | 231 (2.2) | 888 (8.6) | 1,798 (17.4) | – | – |
| Western fast food | 513.00 |
| ||||
| ≥8 times | 110 | 6 (5.5) | 10 (9.1) | 51 (46.4) | – | – |
| 5–7 times | 386 | 7 (1.8) | 28 (7.3) | 196 (50.8) | – | – |
| 2–4 times | 2,289 | 60 (2.6) | 236 (10.3) | 660 (28.8) | – | – |
| ≤1 times | 12,655 | 280 (2.2) | 1,166 (9.2) | 2,111 (16.7) | – | – |
| Spicy hot pot skewers (Malatang) | 393.15 |
| ||||
| ≥8 times | 143 | 7 (4.9) | 19 (13.3) | 54 (37.8) | – | – |
| 5–7 times | 389 | 6 (1.5) | 32 (8.2) | 181 (46.5) | – | – |
| 2–4 times | 2,172 | 46 (2.1) | 212 (9.8) | 616 (28.4) | – | – |
| ≤1 times | 12,736 | 294 (2.3) | 1,177 (9.2) | 2,167 (17.0) | – | – |
| Conventional Chinese hotpot (Huoguo) | 572.69 |
| ||||
| ≥8 times | 104 | 5 (4.8) | 8 (7.7) | 48 (46.2) | – | – |
| 5–7 times | 322 | 5 (1.6) | 22 (6.8) | 173 (53.7) | – | – |
| 2–4 times | 1,308 | 19 (1.5) | 107 (8.2) | 469 (35.9) | – | – |
| ≤1 times | 13,706 | 324 (2.4) | 1,303 (9.5) | 2,328 (17.0) | – | – |
| Steamed buns and dim sum | 315.10 |
| ||||
| ≥8 times | 144 | 4 (2.8) | 15 (10.4) | 53 (36.8) | – | – |
| 5–7 times | 569 | 9 (1.6) | 52 (9.1) | 210 (36.9) | – | – |
| 2–4 times | 1,931 | 33 (1.7) | 198 (10.3) | 563 (29.2) | – | – |
| ≤1 times | 12,796 | 307 (2.4) | 1,175 (9.2) | 2,192 (17.1) | – | – |
| Desserts | 310.85 |
| ||||
| ≥8 times | 242 | 13 (5.4) | 21 (8.7) | 83 (34.3) | – | – |
| 5–7 times | 703 | 19 (2.7) | 72 (10.2) | 267 (38.0) | – | – |
| 2–4 times | 3,326 | 76 (2.3) | 356 (10.7) | 774 (23.3) | – | – |
| ≤1 times | 11,169 | 245 (2.2) | 991 (8.9) | 1,894 (17.0) | – | – |
| Groups | Only depression | Only anxiety | Comorbidity | |||
|---|---|---|---|---|---|---|
| OR (95% CI) | OR (95% CI) | OR (95% CI) | ||||
|
| ||||||
| Yes | 0.97 (0.77∼1.21) | 0.772 | 1.33 (1.18∼1.50) |
| 1.16 (1.06∼1.26) |
|
| No | 1 | – | 1 | – | 1 | – |
|
| ||||||
| Yes | 1.06 (0.84∼1.34) | 0.640 | 1.23 (1.09∼1.40) |
| 1.09 (1.00∼1.20) | 0.051 |
| No | 1 | – | 1 | – | 1 | – |
| Milk tea beverage consumption | Takeaway food consumption | Only depression | Only anxiety | Comorbidity | |||
|---|---|---|---|---|---|---|---|
| OR (95% CI) | OR (95% CI) | OR (95% CI) | |||||
| Drinking milk tea × eating takeaway food | 1.01 (0.76–1.33) | 0.969 | 1.67 (1.43–1.95) |
| 1.24 (1.11–1.38) |
| |
| Drinking milk tea × non-eating takeaway food | 0.86 (0.58–1.27) | 0.448 | 1.38 (1.13–1.69) |
| 1.00 (0.86–1.16) | 0.965 | |
| Non-drinking milk tea × eating takeaway food | 0.98 (0.72–1.34) | 0.889 | 1.27 (1.06–1.52) |
| 0.98 (0.87–1.11) | 0.786 | |
| Non-drinking milk tea × non-eating takeaway food | 1 | – | 1 | – | 1 | – | |
Peer Reviews
No public reviews on file for this paper yet. If you reviewed it on a platform where reviews are public (OpenReview, ICLR, NeurIPS, ICML), you can paste yours below so the community can read it here.
Videos
No videos yet. Explain this paper in a talk, walkthrough, or lecture? Add one.
Taxonomy
TopicsConsumer Attitudes and Food Labeling · Culinary Culture and Tourism · Nutritional Studies and Diet
Introduction
Depression and anxiety are among the most prevalent mental health disorders worldwide, particularly in adolescents and young adults (1). According to the Global Burden of Disease 2021 study, the prevalence of depressive and anxiety disorders increases substantially from early adolescence (10–19 years: 2.43% and 4.94%, respectively) to young adulthood (20–24 years: 4.79% and 5.80%) (2). These trends may be largely attributed to academic pressure, social relationship challenges, and the stress of job seeking. A systematic review from the United Kingdom reported that high academic pressure was strongly associated with poor mental health. Similarly, a cross-sectional study of 10,676 Chinese university students found that social support played an important role in mitigating psychological distress (3). Notably, depression and anxiety are highly comorbid, with many students experiencing both simultaneously (4). For instance, one study during the COVID-19 pandemic reported that the prevalence of depressive symptoms, anxiety symptoms, and their comorbidity among Chinese university students was 37.0%, 24.9%, and 20.9%, respectively (5). Prolonged exposure to these conditions can severely impair health and, in severe cases, lead to suicidal behavior, underscoring the urgent need to address university students’ mental health.
The contributing factors of depression and anxiety are diverse, including environmental (6), genetic (7), lifestyle (8), and socio-demographic factors (9). Among lifestyle factors, dietary habits have received growing research attention as potential modifiable risk factors for psychological symptoms in adolescents (10). A multicenter cross-sectional study of 14,340 Chinese university students found that low physical activity and frequent takeaway food consumption were positively associated with the comorbidity of depression and anxiety, with a significant combined association (11). Another study of 5,281 Beijing college students reported that milk tea consumption was common, and higher intake was associated with increased risks of depressive symptoms, anxiety symptoms, and suicidal ideation (12). Evidence also suggests that healthy dietary patterns—such as higher fruit and vegetable intake—are linked to better mental health, whereas unhealthy diets, characterized by frequent fast food or sugar-sweetened beverage consumption, increase the risk of depression, anxiety, and stress (13). For example, a Korean study found that individuals with high intake of both fast food and sugar-sweetened beverages had 1. 28-, 1. 59-, and 1.32-fold higher odds of stress, depression, and suicidal ideation, respectively (14). Similarly, a study in Hong Kong young adults (aged 18–27 years) showed that diets high in fat, sugar, and sodium were associated with greater odds of depressive and anxiety symptoms (15). Notably, Chinese university students frequently engage in unhealthy eating behaviors and have low nutrition literacy (16), such as skipping breakfast (17), eating late at night (18), eating irregularly (19), and preferring fast food, barbecue, or milk tea (20, 21). The popularity and convenience of takeaway food on campus further exacerbate the consumption of unhealthy options (22). Therefore, universities should prioritize interventions to improve students’ dietary behaviors and mental health.
Currently, previous studies have explored the associations between specific dietary behaviors [i.e., breakfast (23), sugar-sweetened beverage (24), fast food (25), vegetable (26), soybean product (27)] and psychological issues among university students (28). However, most studies have examined the relationship between individual dietary behaviors and mental health in isolation, and the combined association of multiple dietary factors remain unclear (29). Moreover, several studies have found that typical unhealthy dietary behaviors among university students (i.e., sugar-sweetened beverage, fast food, and takeaway food consumption) are adversely associated with mental health (30). Nevertheless, the subcategories of food or beverage types have not been considered in these studies (31). At present, milk tea and takeaway food are popular among students on campus due to their pleasant taste, variety of choices, and convenience (32). However, limited research has examined the association between milk tea and takeaway food consumption and psychological issues (33), and the potential combined association between them remain unclear. To bridge these research gaps, we conducted a multicenter cross-sectional study to investigate the associations of milk tea and takeaway food consumption with psychological symptoms among Chinese university students. The hypotheses of the present study are as follows:
Hypothesis 1 (H1): Milk tea and takeaway food consumption are positively associated with depression symptoms, anxiety symptoms, and their comorbidity among university students.
Hypothesis 2 (H2): Milk tea and takeaway food consumption exert a positive combined association on depression symptoms, anxiety symptoms, and their comorbidity among university students.
Hypothesis 3 (H3): The combined association of milk tea and takeaway food consumption on depression symptoms, anxiety symptoms, and their comorbidity vary across different combinations of consumption types.
Methods and participants
Sample estimation
The minimum sample size for this epidemiological cross-sectional study was calculated using the formula: “n = μ_α_^2^ρ (1−ρ)/δ^2^.” In this formula, ρ represents the prevalence rate, δ denotes the admissible error (δ = 0.1 × ρ), μ_α_ is the critical value from the standard normal distribution corresponding to a 95% confidence level (μ_α_ = 1.96). Based on the comorbidity rate of depression and anxiety (23.75%) reported in the study by Zhang et al. (11), the calculated minimum sample size was 1,234. Considering an anticipated 10% sample loss and 10% invalid responses, the final minimum required sample size was 1,481.
Sampling method
Following the principle of convenience sampling, we surveyed seven partner universities located in Shanghai, Jiangxi, Hubei, and Shanxi provinces, China, between September and November 2023. First, in each participating university, six departments (three liberal arts departments and three science departments) were randomly selected. Second, four grades were chosen within each department. Third, three administrative classes were randomly selected from each grade. However, as most students in the junior and senior grades were engaged in internships, additional freshman students were recruited to ensure the sample size could achieve the desired statistical power. The average population size of each administrative class was approximately 35–40 students. In total, the present study involved seven universities, 42 departments, 504 administrative classes, and approximately 17,000 students. Before the survey, students were informed of the study’s purpose and assured that participation was voluntary. Written informed consent was obtained from all participants. The study was approved by the Ethics Committee of Jiangxi Medical School (approval number: R2022-2).
Participants
In the present study, participants were Chinese university students aged 18–22 years. The process of online questionnaire distribution and participant inclusion was as follows. The questionnaires were administered via the Wenjuanxing platform. A total of 17,000 questionnaires were distributed, and 16,633 were returned, yielding a recovery rate of 97.84%. Among the collected questionnaires, 193 were completed in less than five minutes, 369 contained obvious errors (e.g., inconsistent responses), 330 were incomplete, and 301 reported ages outside the target range. These questionnaires were excluded, resulting in 15,440 valid questionnaires, with a validity rate of 92.83% (15,440/16,633) (see Figure 1). Ultimately, 15,440 university students (aged 18–22 years, mean age 20.80 ± 1.47 years) were included in the analysis. Among them, 6,171 (39.97%) were male and 9,269 (60.03%) were female; 6,457 (41.82%) were from urban areas, and 8,983 (58.18%) were from rural areas (see Table 1).
The flow chart.
Socio-demographic information
Socio-demographic characteristics were collected via self-reported questionnaires, including age, sex (male, female), household registration (urban, rural), grade (freshman, sophomore, junior, senior), father’s education (primary school or below, middle school, high school/vocational school, college or above), mother’s education (primary school or below, middle school, high school/vocational school, college or above), annual family income (≤50,000, 50,000–100,000, 100,001–300,000, ≥300,001), and BMI status (underweight, normal, overweight, obese). BMI was calculated as weight (kg) divided by height squared (m^2^), measured during physical education classes before the survey. BMI categories were determined according to the WHO classification criteria (2006).
Depression and anxiety symptom assessment
Depression and anxiety symptoms were assessed using the Chinese version of the Depression Anxiety and Stress Scale (DASS-21). This scale contains 21 items across three dimensions assessing depression, anxiety, and stress symptoms. Each item has four response options: 0 (“Did not apply to me at all”), 1 (“Applied to me to some degree or some of the time”), 2 (“Applied to me to a considerable degree or a good part of the time”), and 3 (“Applied to me very much or most of the time”). Scores for each dimension were summed and then multiplied by two, as per DASS-21 scoring guidelines. In this study, a depression score ≥ 10 indicated depressive symptoms, and an anxiety score ≥ 8 indicated anxiety symptoms. Based on symptom type, participants were further classified into: ? only depression symptoms (depression score ≥ 10 and anxiety score < 8), ? only anxiety symptoms (depression score < 10 and anxiety score ≥ 8), and ? comorbidity (depression score ≥ 10 and anxiety score ≥ 8). Besides, the Cronbach’s α coefficients for the depression and anxiety dimensions were 0.905 and 0.932, respectively.
Milk tea and takeaway food behavior assessment
Dietary behaviors were assessed via self-reported questionnaires on milk tea and takeaway food consumption in the past seven days.
Milk tea behavior assessment
Milk tea consumption was evaluated using a semi-quantitative food frequency questionnaire adapted from previous studies. The first question, “Have you consumed milk tea in the past seven days?”, identified whether participants had engaged in this behavior. This 7-day window was pre-specified to minimize recall bias and to align with common practice in national dietary surveillance and recent university-based food frequency questionnaires. According to prior literature and the findings of the present survey (20), milk tea was categorized into conventional milk tea, fruit milk tea, and cream cap milk tea. The second question assessed the frequency of consumption for each type, with four options: “No consumption,” “1–4 bottles,” “5–9 bottles,” and “≥10 bottles.” In addition, individuals reporting milk tea consumption of more than one bottle were classified as having the corresponding type of milk tea consumption behavior.
Takeaway food behavior assessment
Similarly, takeaway food consumption was assessed with two items. The first question, “Have you consumed takeaway food in the past seven days?”, identified relevant behaviors. The second question investigated the frequency of consumption of eight popular takeaway food types in China: stir-fried dishes, grilled and deep-fried skewers, rice noodles and wheat-based noodles, Western fast food, spicy hot pot skewers (Malatang), conventional Chinese hotpot (Huoguo), steamed buns and dim sum, and desserts. Each item offered nine options, ranging from “0 times” to “more than 8 times per week.” Based on previous literature and participants consumption situations, the groups as follow “≤1 time,” “2–4 times,” “5–7 times,” and “≥8 times” (34). In addition, participants who reported consuming takeaway food more than once were categorized as having the corresponding type of takeaway food consumption behavior.
Quality control
The survey was conducted by trained university teachers and students. Before data collection, all investigators received standardized training. The online questionnaire was distributed during class meetings via a controlled link to ensure each student could complete it only once. Investigators were available to answer questions during the survey. Completed questionnaires were collected and verified on-site. The survey took approximately 40 minutes to complete, and each participant received a small doll pendant as a token of appreciation.
Statistical analysis
Continuous variables were presented as means ± standard deviations (M ± SD), and categorical variables were expressed as numbers and percentages. The Chi-square test was used to compare differences in types of psychological symptoms, milk tea consumption behaviors, and takeaway food consumption behaviors by sex. In addition, Chi-square tests were also applied to examine the univariate associations between types of psychological symptoms and both milk tea and takeaway food consumption behaviors. Multivariate logistic regression models were then performed to assess the independent and combined associations of milk tea and takeaway food consumption behaviors with different types of psychological symptoms. Odds ratios (OR) and 95% confidence intervals (95% CI) were derived from the logistic regression models and visualized using forest plots. A p-value < 0.05 was considered statistically significant. All statistical analyses were conducted using IBM SPSS Statistics version 27.0 (IBM Corp., Armonk, NY, United States), and plots were generated using R software version 4.5.0 (R Foundation for Statistical Computing, Vienna, Austria).
Results
Basic characteristics of participants
A total of 15,440 students aged 18–22 years from seven universities were included in the present study. Among them, 39.97% (6,171/15,440) were male and 60.03% (9,269/15,440) were female. Rural students accounted for a larger proportion than urban students (58.18% vs. 41.82%). The distribution of participants by academic grade was as follows: freshmen, 58.55% (9,040/15,440); sophomores, 19.57% (3,022/15,440); juniors, 13.38% (2,066/15,440); and seniors, 8.50% (1,312/15,440) (Table 1).
Prevalence of psychological symptoms and dietary behaviors
The prevalence of only depression symptoms, only anxiety symptoms, and comorbidity was 2.29% (353/15,440), 9.33% (1,440/15,440), and 19.55% (3,018/15,440), respectively. Notably, comorbidity prevalence was significantly higher in males than in females (21.6% vs. 18.2%), whereas only anxiety symptoms were more common in females than in males (10.7% vs. 7.2%) (χ^2^ = 71.52, p < 0.001).
Overall, 54.60% of students reported consuming milk tea in the past 7 days, with a significantly higher proportion among females than males (64.1% vs. 40.3%). Most students reported consuming 1–4 bottles per week, with fruit milk tea being the most preferred type (Table 2). Similarly, a greater proportion of females than males reported takeaway food consumption (68.9% vs. 57.8%). Females were more likely to consume stir-fried dishes, rice noodles/wheat-based noodles, spicy hot pot skewers (Malatang), and desserts, whereas males favored stir-fried dishes and rice noodles/wheat-based noodles (Table 2).
Associations of milk tea and takeaway food consumption with psychological symptoms
Univariate analyses showed that the prevalence of psychological symptom types differed significantly by milk tea and takeaway food consumption status (Table 3). In multivariate logistic regression analyses adjusting for demographic and lifestyle covariates, milk tea consumption was associated with a higher likelihood of only anxiety symptoms (OR = 1.33, 95% CI: 1.18–1.50) and comorbidity (OR = 1.16, 95% CI: 1.06–1.26; both p < 0.001) compared with no consumption. Takeaway food consumption was also associated with an increased likelihood of only anxiety symptoms (OR = 1.23, 95% CI: 1.09–1.40, p < 0.001) (Table 4). When frequency of consumption was considered, most categories of milk tea were positively associated with only depression symptoms, only anxiety symptoms, and comorbidity (OR range: 1.40–1.65; 95% CI: 1.03–2.68; all p < 0.05). However, some negative associations were observed: ≥10 bottles/week of conventional milk tea was inversely associated with only anxiety symptoms (OR = 0.19, 95% CI: 0.04–0.88), and 1–4 bottles/week of cream cap milk tea was inversely associated with only depression symptoms (OR = 0.60, 95% CI: 0.36–0.99) (Figure 2).
*The association between milk tea consumption and psychological symptoms status. *P < 0.05; **P < 0.01; **P < 0.001.
For takeaway food, most consumption types were positively associated with psychological symptoms, especially comorbidity. Grilled and deep-fried skewers, western fast food, conventional Chinese hotpot (Huoguo), and steamed buns/dim sum were associated with significantly increased odds of comorbidity. Interestingly, rice noodles/wheat-based noodles consumption was positively associated with only anxiety symptoms at 2–4 times/week (OR = 1.31, 95% CI: 1.12–1.54) but inversely associated with comorbidity at both 2–4 times/week (OR = 0.85, 95% CI: 0.74–0.96) and 5–7 times/week (OR = 0.78, 95% CI: 0.63–0.98) (Figure 3).
*The association between takeaway food consumption and psychological symptoms status. *P < 0.05; **P < 0.01; **P < 0.001.
Combined association of milk tea and takeaway food consumption
Interaction analysis in multivariate logistic regression models showed that the combination of milk tea and takeaway food consumption was positively associated with only anxiety symptoms (OR = 1.67, 95% CI: 1.43–1.95) and comorbidity (OR = 1.24, 95% CI: 1.11–1.38; both p < 0.05) (Table 5).
Further analyses of specific combinations revealed that, compared with students who consumed neither milk tea nor takeaway food, most combinations were significantly associated with only anxiety symptoms and comorbidity. In particular, students who preferred cream cap milk tea in combination with certain takeaway foods had the highest odds of comorbidity—especially grilled and deep-fried skewers (OR = 4.25, 95% CI: 3.61–5.02), western fast food (OR = 3.45, 95% CI: 2.96–4.03), and conventional Chinese hotpot (Huoguo) (OR = 4.02, 95% CI: 3.41–4.73) (Figure 4).
*The association of various milk tea and takeaway food behavior combinations with psychological symptoms status. *P < 0.05; **P < 0.01; **P < 0.001.
Discussion
In this large, population-based cross-sectional study, milk tea consumption and takeaway food consumption were both associated with a higher likelihood of psychological symptoms and their comorbidity among Chinese university students. Furthermore, significant combined association of these dietary behaviors on different psychological symptom profiles were observed. These findings highlight the need for greater attention to the potential mental health risks associated with such consumption patterns.
Several previous studies have reported associations between milk tea consumption or takeaway food consumption and psychological symptoms. For example, Li et al. investigated 9,000 college students in East China and found that, compared with the reference group, consuming milk tea 4–5 times and ≥6 times per week was associated with 1.98- and 2.46-fold higher odds of comorbid overweight/obesity and depression symptoms, respectively (35). Similarly, Xu et al. reported that milk tea consumption was positively associated with depression among 31,856 Chinese students (36). However, some controversy exists. In contrast, a longitudinal observational study from Chongqing, China, found no significant multivariate association between milk tea consumption and mental health problems among 686 male university students (37). In addition, several studies have explored the relationship between takeaway food and mental health outcomes. For instance, Tan et al. reported that frequent takeaway food consumption was significantly associated with higher depression symptom scores among 6,417 Chinese freshman students (38). Likewise, Whatnall et al. found a positive dose–response relationship between takeaway food consumption frequency and psychological distress in 2,710 Australian university students (39). Notably, although some prior studies have examined the association of milk tea and takeaway food consumption on mental health in university populations, the combined association of these behaviors on psychological symptoms remains unclear. To date, only one study has reported their combined association on overweight and obesity among Chinese university students (40). Our study extends this literature by focusing on the combined association of milk tea and takeaway food consumption on psychological symptom status, particularly across different combinations of food types.
In the present study, we observed that students who engaged in both milk tea consumption and takeaway food consumption reported a higher prevalence of comorbid depression and anxiety symptoms in the univariate association analysis. Based on this, we further conducted multivariate logistic regression analyses. The results showed that, compared with individuals who did not consume milk tea or takeaway food, those who consumed milk tea had 1.33- and 1.16-fold higher odds of experiencing only anxiety symptoms and comorbidity, respectively, while those who consumed takeaway food had 1.23-fold higher odds of experiencing only anxiety symptoms. Furthermore, higher levels of different types of milk tea and takeaway food consumption were positively associated with psychological symptoms in most groups, particularly for comorbidity (see Table 5). These findings are consistent with those of Li et al. (40), Tan et al. (38), and they also confirm H1 in our study. The biological mechanisms linking milk tea and takeaway food consumption to psychological symptoms are well-documented. A growing body of research indicates that milk tea contains high levels of sugar, fat, and excessive additives (41). Similarly, most Chinese takeaway food has been reported to involve overcooking and to contain excessive oil and sodium (42, 43). Previous studies have shown that excessive intake of sugar, sodium, and oil can lead to neuroinflammation, oxidative stress, and dysregulation of neurotransmitter function in the brain, all of which are associated with mental health disorders (44–46). However, some contrasting results emerged. For instance, consuming 1–4 bottles of cream cap milk tea or ≥10 bottles of conventional milk tea was negatively associated with psychological symptoms. A plausible explanation for these unexpected findings could be reverse causation: individuals with fewer psychological symptoms may be more socially active and proactive in daily life, participating more frequently in social gatherings that lead to higher milk tea consumption (47). By contrast, those experiencing psychological issues and sleep problems may deliberately limit or avoid caffeinated, sugar-sweetened beverages, so lower intake reflects symptom-driven behavior change rather than any protective effect of milk tea itself (48). Moreover, people with a generally positive emotional state may simply derive greater enjoyment from drinking milk tea. Notably, Similarly, specific takeaway food items—such as rice noodles and wheat-based noodles—were negatively associated with comorbidity, although the reasons for this are unclear. Nevertheless, it is important to note that not all takeaway food consumption was adversely associated with psychological symptoms. Some studies suggest that healthier takeaway options—such as fruits, vegetables, rice, wheat, and soybean products—may benefit mental health by providing vitamins, dietary fiber, and high-quality fats, all of which can support the regulation of negative emotions (49, 50). The present results suggest that, future work should apply causal-inference methods and longitudinal or quasi-experimental designs to better estimate the effects of dietary intake on psychological symptoms.
Given the significant associations observed for both milk tea consumption and takeaway food consumption with psychological symptoms, we further examined their combined association on different mental health outcomes. The results showed that the significantly positive combined association was observed between these two behaviors and psychological symptoms. Compared with reference group, those who consumed both in milk tea and takeaway food have a 1.67-folds and 1.24-folds likelihood of suffering from only anxiety symptoms and comorbidity. This results verified H_2_ in the present study, see Table 5. Based on that, we furtherly explored the association between different type of milk tea and takeaway food combination. After adjusting for confounding, the results indicated that most combinations between milk tea and takeaway food have an adverse association with only anxiety symptoms and comorbidity. The H_3_ had been verified by this results. Interestingly, the combinations item including cream cap milktea, grilled and deep-fried skewers, spicy hot pot skewers (Malatang), western fast food, and Chinese hotpot (Huoguo) showed higher likelihood of suffering from comorbidity. For instance, the cream cap milk tea combined with grilled and deep-fried skewers were showed the highest odds of suffering from comorbidity (OR = 4.25, 95% CI = 3.61–5.02). Notably, no matter cream cap milk tea or those aforementioned takeaway food, they were containing more unhealthy ingredients (i.e., excessive fat, sugar, and sodium etc.) compared to their counterparts, especially for those takeaway food cooked by stir-fry or deep fried. Therefore, the present results suggest that it’s important to pay special attention to the combined consumption of high fat and high sugar milk tea and deep fried or stir-fry takeaway food.
The present study examined the association of milk tea consumption and takeaway food consumption on psychological symptoms among Chinese university students. Compared with previous research, this large-scale population-based study additionally identified an adverse combined association between these two behaviors. In contemporary, milk tea and takeaway food are highly popular among Chinese young adults. National reports indicate that nearly 81.1% of university students consume beverages, including milk tea, one to three times per week (51), and more than 70% order takeaway food on a weekly basis (52). Moreover, in 2025, the three leading food delivery platforms in China launched large-scale takeaway subsidy campaigns to consolidate their dominant market positions, further stimulating the consumption of both takeaway food and milk tea among university students. Given the high prevalence of these dietary behaviors and their potential to exacerbate the burden of psychological symptoms, there is an urgent need for targeted interventions.
This study has several notable strengths. To our knowledge, this is the first investigations to examine both the independent and combined association of milk tea and takeaway food consumption on psychological symptoms among Chinese university students. Besides, the large sample size and inclusion of multiple food categories allowed for robust statistical analyses. Nevertheless, several limitations should be acknowledged. Firstly, as a cross-sectional study, our findings can only suggest potential associations and offer limited capacity for causal inference. Second, the use of retrospective dietary epidemiology questionnaires is inevitably subject to information bias. Thirdly, we did not measure other sugar-sweetened beverages, so the specific effect of milk tea cannot be disentangled from overall beverage patterns. The inverse associations in some milk tea categories may reflect substitution or displacement (e.g., choosing milk tea over sodas/energy drinks) or co-consumption/selection effects, rather than a protective effect. Finally, some factors previously identified as being associated with psychological health, including smoking, alcohol consumption, and negative life events, were not comprehensively collected in our study. Future research should implement longitudinal cohort studies to better clarify whether milk tea and takeaway food consumption lead to psychological symptoms. It should also apply more accurate dietary assessment methods and include additional relevant factors such as smoking, alcohol consumption, other sugar-sweetened beverages consumption, and negative life events.
In conclusion, this study found that milk tea and takeaway food consumption had a significant combined association on psychological symptoms among Chinese university students. Schools should strengthen dietary and mental health education to reduce such consumption behaviors and help improve students’ psychological well-being.
The reference list from the paper itself. Each links out to its DOI / PubMed record.
- 1World Health Organization [WHO] Mental health of adolescents 2024. Geneva: WHO (2025).
- 2Yang CH Lv JJ Kong XM Chu F Li ZB Lu W Global, regional and national burdens of depression in adolescents and young adults aged 10-24 years, from 1990 to 2019: findings from the 2019 Global Burden of Disease study. Br J Psychiatry. (2024) 225:311–20. 10.1192/bjp.2024.69 38660761 · doi ↗ · pubmed ↗
- 3Campbell F Blank L Cantrell A Baxter S Blackmore C Dixon J Factors that influence mental health of university and college students in the UK: a systematic review. BMC Public Health. (2022) 22:1778. 10.1186/s 12889-022-13943-x 36123714 PMC 9484851 · doi ↗ · pubmed ↗
- 4Wang C Yan S Jiang H Guo Y Gan Y Lv C Socio-demographic characteristics, lifestyles, social support quality and mental health in college students: a cross-sectional study. BMC Public Health. (2022) 22:1583. 10.1186/s 12889-022-14002-1 35987998 PMC 9392273 · doi ↗ · pubmed ↗
- 5Zhou SJ Wang LL Qi M Yang XJ Gao L Zhang SY Depression, anxiety, and suicidal ideation in chinese university students during the COVID-19 pandemic. Front Psychol. (2021) 12:669833. 10.3389/fpsyg.2021.669833 34421725 PMC 8375404 · doi ↗ · pubmed ↗
- 6Zhang Y Wu T Yu H Fu J Xu J Liu L Green spaces exposure and the risk of common psychiatric disorders: a meta-analysis. SSM Popul Health. (2024) 25:101630. 10.1016/j.ssmph.2024.101630 38405164 PMC 10885792 · doi ↗ · pubmed ↗
- 7Tabrizi F Rosén J Grönvall H William-Olsson VR Arner E Magnusson PK Heritability and polygenic load for comorbid anxiety and depression. Transl Psychiatry. (2025) 15:98. 10.1038/s 41398-025-03325-3 40140358 PMC 11947153 · doi ↗ · pubmed ↗
- 8Zhu J Xiong J Tang L Xiao H Cai Z Song Y Association between sleep characteristics, physical activity patternswith depressive and anxiety symptoms in college students. Chin J Sch Health. (2025) 46:552–7. 10.16835/j.cnki.1000-9817.2025104 · doi ↗