Genome-Wide Association Study of Body Mass Index in a Commercial Landrace × Yorkshire Crossbred Pig Population
Long Jin, Chunyan Bai, Jinghan Chen, Chengyue Feng, Fengyi Dong, Xiaoran Zhang, Junwen Fei, Yu He, Wuyang Liu, Changyi Chen, Boxing Sun, Dali Wang, Hao Sun

TL;DR
This study identifies genetic markers linked to body mass index in pigs, offering insights for breeding healthier herds and potentially informing human obesity research.
Contribution
The study provides new genetic markers and validates carcass-based BMI as a reliable trait for pig breeding.
Findings
BMI in pigs is heritable with moderate-to-high heritability estimates of 0.55 and 0.47 for BMI-S and BMI-O.
17 genome-wide significant SNPs were identified, including rs81382440 and rs80898583, linked to fat metabolism and growth.
Carcass-based BMI improves phenotypic accuracy for breeding and offers insights into lipid deposition and body conformation.
Abstract
We analyzed the DNA of 439 Landrace × Yorkshire crossbred commercial pigs and pinpointed specific genetic markers strongly associated with Body Mass Index (BMI). We demonstrated that BMI is a heritable trait and that calculating it based on carcass straight length (CSL) is more reliable for breeding. Several of the implicated genes are known to influence fat metabolism and growth. Our findings enhance the understanding of the genetic architecture governing pig body structure. The identified markers can assist breeders in efficiently selecting animals with superior conformation, promoting healthier herds and potentially improving meat quality, while this work may offer comparative insights into human obesity research. The Body Mass Index (BMI), integrating body weight and length, is a widely used metric for obesity assessment in humans. As pigs serve as crucial biomedical models, the…
Genes, proteins, chemicals, diseases, species, mutations and cell lines named across the full text — each resolved to its canonical identifier and authoritative record.
Click any figure to enlarge with its caption.
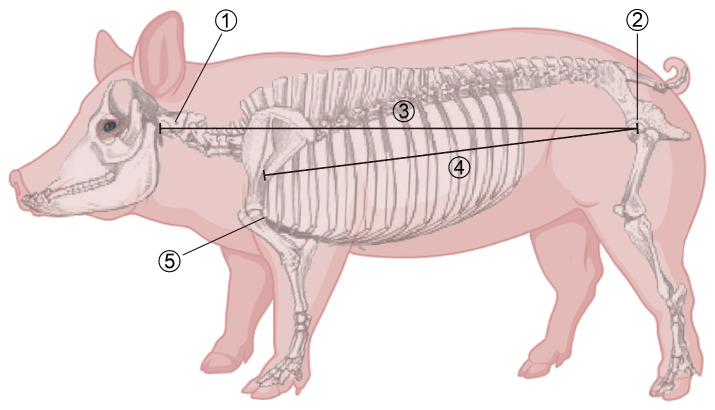 Figure 1
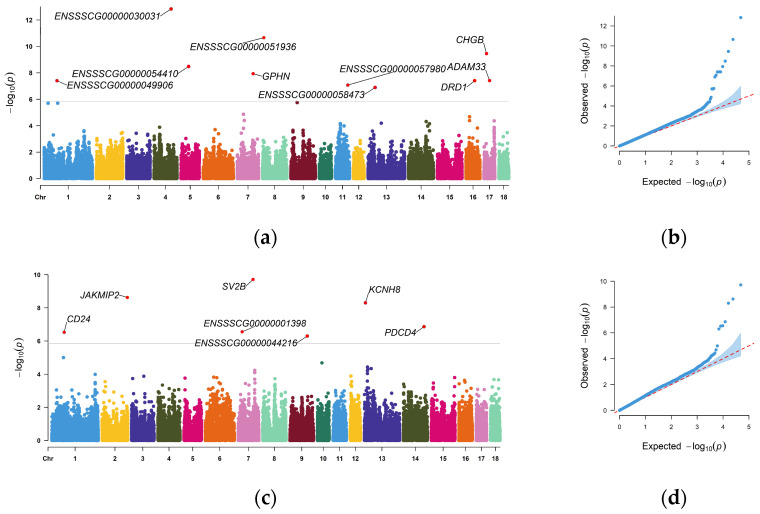 Figure 2
- —Jilin Provincial Natural Science Foundation
Peer Reviews
No public reviews on file for this paper yet. If you reviewed it on a platform where reviews are public (OpenReview, ICLR, NeurIPS, ICML), you can paste yours below so the community can read it here.
Videos
No videos yet. Explain this paper in a talk, walkthrough, or lecture? Add one.
Taxonomy
TopicsGenetic Mapping and Diversity in Plants and Animals · Genetic and phenotypic traits in livestock · Regulation of Appetite and Obesity
1. Introduction
Pork occupies a pivotal position in global meat consumption, with its yield and quality directly impacting the economic efficiency of animal husbandry and consumer demand [1]. With advancements in breed selection and management practices, consumer preferences have evolved, shifting breeding objectives from a primary focus on growth rate and lean meat percentage towards increased emphasis on meat quality-related traits [2]. Consequently, in-depth research on body conformation and fat deposition patterns in pigs is paramount. Among various metrics, the Body Mass Index (BMI), which incorporates both weight and length information, has garnered increasing attention [3]. However, a primary limitation of BMI is its inability to distinguish between lean muscle mass and adipose tissue, meaning that individuals with different body compositions may possess identical BMI scores. As a composite trait, BMI not only reflects overall growth and development but may also reveal intrinsic links between fat deposition and body structure [4,5].
In human medicine, BMI is extensively used for obesity assessment and metabolic disease prediction, demonstrating its unique value as a composite trait [4,6,7]. Its potential application in pig genetics and breeding is gradually emerging. Individual previous studies have reported that BMI can indirectly indicate the extent of fat deposition in pigs, correlating closely with carcass traits like backfat thickness [8,9], and potentially linking to metrics such as body symmetry [10]. Therefore, BMI serves not only as a comprehensive phenotypic indicator for evaluating slaughter performance and body fat distribution but also provides reference information for meat quality improvement [11]. However, compared to extensively studied slaughter traits like backfat thickness and loin muscle area, research on porcine BMI remains relatively scarce, and its molecular genetic basis has not been systematically elucidated.
The pig Quantitative Trait Locus (QTL) database systematically archives reported functional genetic loci associated with economic traits, providing a crucial reference framework for subsequent GWAS to dissect the genetic mechanisms of complex quantitative traits [12,13]. As a key tool for mining trait-associated genetic variations, GWAS has been widely applied in pig genetics. Numerous studies have used GWAS to analyze various pig populations. These studies identified SNPs associated with three types of traits: growth traits like average daily gain and days to 100 kg, body measurement traits like body length and body height, and backfat thickness. Corresponding candidate genes, such as tribbles pseudokinase 3 (TRIB3) and ELOVL fatty acid elongase 6 (ELOVL6), were also identified. Among these, Hong et al. also found high phenotypic and genetic correlations between body length and body height traits [14,15,16]. These studies have propelled in-depth exploration of pig growth, development, body conformation, and meat quality traits. However, the BMI indicator is not included in the QTL database, which limits the comprehensive analysis of porcine BMI. The current genetic dissection of economic traits like growth and body measurements in pigs remains incomplete. Association results often fluctuate considerably due to differences in the genetic background of study populations, leading to insufficient consistency across studies. Although the existing QTL database contains numerous records of genetic loci for pig economic traits, the variability in GWAS results across populations makes it difficult to fully validate and supplement the genetic information for some traits, necessitating studies on new populations to refine the related mechanisms. Crossbred populations, owing to their rich genetic diversity, provide excellent material for elucidating the mechanisms underlying complex traits.
The objectives of this study were to determine the heritability of BMI, identify key genomic SNPs and candidate genes, and elucidate its genetic regulatory basis in pigs. We also aimed to lay a theoretical foundation for applying Marker-Assisted Selection (MAS) to improve fat deposition and body conformation. We utilized a population of 439 Landrace × Yorkshire crossbred commercial pigs; using 50 K SNP chip genotyping data and phenotypic measurements of carcass weight and length to calculate BMI, we systematically estimated the genetic parameters of BMI and conducted a GWAS.
2. Materials and Methods
2.1. Phenotypic Data Preparation
The experimental animals were sourced from an intensive pig farm in Tongyu County, Baicheng City, Jilin Province, China. The target population was a commercial pig herd derived from rotational crossing of Landrace and Yorkshire pigs. All experimental procedures involving animals were approved by the Institutional Animal Care and Use Committee of Jilin University (Protocol No. SY202507020). These pigs were raised under standardized environmental conditions and feeding regimes to ensure population stability and uniformity. A total of 439 healthy pigs with a uniform age of 180–200 days were selected. All pigs were slaughtered according to industry-standard procedures, during which carcass weight (CW, unit: kg), carcass straight length (CSL, unit: m), and carcass oblique length (COL, unit: m) were accurately recorded for each individual (Figure 1).
Based on the measured CW, CSL, and COL data, the Body Mass Index (BMI) for each pig was calculated using the following formulas:
Here, CSL and COL were used separately to calculate the BMI values for each pig, aiming to compare and determine the more valuable metric for assessing BMI. The significance of the correlation was assessed using a two-tailed t-test, with the significance level set at p < 0.05.
2.2. Genotypic Data Preparation
Following phenotypic data collection, approximately 2 g of fresh muscle tissue was collected from the Longissimus dorsi muscle of each pig, placed in centrifuge tubes with 75% ethanol, and stored at −20 °C for DNA extraction. Genomic DNA was extracted using a commercial kit (DC112, Vazyme Biotech, Nanjing, China). Based on silica membrane column purification technology, tissues were lysed with buffer and Proteinase K to release DNA, ethanol was used to bind the DNA to the silica membrane column, and after removing impurities, the purified DNA was isolated. DNA purity was assessed spectrophotometrically using the A260/A280 ratio (acceptable range: 1.8–2.0) and A260/A230 ratio (acceptable range: 2.0–2.2) to evaluate nucleic acid quality. High-quality DNA samples from all 439 pigs were genotyped using the 50 K SNP chip, with genotyping services performed by MolBreeding Biotechnology (Science Park, Hong Kong SAR, China). Initial genotyping results underwent further processing and quality control (QC). Specifically, missing genotype data were imputed using BEAGLE v5.4 (https://faculty.washington.edu/browning/beagle/beagle.html, accessed on 2 July 2025) software to enhance data completeness. Imputed SNP data were subjected to QC using VCFtools (https://vcftools.github.io/index.html, accessed on 3 July 2025) with the following filtering criteria: exclusion of SNPs with a minor allele frequency (MAF) < 1%; exclusion of SNPs with a genotyping call rate < 90%; exclusion of all non-autosomal SNPs. After this QC pipeline, 45,487 qualified autosomal SNPs were retained for subsequent genomic association analyses with BMI traits. The minor allele frequency (MAF) analysis revealed a range of 5.0% to 50.0% (mean = 30.6%) among qualified SNPs, indicating adequate genetic diversity within the genotyped population.
2.3. Heritability Estimation
Genetic parameters for BMI were estimated using a mixed linear model implemented in the HIBLUP (V1.6.0) (https://www.hiblup.com/, accessed on 6 July 2025) software. The analysis model was as follows:
In the specified model, y denotes the vector of observed BMI phenotypic values. The vector b encompasses fixed effects, specifically age, sex, and slaughter batch. The vector a represents additive genetic effects and is assumed to follow a multivariate normal distribution, aN (0, Gσₐ^2^), where G is the genomic relationship matrix derived from SNP data to capture genetic relatedness, and σₐ^2^ is the additive genetic variance. The matrices X and Z are the incidence matrices for the fixed and random effects, respectively, e is the vector of residuals, assumed to follow eN (0, Iσₑ^2^), where I is the identity matrix and σₑ^2^ represents the residual variance. Heritability (h^2^) was calculated as follows:
2.4. Genome-Wide Association Analysis
GWAS for BMI was performed using the BLINK model implemented in the GAPIT (V3.0) (https://zzlab.net/GAPIT/, accessed on 6 July 2025) software. Unlike traditional mixed linear models or binning-based methods, this approach iteratively uses two fixed-effect models (FEMs) to select non-highly linked pseudo-QTNs as covariates, based on Bayesian Information Criterion (BIC) and linkage disequilibrium (LD) information. It removes the restrictive assumption of evenly distributed QTNs and avoids REML optimization’s computational cost in random-effect models. This method effectively controls false positives from population structure and cryptic relatedness, while boosting statistical power for causal loci detection and computational efficiency [17]. To mitigate false positives due to population stratification, the first three principal components (PCs) were included as covariates in the analysis. The genome-wide significance threshold was determined by Bonferroni correction, i.e., p = 0.05/N, where N is the total number of SNPs. After QC, 45,487 SNPs were retained with a significance threshold of p < 1.10 × 10^−6^. SNPs with p-values below this threshold were identified as significant loci. Furthermore, the Q-Q plot and genome inflation factor (λ) were used to assess systematic bias and population stratification in the GWAS results.
2.5. Functional Annotation of Significant Loci
Significantly associated SNPs were mapped to the Sus scrofa 11.1 reference genome (Ensembl, https://www.ensembl.org/Sus_scrofa/Info/Index?db=core, accessed on 8 July 2025). The PigQTLdb and PigBiobank databases were queried to determine if these SNPs had been previously reported in association with carcass traits or fat deposition. This provided support for subsequent functional inference. Furthermore, genomic regions 500 kb upstream and downstream of significant SNPs were defined as candidate regions for retrieving protein-coding genes [18,19,20]. This interval was based on the average linkage disequilibrium (LD) decay rate in commercial Landrace × Yorkshire pig populations. It was chosen to conservatively include potential causal variants. Candidate gene annotation primarily relied on the Ensembl database, supplemented by GeneCards and relevant literature for functional characterization.
3. Results
3.1. Descriptive Statistics of Phenotypes
Table 1 summarizes the descriptive statistics for CW, CSL, COL, and the two calculated BMI types (BMI-S and BMI-O) in the analyzed population of 439 Landrace × Yorkshire crossbred pigs. Analysis of phenotypic variation revealed that carcass weight exhibited the highest degree of variation, with a coefficient of variation (CV) of 9.7%, whereas CSL and COL showed less variation, with CVs of 4.28% and 4.27%, respectively. In contrast, BMI-S and BMI-O, as composite traits, displayed moderate variation (CVs of 7.83% and 7.06%, respectively), indicating that these integrate metrics successfully incorporate the phenotypic differences from both weight and length components.
Phenotypically, BMI-O was significantly higher than BMI-S, a difference directly attributable to the distinct measurement dimensions of CSL (mean 98.49 cm) and COL (mean 84.85 cm). The shorter COL measurement path results in a smaller denominator in the calculation, thereby producing a larger BMI value. Despite this difference in absolute values, the variation trends of the two BMI types were consistent. Both traits exhibited moderate to high heritability, with BMI-S (0.55) being slightly higher than BMI-O (0.47).
3.2. GWAS Results
GWAS was performed on the BMI phenotypes (BMI-S and BMI-O) of the 439 Landrace × Yorkshire crossbred pigs using the BLINK model. The genome-wide significance threshold, determined by Bonferroni correction, was p = 0.05/45487, corresponding to −log10(p) = 5.96. Figure 2 presents the Manhattan and Q-Q plots for the BMI-S and BMI-O GWAS results. For both traits, several significant SNP signals deviate from the diagonal in the upper right region of the Q-Q plots, consistent with the signals observed in the Manhattan plots. The genomic inflation factors (λ) were calculated as 1.141 for BMI-S and 1.187 for BMI-O.
Table 2 and Table 3 list the significant SNPs identified for BMI-S and BMI-O traits, respectively. For BMI-S, 10 genome-wide significant SNPs were detected, distributed across nine autosomes: 1, 4, 5, 7, 8, 11, 13, 16, and 17. For BMI-O, 7 genome-wide significant SNPs were identified, spanning six autosomes: 1, 2, 7, 9, 13, and 14. For BMI-S, the top SNP (rs340169919, located within the GPHN gene) accounted for the maximum phenotypic variation of 11.95%. For BMI-O, the top SNP (rs81329425, adjacent to JAKMIP2) accounted for 17.25% of phenotypic variation. Among these, 13 SNPs were located in intergenic regions, with distances to the nearest gene ranging from 0.53 kb to 259.57 kb, all within the ±500 kb candidate gene search window.
Among the genome-wide significant SNPs identified for BMI-S, the SNP on chromosome 4 (rs81382440) exhibited the strongest association signal (p = 1.45 × 10^−13^), with the nearest gene being ENSSSCG00000030031. The SNP on chromosome 8 (rs323983749, p = 2.18 × 10^−11^) and the SNP on chromosome 17 (rs318768688, p = 3.50 × 10^−10^) had the next strongest association signals after the chromosome 4 SNP (rs81382440). For BMI-O, the SNP on chromosome 7 (rs80898583) exhibited the strongest association signal (p = 1.93 × 10^−10^), with the nearest gene being SV2B. The SNP on chromosome 2 (rs81329425, p = 2.38 × 10^−9^) and the SNP on chromosome 13 (rs325326100, p = 5.01 × 10^−9^) had the next strongest association signals.
3.3. Functional Annotation of Candidate Genes
Among the total 17 significant SNPs, five (rs81382440, rs80821336, rs318768688, rs81236078, rs80818436) have been previously recorded in the PigQTL database (Release 57), and thirteen are included in the PigBiobank database. Cross-referencing these databases revealed that the significant SNPs from this study are biologically linked to multiple economically important carcass traits, providing potential molecular markers for Marker-Assisted Selection (MAS). Specifically, integration of association results showed that: rs81382440 is associated with tongue weight, loin muscle area, average daily gain, and lean percentage [21]; rs80821336 is associated with traits like Longissimus dorsi depth [22]; rs318768688 is associated with traits such as body length, body height, BMI, dressing percentage, average daily gain, and lean percentage [23]; rs81236078 is associated with dressing percentage, backfat thickness, Longissimus dorsi depth, etc. [24]; rs80818436 is associated with mean corpuscular volume [25]. Consistently, rs318768688 was also significantly linked to BMI-S (p = 3.50 × 10^−10^) in our study. This cross-population confirmation supports its potential as a cross-population core locus for BMI-related breeding. The remaining SNPs are also associated with numerous carcass-related traits: rs323983749, rs81346303, rs80898583, rs320272214 are associated with lean percentage, backfat thickness, loin muscle area, etc.; rs322495291, rs327543988, rs81329425 are associated with loin muscle depth; rs81445106 is associated with average daily gain and days to 30 kg, etc.; rs325326100 is not associated with carcass traits but is linked to reproductive indicators like litter size and litter weight. The association of rs81382440 with growth and meat quality traits supports the existence of a genetic link between porcine BMI and meat quality, consistent with prior studies [26,27], and opens possibilities for indirect meat quality improvement through BMI selection.
We next examined SNPs located within or near known genes. Four SNPs: rs340169919, rs81346303, rs325326100, and rs320272214 are located within the GPHN, ADAM33, KCNH8, and PDCD4 genes, respectively. To further clarify the functional roles of candidate genes associated with our significant SNPs, we performed GO and KEGG enrichment analyses for genes within a ±500 kb window (Figures S1 and S2). The GO terms were enriched for processes related to growth and metabolic regulation (e.g., immune response, signal transduction). KEGG pathways included metabolic pathways and the NF-κB signaling pathway, both widely involved in energy metabolism and metabolic homeostasis.
4. Discussion
In anthropological and related metabolic health research, body mass index (BMI), as a classic anthropometric parameter, is commonly used to estimate an individual’s fat deposition levels [28]. This study revealed that significant SNPs for BMI traits were distributed across multiple chromosomes, supporting a polygenic regulatory architecture. This finding aligns with the expectation that BMI, as a composite measure of weight and skeletal size, is influenced by numerous synergistic genes and pathways. This is supported by evidence that over 200 genomic loci and core genes like FTO and MC4R are linked to BMI regulation through interconnected signaling networks [29]. The reliable dissection of such a polygenic trait, however, fundamentally depends on accurate phenotypic measurement. We calculated BMI using post-slaughter carcass traits (CW, CSL, COL) rather than the live body measurements common in earlier research. Live measurements are susceptible to error from animal movement, posture variation, and subjective assessment [30]. In contrast, carcass traits are measured on stationary specimens using standardized anatomical landmarks (Figure 1), which substantially improves phenotypic precision. This methodological refinement is reflected in our heritability estimates, which for BMI-S (0.55) and BMI-O (0.47) were notably higher than those reported in prior studies relying on live-animal data. Johnson et al. [31] estimated the heritability of BMI via the multi-trait REML method in four pig breeds (Landrace, Yorkshire, Duroc, and Hampshire) and reported a moderately low range of 0.16 to 0.25. Wu et al. [32] reported a moderately low BMI heritability of 0.157 in Yunong-black pigs via a single-step GWAS with a 50 K SNP Chip. The enhanced heritability underscores the reliability of our phenotypic data and strengthens the subsequent genetic analyses. In addition, Huang et al. [33] reported that BMI heritability in Dongliao black pigs gradually increases with body weight gain (0.01–0.49). This indicates that fat deposition becomes the main driver of growth in the late stages, so the higher the body weight, the higher the heritability of BMI. Furthermore, we found that BMI-S, which incorporates the torso-reflective CSL, showed a higher coefficient of variation (7.83% vs. 7.06%) and greater heritability than BMI-O, indicating its superior ability to capture genetically regulated variation in body structure and fat deposition. Lastly, most previous heritability estimates for pig BMI have been derived from purebred populations [31,34]. In contrast, our results from a commercial Landrace × Yorkshire crossbred population provide valuable genetic parameter data for hybrids, offering insights into how genetic background influences BMI regulation.
Among the 17 significant SNPs, five and thirteen have been previously annotated in the PigQTL and PigBiobank databases, respectively, where they are linked to various economically important carcass and growth traits. Specifically, four SNPs are located within known genes: rs340169919 (GPHN), rs81346303 (ADAM33), rs325326100 (KCNH8), and rs320272214 (PDCD4). They may influence phenotypic regulation by affecting gene transcription, mRNA splicing, or encoded amino acid sequences. Of these, GPHN modulates the GABAergic system to affect energy metabolism and body weight in mice [35]. ADAM33 SNPs are associated with rapid-growth-period body weight in quails [36]. KCNH8 functions in voltage-gated potassium channels, implying potential roles in growth and metabolism [37,38]. PDCD4 can promote white adipogenesis by inhibiting the browning of white adipose tissue [39,40]. All four genes are relevant to BMI-related traits. For the intergenic SNPs, the nearest candidate genes include DRD1, CHGB, CD24, SV2B, and JAKMIP2. Among these, DRD1 expression can inhibit fat synthesis and promote lipolysis [41]. Pathways associated with CHGB involve insulin-like growth factor transport and protein metabolism [42]. CD24 negatively regulates PPARγ, affecting adipocyte differentiation and weight gain in mice [43]. SV2B expression correlates positively with indicators of lipid metabolism disorder and body weight [44,45]. The functional enrichment results provide evidence that the genomic regions harboring our significant SNPs are involved in BMI-related biological processes (e.g., fat synthesis, energy metabolism, growth), supporting the hypothesis that these SNPs regulate BMI through such core processes.
In summary, our study offers methodological and practical advancements for porcine breeding. The use of post-slaughter carcass measurements (CW, CSL, COL) to calculate BMI, as opposed to error-prone live measurements, provided highly accurate phenotypic data. Although BMI-O values are inherently higher than BMI-S due to the shorter measurement path of COL, both metrics showed consistent patterns of variation, validating our phenotypic approach. More importantly, BMI calculation relies solely on two easily obtainable metrics, weight and length, offering a low-cost and feasible indirect indicator for preliminary screening of complex traits like fat deposition and body conformation on commercial farms. Notably, this advantage is particularly prominent when compared to the traditional use of B-mode ultrasound to measure backfat thickness as an indicator of obesity. This kind of live measurement is prone to errors because pigs cannot be fully restrained during testing, making them susceptible to environmental stress that causes measurement point deviations [46]. Thus, BMI serves as a more accessible and reliable alternative for obesity-related trait screening in commercial pig breeding, effectively addressing the practical limitations of traditional methods like ultrasound and dissection.
Despite the promising findings, certain practical constraints should be noted. First, validation of the identified markers in diverse independent pig populations is needed. Our study focused on a single crossbred population and slaughter-related phenotypic data are hard to obtain in large quantities. Second, while plausible candidate genes were pinpointed via genomic positioning and functional annotation, their regulatory roles in BMI need further confirmation.
5. Conclusions
This study provides the first systematic elucidation of the genetic basis of BMI in crossbred commercial pigs. It also clarifies the breeding advantage of BMI-S and its core associated markers. It not only provides a theoretical basis and practical targets for molecular breeding of “body conformation–fat deposition” in pigs but also provides preliminary genetic information that may be useful for comparative genetic studies between porcine BMI and human obesity. Furthermore, BMI, as an easily measurable phenotype, offers value for the indirect assessment of complex fat deposition traits and can serve as an indirect selection method for complex traits. Future studies may focus on cross-population validation of the identified SNPs, functional characterization of key candidate genes, and their application in commercial pig molecular breeding.
The reference list from the paper itself. Each links out to its DOI / PubMed record.
- 1Godfray H.C.J. Aveyard P. Garnett T. Hall J.W. Key T.J. Lorimer J. Pierrehumbert R.T. Scarborough P. Springmann M. Jebb S.A. Meat consumption, health, and the environment Science 2018361 eaam 532410.1126/science.aam 532430026199 · doi ↗ · pubmed ↗
- 2Chen Q. Zhang W. Xiao L. Sun Q. Wu F. Liu G. Wang Y. Pan Y. Wang Q. Zhang J. Multi-omics reveals the effect of crossbreeding on some precursors of flavor and nutritional quality of pork Foods 202312323710.3390/foods 1217323737685169 PMC 10486348 · doi ↗ · pubmed ↗
- 3Nuttall F.Q. Body mass index: Obesity, BMI, and health: A critical review Nutr. Today 20155011712810.1097/NT.000000000000009227340299 PMC 4890841 · doi ↗ · pubmed ↗
- 4Wu Y. Li D. Vermund S.H. Advantages and limitations of the body mass index (BMI) to assess adult obesity Int. J. Environ. Res. Public Health 20242175710.3390/ijerph 2106075738929003 PMC 11204233 · doi ↗ · pubmed ↗
- 5Jeong S.-M. Lee D.H. Rezende L.F. Giovannucci E.L. Different correlation of body mass index with body fatness and obesity-related biomarker according to age, sex and race-ethnicity Sci. Rep.202313347210.1038/s 41598-023-30527-w 36859451 PMC 9977890 · doi ↗ · pubmed ↗
- 6Dulloo A.G. Jacquet J. Solinas G. Montani J.-P. Schutz Y. Body composition phenotypes in pathways to obesity and the metabolic syndrome Int. J. Obes.201034 S 4S 1710.1038/ijo.2010.23421151146 · doi ↗ · pubmed ↗
- 7Piqueras P. Ballester A. Durá-Gil J.V. Martinez-Hervas S. Redón J. Real J.T. Anthropometric indicators as a tool for diagnosis of obesity and other health risk factors: A literature review Front. Psychol.20211263117910.3389/fpsyg.2021.63117934305707 PMC 8299753 · doi ↗ · pubmed ↗
- 8Reyer H. Varley P.F. Murani E. Ponsuksili S. Wimmers K. Genetics of body fat mass and related traits in a pig population selected for leanness Sci. Rep.20177911810.1038/s 41598-017-08961-428831160 PMC 5567295 · doi ↗ · pubmed ↗