Trusted Sources of COVID-19 Vaccine Information by County Characteristics in North Carolina
Bryson T. Staley, Michael E. DeWitt, Jennifer J. Wenner, John W. Sanders, Thomas F. Wierzba, Katherine Poehling

TL;DR
This study explores how trust in vaccine information sources varies between rural and non-rural areas in North Carolina, aiming to improve vaccine communication strategies.
Contribution
The study identifies differences in trusted vaccine information sources between rural and non-rural counties and their political leanings in North Carolina.
Findings
Non-rural counties had higher trust in federal health agencies compared to rural counties.
Vaccinated rural respondents were more likely to trust federal health agencies than unvaccinated rural respondents.
Rural county residents were less likely to use hospital websites, employers, or news sources for vaccine information compared to non-rural residents.
Abstract
Background/Objectives: The COVID-19 pandemic disproportionately impacted rural areas across the United States, including rural North Carolina (NC). Consistent with national patterns, COVID-19 vaccination coverage as of December 2022 was higher for non-rural (72%) than rural (58%) NC counties. The role of trusted sources of vaccine information used by rural and non-rural residents is unknown. Methods: Using data from two surveys distributed by the COVID-19 Community Research Partnership from 8 June 2021 through 21 December 2021, we compared self-reported sources of trusted COVID-19 vaccine information by non-rural and rural counties and by county-level predominant political vote in the 2020 Presidential election. Results: While NC respondents were highly vaccinated (94%), fewer residents from rural counties self-reported COVID-19 vaccination than those from non-rural counties (91% versus…
Genes, proteins, chemicals, diseases, species, mutations and cell lines named across the full text — each resolved to its canonical identifier and authoritative record.
Click any figure to enlarge with its caption.
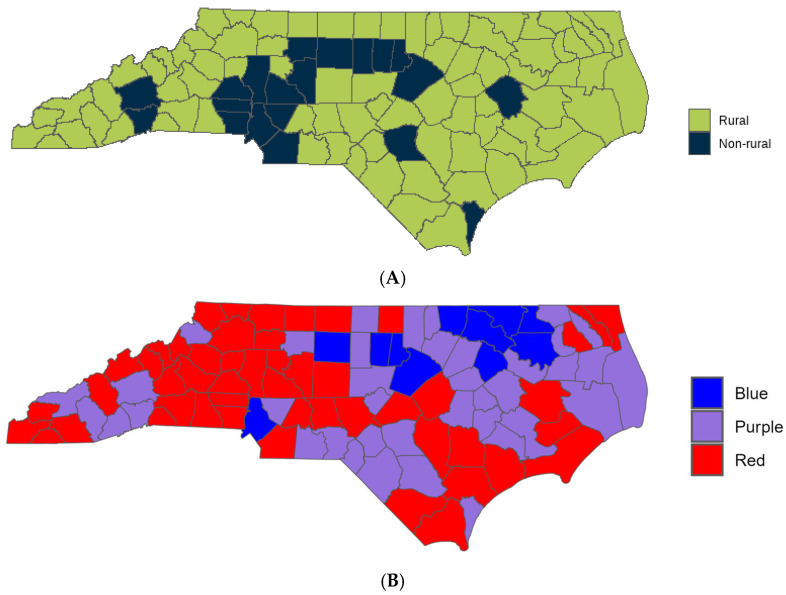 Figure 1
- —Centers for Disease Control and Prevention (CDC)
- —CARES Act of the U.S. Department of Health and Human Services (HHS)
Peer Reviews
No public reviews on file for this paper yet. If you reviewed it on a platform where reviews are public (OpenReview, ICLR, NeurIPS, ICML), you can paste yours below so the community can read it here.
Videos
No videos yet. Explain this paper in a talk, walkthrough, or lecture? Add one.
Taxonomy
TopicsVaccine Coverage and Hesitancy · Data-Driven Disease Surveillance · Public Health Policies and Education
1. Introduction
From 14 March 2020 through 6 May 2023, North Carolina (NC) recorded 3,501,404 cases and 29,059 deaths attributed to SARS-CoV-2 [1]. Rural NC residents were disproportionately affected as compared to non-rural counterparts [2]; for example, rural deaths were 0.4% and non-rural deaths were 0.2% [3]. Populations from rural counties systematically differ from non-rural counties by being older, having higher rates of co-morbidities, and having more limited access to health care [2]. These differences contribute to an increased vulnerability to illnesses, including COVID-19. From December 2020 through 26 April 2023, 63% of North Carolinians had completed the initial series of COVID-19 vaccination [4] with variations across the 100 NC counties [5]. Notably, vaccine acceptance in NC and the United States varied by race and ethnicity and across rural and non-rural regions [6].
Vaccine hesitancy is multifactorial, with many studies aimed at identifying factors involved in a personal decision to vaccinate or not. A multinational study conducted by the World Health Organization (WHO) examined potential factors associated with vaccine hesitancy by interviewing officials responsible for vaccine dissemination. Results indicated that vaccine hesitancy varies in importance across countries, but vaccine hesitancy can be linked to external factors such as religion, healthcare, and politics, as well as personal beliefs surrounding the safety and efficacy of a vaccine [7]. Specific to the COVID-19 vaccines, previous research by the COVID-19 Community Research Partnership (CCRP) identified self-reported factors behind a personal decision to vaccinate or not. Vaccinated respondents often cited reasons surrounding protecting themselves and those around them from the virus, while unvaccinated respondents often cited concerns about safety and the quickness of vaccine development [8]. Previous studies reported lower vaccination rates among minority groups [6,9]. However, vaccine uptake increased within these populations, who are at an increased risk for poor outcomes, by using tailored surveys and direct contact vaccine information [10].
We built on surveys from the CCPR that demonstrated a positive shift in attitude toward the COVID-19 vaccines across NC’s population. Vaccine uptake increased across all demographic groups regardless of the level of vaccine hesitancy reported at the start of the vaccine rollout [6]. This study is distinct and tests the hypothesis that the sources of trusted information would vary among people residing in rural and non-rural counties and by political leaning (as determined by county vote for the 2020 presidential election). The objective was to test the hypothesis that self-reported sources of trusted vaccine information would differ for respondents from rural and non-rural counties and by respondents who lived in counties that predominantly voted for the Republican candidate or Democratic candidate in the 2020 presidential election.
2. Materials and Methods
The COVID-19 Community Research Partnership (CCRP) was a prospective, multi-site, longitudinal study. The design and methods have been described in detail [11]. In summary, the CCRP includes two cohorts, one with six health systems in the mid-Atlantic region and southern USA, and the other with six health systems in North Carolina. Sites invite persons within their health care system, as well as community members, to participate in daily electronic symptoms surveillance, serological testing, risk behavior assessment, and electronic health record capture. Enrollment began in April 2020. Two supplemental vaccine hesitancy surveys in five of 10 CCRP sites, all located in North Carolina (1. Campbell University, 2. New Hanover Regional Medical Center, 3. Wake Forest Baptist Health, 4. WakeMed Health and Hospitals, 5. Vidant Health), were conducted via the CCRP between June and December 2021: one was directed toward participants who were vaccinated and another to those who were unvaccinated [6]. In the CCRP study, each person could respond to both surveys over the 7 months if they were vaccinated between the time the two surveys were distributed. If a respondent answered both surveys, only the first response was included in this analysis. This secondary analysis of the CCRP data set was conducted in accordance with the Declaration of Helsinki and approved by the Institutional Review Board of Wake Forest University School of Medicine (protocol number 109,129 and approved on 20 February 2024).
The survey questions were identical for the vaccinated and unvaccinated surveys. The survey included questions about age, sex, race/ethnicity, level of education, county residence, self-reported vaccination status, level of concern about getting COVID-19 before receiving the COVID-19 vaccine if vaccinated, and up to three trusted sources of information about COVID-19 vaccines. Options for trusted sources of information included community organizations, family and friends, federal health agencies, health insurers, health care providers, health system websites, employers, news sources, online medical websites, professional organizations, religious leaders, social media, state or local health officials, or other.
The NC county of residence was self-reported for all participants. County data was evaluated in two ways. (1) Each NC county was classified into rural or suburban/urban (non-rural); most counties in North Carolina are classified as rural with 19 of the 100 counties being classified as non-rural (Figure 1A). (2) The predominant 2020 presidential election vote for each county as a proxy for political leaning of the county (Figure 1B).
County data were classified by the CCRP using methodology from the 2013 NCHS Urban-Rural Classification Scheme for Counties [12] and supplemented by the NC Rural Center based on the 2014 US Census population estimates [13]. This secondary analysis of the CCRP data set utilized the same county classifications used in the initial analysis. Political leaning was determined by the 2020 Presidential election: Counties where >60% voted Democrat are classified as “Blue”, counties where >60% voted Republican are classified as “Red”, and counties where no more than 60% of the votes went toward a single party are classified as “Purple”.
The demographic characteristics of respondents and political leanings of the counties are reported overall and by rural and non-rural NC county of residence. These characteristics are described by counts and proportions for categorical variables and medians and interquartile ranges (IQR) for continuous variables, along with standardized mean differences (SMD) and their corresponding 95% confidence intervals. SMDs were used to assess the magnitude of differences between groups, with values <0.10 considered negligible, 0.10–0.20 small, 0.20–0.50 moderate, and >0.50 large [14].
The primary outcome was self-reported trusted sources of information and was evaluated by each predictor variable (rural versus non-rural county and political leaning of county in 2020 Presidential election). Bivariate analyses were performed by Pearson’s Chi-squared or Fisher’s exact test, and the standardized mean difference was computed. Both the p-value of the bivariate analysis and the q-value, which is the p-value with false discovery rate correction for multiple testing, are reported [15]. To further elucidate trusted sources of vaccine information among rural respondents, a secondary analysis was performed post hoc.
A secondary outcome was to characterize factors impacting vaccine uptake. A multivariate logistic regression model was performed with reported vaccination status as the dependent variable and with demographic characteristics (age, sex, race/ethnicity), county-level classifications (rural vs. non-rural; 2020 election results categorized as Blue, Purple, or Red), and respondents’ top trusted sources of vaccine information as independent variables. Only information sources selected by at least 200 respondents were retained in the model. The study did not have sufficient power to include interactions in this model. Variance Inflation Factors (VIF) and adjusted VIFs were examined to assess multicollinearity. All predictors had VIFs well below the threshold of 5, indicating low multicollinearity. Standard VIFs ranged from 1.00 to 1.57, and adjusted VIFs ranged from 1.00 to 1.24. The highest VIF was observed for political affiliation (VIF = 1.57, adj. VIF = 1.12) and county classification (VIF = 1.54, adj. VIF = 1.24). Tolerance values ranged from 0.64 to 1.00, further supporting the absence of problematic collinearity.
3. Results
A total of 33,815 surveys were obtained from 17,869 respondents between June and December 2021. The June 2021 survey for unvaccinated persons had 1615 responses from 1090 participants. The December 2021 survey for vaccinated persons had 32,200 surveys from 17,101 participants (Table 1). A total of 322 respondents self-reported being both unvaccinated and vaccinated, and the first (unvaccinated) response was included in this analysis. Independent of county of residence, respondents primarily identified as female and white with an average age of 53 (Table 1). Majority of respondents reported having earned a graduate or bachelor’s degree and being “moderately” or “very concerned” about contracting COVID-19 before receiving the vaccine.
Each respondent could select up to 3 of the 14 choices of trusted sources of information about COVID-19; an average of 2.4 trusted sources of information were selected per respondent. The proportion reporting 1, 2, and 3 trusted sources of information was 20.5%, 21.1%, and 58.4%, respectively. The top 3 most trusted sources of information for both rural and non-rural counties (Table 2) were federal agencies (78%), state and local health officials (48%), and health care providers (42%). Trusted sources reported by 10–15% of respondents were employers (14%), news media (12%), medical websites (13%), and hospital websites (10%). All other trusted resources were reported (<10%), with the most frequent selection being family and friends (8%).
Significantly more non-rural than rural respondents reported the following trusted sources of information: federal health agencies, hospital system websites, my employer, and news sources (Table 2). While federal health agencies were the most reported trusted sources of information for all respondents, fewer rural (72%) than non-rural (80%) respondents reported this source. Among the four sources reported by 10–15% of respondents, fewer rural than non-rural respondents selected employers, news media, or hospital websites as a trusted source of information. Among infrequently reported sources (<1%), more rural than non-rural respondents selected religious leaders.
Rural and non-rural counties had a large effect size by the proportion who voted Republican or Democratic in the 2020 Presidential election (Table 3). Most respondents (66%) from rural counties resided in Red counties (voted Republican), whereas most (56%) non-rural respondents resided in Blue counties (voted Democrat).
To further understand the insights of 3141 rural respondents, we evaluated up to three reported trusted sources of information by self-reported vaccination status on the first survey response. The 9.5% who reported being unvaccinated identified an average of 1.7 trusted sources of information about the COVID-19 vaccine; the 90.5% who self-reported being vaccinated identified an average of 2.3 trusted sources of information (Table 2). The top 3 reported trusted sources among rural respondents (Table 4) systematically differed by self-reported vaccination status. The three most common selections for vaccinated respondents were (1) federal agencies, (2) healthcare providers, and (3) state and local health officials. The three most common selections for unvaccinated respondents were (1) federal agencies, (2) healthcare providers, and (3) medical websites. Notably, fewer unvaccinated than vaccinated respondents selected federal health agencies (42% vs. 75%), state and local health officials (16.5% vs. 50%), and health care providers (34% vs. 43%) as a trusted source of information. The unvaccinated respondents reported trusting sources such as online publishers of medical information (20% vs. 14%), professional organizations (8% vs. 5%), social media (3% vs. 1%), and other sources (17.5% vs. 3%) more than vaccinated respondents. The unvaccinated respondents were less likely to report news (4% vs. 12%) and hospital system websites (2% vs. 9%) as trusted sources than vaccinated respondents. There were no significant differences in the frequency of reporting family and friends, employers, or religious leaders.
Among all respondents, 37% resided in Blue (Democratic) counties, 24% in Red (Republican) Counties, and 39% in Purple counties. The most frequently selected trusted sources (Table 5), regardless of political classification, were federal health agencies, state and local health officials, and health care providers. More respondents residing in Blue counties selected federal agencies, state and local health officials, and news sources than respondents residing in Red counties (q < 0.001 for each).
In the multivariable logistic regression analysis for predicting vaccine uptake (Table 6), older age was significantly associated with higher odds of vaccination (OR = 1.04 per year increase in age, 95% CI: 1.03–1.04, p < 0.001). Males had 50% greater odds of being vaccinated compared to females (OR = 1.50, 95% CI: 1.27–1.77, p < 0.001). Race/ethnicity was also significant: White respondents (OR = 1.74, 95% CI: 1.23–2.40, p = 0.001) had higher odds compared to Black respondents. Living in a Red county, but not a Purple county, was associated with substantially lower odds of vaccination (OR = 0.53, 95% CI: 0.43–0.65, p < 0.001). Non-rural residence had a non-significant trend compared to rural (OR = 1.19, 95% CI: 0.99–1.44, p = 0.065). Trusted sources showed strong associations: respondents who trusted federal health agencies (OR = 4.68), state/local health officials (OR = 3.37), or their employer (OR = 4.09) had markedly higher odds of vaccination (all p < 0.001). Trust in healthcare providers (OR = 1.84), news sources (OR = 2.12), hospital system websites (OR = 2.42), and professional organizations (OR = 1.32) also significantly increased odds (p < 0.05). Trust in online publishers and family/friends was not significantly associated.
4. Discussion
Trusted sources of information across respondents from rural and non-rural counties and by self-reported vaccination status had both commonalities and differences. Overall, the most trusted source of information was federal health agencies, state and local health officials, and health care providers. While federal health agencies were most frequently cited, the proportion reporting this source was higher among respondents who resided in non-rural than rural counties (72% vs. 80%) and among rural respondents who reported being vaccinated than unvaccinated (75% vs. 42%). There were also differences in the trusted sources of information selected by 10–15% of respondents; hospital system websites, employer, and news sources were more frequently reported by non-rural than rural respondents. 2020 presidential election results varied by rural and non-rural counties and respondents who resided in counties that voted Republican in the 2020 Presidential election were less likely to cite federal health agencies, news sources, or state or local health officials than respondents who resided in counties that voted Democratic in the 2020 Presidential election.
Although both political leaning and rurality were associated with vaccination status, the magnitude of effect differed substantially. Residence in Red counties was linked to markedly lower odds of vaccination compared with Blue counties (OR = 0.53, 95% CI 0.43–0.65), while the rural versus non-rural distinction showed only a borderline association (OR = 1.19, 95% CI 0.99–1.44). Beyond these contextual factors, trust in information sources emerged as an even stronger predictor of vaccination: respondents who trusted federal health agencies (OR = 4.68, 95% CI 4.05–5.40), their employer (OR = 4.09, 95% CI 3.14–5.43), or state/local health officials (OR = 3.37, 95% CI 2.82–4.05) had dramatically higher odds of being vaccinated, underscoring the critical role of institutional trust in shaping uptake.
The findings from this study are consistent with previous studies where rural counties had a higher percentage of unvaccinated residents than non-rural counties [8,16]. This study builds on previous research by elucidating differences in trusted sources of information among rural and non-rural counties and the political leaning of a county. Earlier research highlighting the success of the Meningitis Vaccine Project (MVP) and its utilization of a communication strategy including healthcare professionals, local leaders, and members from the target community further emphasizes the importance of identifying key partners in differing NC regions that maximize future vaccine implementation efforts [17].
Respondents from rural and non-rural counties reported similar sources of trusted information regarding COVID-19 with federal agencies (e.g., Centers for Disease Control and Prevention (CDC), NIH, Food and Drug Administration (FDA)), hospital system websites, employers, and news sources being selected most frequently. Federal agencies were the most frequent self-reported source of vaccine information for both rural and non-rural counties. While we measured self-reported trusted sources of information and not trust itself, this finding is consistent with research that reported increased trust in the government increased vaccine acceptance [18]. While rarely reported, religious leaders were more frequently selected as a self-reported trusted source of vaccine information by respondents from rural than non-rural counties. Influences from outside sources, such as social media, reporting contradictory information as well as changing COVID-19 guidelines based upon new data may have caused respondents from rural counties to seek information from sources closer to them [19]. A previous study found that among Evangelicals, clergy who supported the COVID-19 vaccine positively correlated with vaccine uptake amongst their congregation; however, congregants who went to clergy for advice concerning vaccination were less likely to receive the vaccine [20]. This finding may indicate that for some communities partnering with religious leaders could potentially improve future vaccine implementation efforts.
Our results are compatible with previous studies that found a positive relationship between vaccine hesitancy and social media use for vaccine information with increased use of social media use being associated with increased vaccine hesitancy [18,21].
Our results are also compatible with a study showing that Republican confidence in the government declined between 2020 and 2021 and that attitudes surrounding government trust vary based on the political party in power [22]. We found that respondents who resided in counties that voted >60% Democrat for the 2020 Presidential election were more likely to trust information from federal agencies, news sources, and state or local health officials than respondents who resided in counties that voted >60% Republican for the 2020 Presidential election. While respondents from rural counties predominantly voted Republican in the 2020 presidential election and were less likely to be vaccinated, rural counties vary and have many different influences affecting a person’s decision to vaccinate or not. Taking the political leaning of each county into accoun may influence the trusted sources of information and help design future public health outreach efforts.
This study has several limitations. Given that the respondents of this study self-reported being primarily 42–64 years of age, female, white, and possessing a bachelor’s degree or higher, the results of this study may not be generalizable to the greater NC population or the US population. Since respondents were already connected to a healthcare system, they may have been more comfortable responding to a survey from a healthcare system. The information collected was self-reported and so social desirability biases are possible. This study classified each NC county as rural or non-rural as that was the most granular data available, however many NC counties contain both rural and non-rural regions within the county. The political leaning of each county was determined by the predominant vote for the 2020 Presidential election just before the onset of the COVID-19 pandemic. The results may vary if other political measures were assessed. We compared proportions, which implicitly acknowledges the variability within each county, and acknowledge that not every person who resides in a County voted or shares the same opinions as the majority. Respondents from both rural and non-rural counties were combined to assess trusted sources of information with political leaning because of the significant overlap in rural and non-rural counties and preponderant county vote for 2020 Presidential election, we cannot differentiate between the influence of county political leaning and county rurality.
5. Conclusions
In conclusion, this study examines self-reported trusted sources of COVID-19 vaccine information from residents of both rural and non-rural NC counties and compares it to respondents’ vaccination status. By 2023, most adults in NC were fully vaccinated, emphasizing the efficiency in utilizing institutions such as hospital systems, federal agencies, and news outlets for vaccine information dissemination. However, rural populations reported lower vaccination rates despite experiencing worse outcomes from the pandemic. Similar to previous studies, results from this study identify federal health agencies as the most common source of trusted vaccine information, though less frequently selected by rural respondents. Rural counties tended to lean Republican in the 2020 Presidential election, indicating a potential political element in vaccine hesitancy, yet the extent of its effect is unknown. By identifying trusted sources of vaccine information in rural communities, future vaccine implementation efforts can be tailored to rural communities in an effort increase vaccine uptake.
The reference list from the paper itself. Each links out to its DOI / PubMed record.
- 1(Archive) COVID-19 Cases and Deaths Dashboard|NC COVID-19Available online: https://covid 19.ncdhhs.gov/dashboard/cases-and-deaths(accessed on 6 December 2023)
- 2Denslow S. Wingert J.R. Hanchate A.D. Rote A. Westreich D. Sexton L. Cheng K. Curtis J. Jones W.S. Lanou A.J. Rural-urban outcome differences associated with COVID-19 hospitalizations in North Carolina P Lo S ONE 202217 e 027175510.1371/journal.pone.027175535976813 PMC 9384999 · doi ↗ · pubmed ↗
- 3North Carolina Coronavirus Cases and Deaths|USA Facts Available online: https://usafacts.org/visualizations/coronavirus-covid-19-spread-map/state/north-carolina/(accessed on 3 January 2025)
- 4NCDHHS_COVID-19_Dashboard_Vaccinations. Tableau Software Available online: https://public.tableau.com/views/NCDHHS_COVID-19_Dashboard_Vaccinations/All?%3Aembed=y&%3Aapi ID=embhost 0&%3Ashow Viz Home=n&%3Aapi Internal Version=1.142.0&%3Aapi External Version=3.8.0&nav Type=0&nav Src=Opt&%3Adisable Url Actions Popups=n&%3Atabs=y&%3Atoolbar=bottom&%3Adevice=default&mobile=n&%3Ahide Edit Button=n&%3Ahide Edit In Desktop Button=n&%3Asuppress Default Edit Behavior=n&%3Ajsdebug=n(accessed on 5 December 2023)
- 5Citizen-Times North Carolina COVID-19 Vaccine Tracker. Citizen-Times Available online: https://data.citizen-times.com/covid-19-vaccine-tracker/north-carolina/37/(accessed on 9 August 2023)
- 6Enwezor C.H. Peacock J.E. Seals A.L. Edelstein S.L. Hinkelman A.N. Wierzba T.F. Munawar I. Maguire P.D. Lagarde W.H. Runyon M.S. Changing Attitudes toward the COVID-19 Vaccine Among North Carolina Participants in the COVID-19 Community Research Partnership Vaccines 2021991610.3390/vaccines 908091634452041 PMC 8402530 · doi ↗ · pubmed ↗
- 7DubéE. Gagnon D. Nickels E. Jeram S. Schuster M. Mapping vaccine hesitancy—Country-specific characteristics of a global phenomenon Vaccine 2014326649665410.1016/j.vaccine.2014.09.03925280436 PMC 5355208 · doi ↗ · pubmed ↗
- 8Datar R.S. Fette L.M. Hinkelman A.N. Hammershaimb E.A. Friedman-Klabanoff D.J. Mongraw-Chaffin M. Weintraub W.S. Ahmed N. Gibbs M.A. Runyon M.S. Factors associated with COVID-19 vaccination during June–October 2021: A multi-site prospective study Vaccine 2023413204321410.1016/j.vaccine.2023.03.05737069033 PMC 10063571 · doi ↗ · pubmed ↗