Statistical Modeling of Humoral Immune Response Dynamics to mRNA COVID-19 Vaccines in Nursing Home Residents and Healthcare Workers from Southern Italy
Filippo Domma, Luca Soraci, Ersilia Paparazzo, Ilaria Amerise, Mirella Aurora Aceto, Teresa Serra Cassano, Dina Bellizzi, Salvatore Claudio Cosimo, Francesco Morelli, Andrea Corsonello, Giuseppe Passarino, Alberto Montesanto

TL;DR
This study uses advanced statistical models to analyze how mRNA vaccines affect antibody levels in nursing home residents and healthcare workers in southern Italy.
Contribution
The study introduces beta-generalized linear mixed models to better analyze bounded and skewed antibody titer data.
Findings
Two distinct patterns of antibody titer evolution were identified in the study population.
Stroke was linked to higher antibody levels, while conditions like atrial fibrillation and COPD were associated with lower responses.
The β-GLMM approach provided more accurate insights into immune response determinants than traditional methods.
Abstract
Vaccination has been a cornerstone of the public health response to the COVID-19 pandemic, particularly in protecting older and frail populations. A detailed characterization of antibody titer dynamics and their determinants represents a crucial step toward optimizing vaccination strategies. However, antibody titers are bounded within assay-specific limited intervals and often display skewness and intra-subject correlation, which limit the suitability of conventional modeling approaches. We analyzed longitudinal antibody titer data from 608 residents and staff members of five nursing homes in Calabria (southern Italy) using beta-generalized linear mixed models (β-GLMMs). This framework enabled simultaneous modeling of the mean humoral response (μ), precision parameter (ϕ), and probability of achieving the maximum immune response (α), thereby providing a comprehensive assessment of…
Genes, proteins, chemicals, diseases, species, mutations and cell lines named across the full text — each resolved to its canonical identifier and authoritative record.
Click any figure to enlarge with its caption.
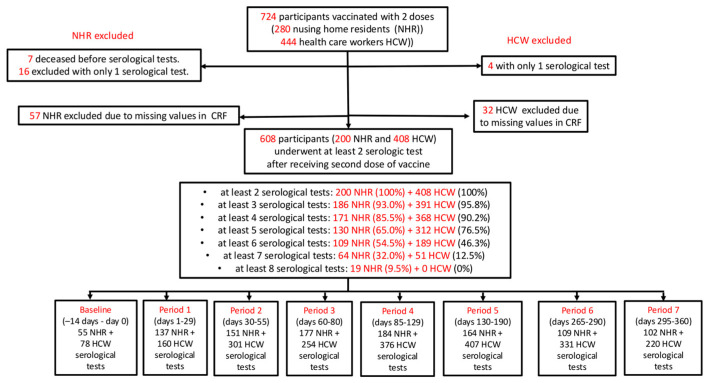 Figure 1
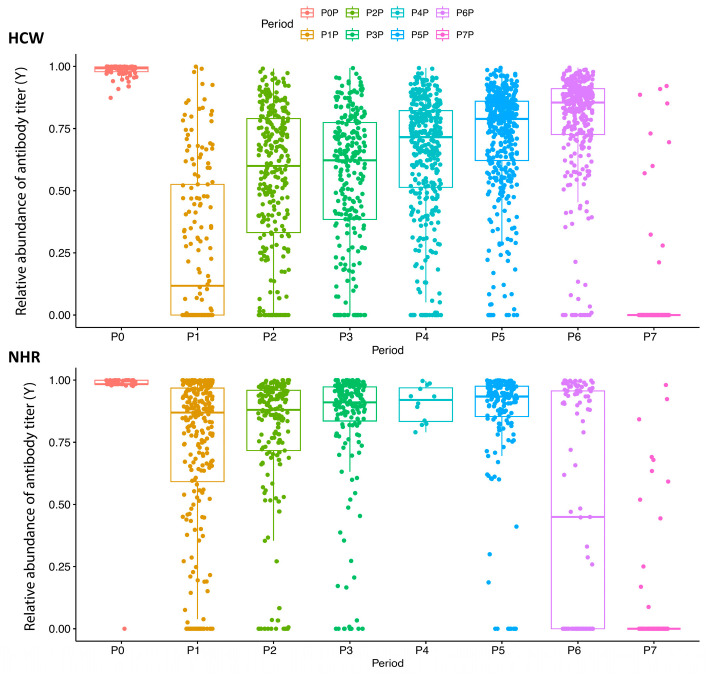 Figure 2
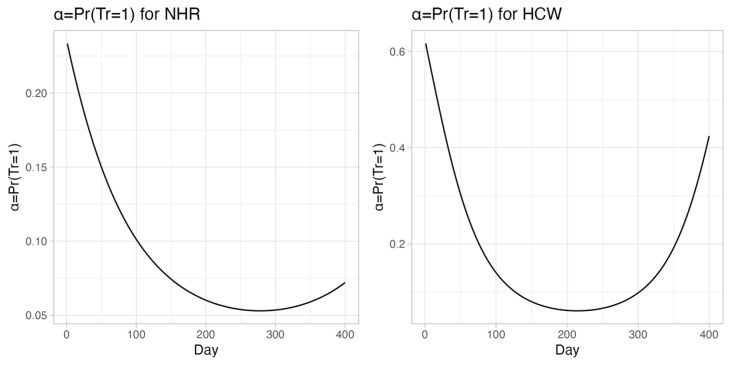 Figure 3
- —Gruppo Baffa (Sadel Spa, Sadel San Teodoro srl, Sadel CSsrl, Casa di Cura Madonna dello Scoglio, AGI srl, Casa di Cura Villa del Rosario srl, Savelli Hospital srl)
- —Casa di Cura Villa Ermelinda
- —TECNOLOGIE AVANZATE PER IL MIGLIORAMENTO DEI SERVIZI ALLA PERSONA
- —TECNOLOGIE AVANZATE PER L’INDAGINE DELLE RELAZIONI TRA UOMO ED AMBIENTI DI VITA
Peer Reviews
No public reviews on file for this paper yet. If you reviewed it on a platform where reviews are public (OpenReview, ICLR, NeurIPS, ICML), you can paste yours below so the community can read it here.
Videos
No videos yet. Explain this paper in a talk, walkthrough, or lecture? Add one.
Taxonomy
TopicsSARS-CoV-2 and COVID-19 Research · vaccines and immunoinformatics approaches · Immune responses and vaccinations
1. Introduction
The coronavirus disease 2019 (COVID-19) pandemic emerged at the end of 2019 and rapidly spread worldwide, initially affecting China and subsequently other countries, including South Korea and Italy, which experienced some of the earliest and most severe outbreaks outside Asia. By January 2020, China had reported more than 80,000 confirmed cases and over 3000 deaths, with early estimates of the basic reproduction number (R_0_) ranging between 2.2 and 3.6, indicating a high transmission potential [1]. Shortly thereafter, South Korea experienced one of the earliest large outbreaks outside China, exceeding 10,000 confirmed cases by March 2020, largely driven by superspreading events but with comparatively lower case fatality rates due to extensive testing and contact tracing strategies [2]. In early 2020, Italy became the epicenter of the outbreak in Europe, experiencing a rapid surge in cases, hospitalizations, and mortality that placed unprecedented pressure on the healthcare system. By March 2020, Italy had reported more than 100,000 confirmed cases and over 10,000 deaths, representing one of the highest mortality rates worldwide at that time [3].
The COVID-19 pandemic has posed an unprecedented global health challenge, leading to widespread morbidity, mortality, and socio-economic disruption [4,5,6]. Vaccination has emerged as the most effective public health intervention to control the spread of SARS-CoV-2, reduce severe disease, and prevent healthcare system overload, particularly in older and frail people [7].
In response to the global health emergency, unprecedented efforts were undertaken to develop effective vaccines against SARS-CoV-2. Vaccine development progressed at exceptional speed, particularly in the United States and China, leading to the rapid authorization of multiple vaccine platforms. Among these, the first widely deployed vaccine was the mRNA-based BNT162b2 (Pfizer–BioNTech), developed in the United States, which demonstrated high efficacy in preventing symptomatic infection [8,9]. Other vaccine platforms, including inactivated and live-attenuated or viral-vector-based vaccines, were also developed and implemented worldwide [10,11,12,13,14]. These vaccination strategies played a pivotal role in reducing severe disease, hospitalizations, and mortality, especially among older and clinically vulnerable populations. Extensive clinical and real-world evidence has demonstrated that timely and widespread vaccination not only decreased infection rates but also mitigated the impact of emerging variants [15,16,17]. In this context, mathematical modeling provided a robust framework to quantify and compare vaccination strategies, optimize resource allocation, and explore “what-if” scenarios, making it an indispensable component of the public health response to COVID-19 [15,16,17,18].
In numerous biomedical contexts, practitioners with limited data modeling expertise often remain unaware of the potential provided by appropriate statistical models for elucidating complex biological phenomena; consequently, they often employ methods, and in some cases models, that are unsuitable for interpreting the systems under investigation. Beta-generalized linear mixed models (β-GLMMs) constitute a class of statistical frameworks with considerable potential for applications in biomedical research. Β-GLMMs began to attract attention in biomedical research due to their ability to accommodate continuous outcomes constrained within the (0, 1) interval while accounting for both intra-subject correlation and outcome skewness. For instance, within this framework, Hunger et al. demonstrated that a β-GLMM provided superior likelihood-based fit and respected the boundedness of health-related quality-of-life scores collected longitudinally in older adults and stroke patients compared with traditional linear mixed models [19]. More recently, Di Brisco and Migliorati proposed an augmented β mixture mixed-effects model to handle constrained biomarkers and clinical scores with excess tail observations in long-term Parkinson’s disease cohorts, illustrating both improved robustness to outliers and enhanced interpretability of random effects [20].
Despite their undoubted advantages, the uptake of β-GLMMs in biomedicine remains limited, underscoring the need for increased methodological dissemination and software support. This gap is particularly relevant for immunological research, as antibody titer measurements represent a paradigmatic example of bounded longitudinal data. Antibody levels are indeed constrained by assay-specific limits, often show pronounced right skewness, and may accumulate at the upper detection limit following vaccination or booster doses; furthermore, repeated measurements within individuals induce correlation over time. These characteristics motivate the use of modeling approaches that explicitly respect bounded support and accommodate complex longitudinal dependence structures. To fill this gap, we aimed at demonstrating how β-GLMMs can be used to jointly characterize the mean antibody trajectory, its variability, and the probability of reaching the assay’s upper detection limit, leveraging SARS-CoV-2 antibody data from nursing home residents and healthcare workers from ten nursing homes (NH) in Calabria (southern Italy); moreover, we set ourselves the goal of identifying the socio-demographic and clinical factors associated with temporal evolution of antibody titers.
2. Materials and Methods
2.1. Study Design
A prospective longitudinal cohort study was conducted in five NHs in Calabria, Italy. NHRs and HCWs, in the context of their vaccination schedule, provided peripheral blood samples for serologic testing after second vaccine dose and then, regularly, every 28 days (within a window of ±14 days) for the first six months and every three months for the second six months (eight time points). All participants received two doses of BNT162b2 and a third booster (mRNA-1273 or BNT162b2) 6–9 months post-first dose.
The study began in February 2021, with written informed consent obtained from all study participants. This study was conducted in accordance with the Declaration of Helsinki. Eligibility criteria included age ≥18 years and at least one serologic test post-second dose.
Antibody levels were measured at baseline (two weeks pre-second dose, P0) and at eight time points every 4 weeks thereafter: P0 (−14–0 days), P1 (1–29 days), P2 (30–55 days), P3 (60–80 days), P4 (85–129 days), P5 (130–190 days), P6 (265–290 days), and P7 (295–360 days) (Figure 1).
Of 724 vaccinated individuals (280 NHRs and 444 HCWs), 116 were excluded due to incomplete data (4 HCWs and 16 NHRs because they had only one serologic assay result, 7 NHRs because they were deceased post-second dose and before undergoing serological tests; 32 HCWs and 57 NHRs because of missing values in clinical data); we then obtained a final sample of 608 participants (200 NHRs and 408 HCWs) for analysis.
Demographic and clinical data were collected at study enrolment and included age, gender, body mass index (BMI), and history of chronic diseases (with the latter detailed in Appendix A.1). The study design was approved by the Ethics Committee of the University of Calabria (protocol 006223, 15 March 2021).
2.2. SARS-CoV-2 IgG Immunoassays
Blood samples were properly prepared and stored following a standardized procedure. Blood samples were collected in Serum Separator Tubes (BD Diagnostic Systems, Franklin Lakes, NJ, USA).
Within 1 h from the collection, serum samples were immediately tested for the presence of SARS-CoV-2 antibodies using Elecsys Anti-SARS-CoV-2, an electrochemiluminescence immunoassay (sensitivity: 96.6%; specificity: 100%; sensitivity refers to sample >14 days after disease diagnosis), on a COBAS 601 platform (Roche, Basel, Switzerland), targeted on total Immunoglobulins (IgT) against S-protein RBD. The Roche Anti-SARS-CoV-2-S test has a signal range that spans from 0.4 to 250 U/mL that is further extended to 2500 U/mL thanks to a 1:10 dilution automatically performed by the instrument.
2.3. Statistical Analysis
Based on what was described in previous sections, after second vaccination, individuals were subjected, at fixed intervals, to serological tests. Let i = 1, …, N index individuals within each group (N = 200 for NHRs and 408 for HCWs), and let j = 0, …, 7 index the eight study periods (P0–P7). Formally, we denote by the titer measurement for the i-th individual in the j-th interval. can take continuous values in the limited range [0.4, 2500]; because antibody titers are bounded by the assay’s upper detection limit of 2500 U/mL, denoting with , we defined a relative measure of antibody titer using the following transformation:
where can be interpreted as relative measure of absence of antibody titer (or the fraction of antibodies needed to reach the maximum response) and ranges between 0 (in case of , i.e., when in the j-th interval, for the i-th individual, a titer equal to the maximum measurable level is observed) and 0.99984 (i.e., when a titer equal to the minimum measurable titer is observed). So, for example, if = 0.2, we can say that 20% of antibodies are missing to reach the maximum measurable value (or the fraction of antibodies needed to reach the maximum response is 20%).
Preliminary inspection of the data revealed several features relevant for model choice. Antibody titers were bounded by the assay limits and showed pronounced right-skewness, with a substantial proportion of observations reaching the upper detection limit after vaccination or booster doses. Moreover, repeated measurements within individuals were correlated over time. These characteristics motivated the use of a modeling framework specifically designed for bounded longitudinal outcomes with within-subject dependence. Beta-GLMMs are the best fit as they to simultaneously estimate a non-linear model for the mean of for the probability that the i-th individual in the j-th interval has an antibody titer value equal to the maximum measurable value, i.e., and for a dispersion indicator; furthermore, it allows for taking into account the longitudinal/clustered nature of the observed data. The methodology used is described in Appendix A.2.
2.4. Model Building Strategies
β-GLMMs were fitted using the glmmTMB package in R. The model jointly specifies three components: (i) a mean submodel describing the expected antibody trajectory over time, (ii) a precision submodel capturing changes in variability, and (iii) a submodel for the probability of observing values at the assay’s upper detection limit. Random intercepts were included at the individual level to account for within-subject correlation. Covariates were selected a priori based on clinical relevance. We started the analyses by estimating a “minimal” model for both NHR and HCW titers. This “minimal” model included the following covariates: gender (1 for males, 0 for females), age, day (days after the second dose vaccine), BMI (coded with three dummies variables to indicate the following classes: underweight with BMI ≤ 18.5 kg/m^2^, normal weight with 18.5 < BMI < 25 kg/m^2^, and lastly overweight with BMI ≥ 25 kg/m^2^), third dose (TD) (1 for subjects who received a third dose (booster) vaccine, 0 otherwise), and SARS-CoV-2 infection (C19) (1 for subjects who contracted SARS-CoV-2 infection before or during the study, 0 otherwise). In addition to this “minimal” model, more complex (extended) models were estimated, also including coexisting chronic diseases, which may impact the levels and kinetics of antibody titers. All variables reported in Table 1 with a prevalence greater than 5% were considered as candidate predictors. Variable selection and model selection were conducted using the Akaike Information Criterion (AIC) to evaluate and compare the performance of competing fitted models [9].
Statistical analyses were performed using R (version 4.3.1; R Foundation for Statistical Computing) using the following packages: betareg (3.2-1), glmmTMB (1.1.10), ggplot2 (3.5,1), and ggpubr (0.6.0).
3. Results
3.1. Study Population
Table 1 presents the demographic and health characteristics of the study participants.
Mean age was 81.3 for NHRs and 44.9 years for HCWs, respectively. Women were predominant in both groups (77.8% in NHRs, 53.2% in HCWs). As expected, NHRs had a higher burden of chronic diseases, particularly cardiorespiratory, neurodegenerative, and gastrointestinal diseases. The number of subjects with neutralizing antibody assays over time is shown in Figure 1. Overall, 1079 and 2127 serological tests were performed in NHRs and HCWs, respectively. Most participants had at least three serological assays, but only 9.5% of NHRs and no HCWs completed all eight assays.
3.2. Antibody Response over Time
Table 2 summarizes the fraction of antibodies needed to reach the maximum response, Y, across eight survey periods for both groups.
Several differences emerged between the two groups; in fact, in P0, both groups presented very high mean values of the fraction of antibodies necessary to reach the maximum response (0.9729 and 0.9831 for NHRs and HCWs, respectively); after having received the second dose in P1, the mean reduction in antibody levels was steeper for HCWs than NHRs (72% vs. 28%, respectively). After the third dose (in P7 for HCWs and in P6 and P7 for NHRs), a very strong reduction in mean levels was observed for both groups. The mean levels in NHRs were consistently higher than those of HCWs, suggesting a weaker immune response.
Figure 2 illustrates boxplot diagrams of antibody levels over 12 months post-second dose. Because antibody titers were transformed, values close to zero indicate titers near the upper detection limit, whereas higher values indicate lower antibody levels. At P1, Y reached its lowest point for both groups: 0.118 in HCWs 0.87 in NHRs.
In HCWs, the median of Y follows a logarithmic increase until P7, where the third dose caused a sharp decline to 0. In NHRs, decline was slower and more linear, with a more gradual drop at P6 and P7. The peculiar evolution pattern of humoral immunity observed in NHRs in the last observational periods is, at least partially, related to the older age of NHRs which granted them the highest priority to receive a SARS-CoV-2 vaccine. Consequently, the response to the third booster dose of vaccine was detected first in NHRs and then in HCWs.
3.3. Beta-Generalized Linear Mixed Models
To clarify how cohort, demographic, immunological, and clinical data affected antibody response to vaccination, several β-GLMMs were fitted. As reported in Appendix A.2, these were fitted to simultaneously specify a regression model for the mean, μ, a regression model for the precision parameter, ϕ, and a regression model for α, i.e., the probability to reach the maximum response in terms of measurable antibody titer (corresponding to the maximum value of antibody titer).
3.4. “Minimal” Models for NHR and HCW Data
Table S1, reported in the Supplementary Files, presents parameter estimates for the minimal β-GLMMs with random intercepts on the mean and probability of maximum response. Table S2 displays predicted means and probabilities across the eight time periods. After the second dose in P1, the probability of reaching the maximum antibody response was 0.1439 in NHRs and 0.7469 in HCWs. After the third dose (P7 for HCWs, P6-P7 for NHRs), both groups showed increased probability, though such probability remained lower for NHRs.
Table S3 reports estimates from extended minimal models, including C19 and TD status. Tables S4 and S5 show estimated means and probability of maximum response under different combinations of C19 and TD status in NHRs and HCWs. Across groups, TD increased mean antibody levels and probability of peak response, especially in those with prior C19. These effects were stronger in HCWs than NHRs.
3.5. Effect of Covariates on Response
Table S5 shows minimal model estimates for the mean of . In both groups, age, TD, and C19 significantly influenced antibody response. As exponentiated coefficients can be interpreted in terms of odds ratios, among NHRs with C19, the ratio between the expected fraction of antibodies needed to reach the maximum response, μ, and the expected fraction of antibodies observed (1 − μ) is about exp(−0.8015) = 0.4486 times higher than in subjects who did not experience infection. In other words, the fraction of antibodies needed to reach the maximum response is 2.23 times lower in NHRs with C19 than in NHRs who did not experience infection. Similarly, TD reduced Y by 8.05-fold. In HCWs, C19 and TD reduced Y by 7.09-fold and 1.95-fold, respectively. Regarding the effect of age, each 10-year age increase raised Y by 1.27 times in NHRs and 1.23 in HCWs. In NHRs, underweight and overweight BMI also correlated with higher Y (lower response), though BMI had no significant effect in HCWs.
Table S6 also presents estimates for the probability of reaching the maximum antibody response. C19 increased this probability by 11.3-fold in NHRs and 64-fold in HCWs; TD raised it by 397-fold in NHRs and 350-fold in HCWs. Age and underweight BMI negatively affected the probability in both groups. Finally, a quadratic relationship between the day variable and the probability of reaching maximum response was observed (Appendix A.3). All these fold-change estimates should be interpreted in the context of the underlying baseline risk, as large relative increases (as in the case of C19 and TD) may arise from low baseline probabilities.
3.6. Temporal Effects and U-Shaped Patterns
Figure 3 shows the predicted probability of achieving the peak response over time.
A U-shaped curve was observed in both groups: an initial post-vaccination increase, a decline over time, and recovery post-booster. The minimum value was estimated at day 278 for NHRs and 214 for HCWs. These minima align with the TD administration.
3.7. Extended Models for NHRs
Table 3 reports estimates from the extended β-GLMM for NHRs, incorporating comorbidities.
Conditions associated with lower antibody response (higher Y) included non-Alzheimer’s dementia, atrial fibrillation, COPD, and underweight BMI, along with age and day. In contrast, prior C19, TD, hypertension, and stroke were associated with stronger responses.
In terms of maximum response probability, positive predictors included female sex, non-Alzheimer’s dementia, prior C19, and TD. Age, PAD, HF, and underweight BMI were negative predictors.
Several covariates also influenced the precision of Y. Age, female sex, underweight BMI, day, HF, and non-Alzheimer’s dementia were linked to higher precision (lower variability); conversely, C19, TD, and stroke were associated with increased variability in the humoral response.
4. Discussion
4.1. Antibody Kinetics Following Vaccination in NHRs and HCWs
Antibody titers are a key marker to evaluate vaccine-induced immunity protection. In the context of the anti-SARS-CoV-2 vaccination campaign, our findings highlight the relationship between vaccination timing and antibody response kinetics in subjects of different ages; antibody titers peaked four weeks post-vaccination in both NHRs and HCWs and then declined until they received the third booster dose; while HCWs showed a rapid exponential antibody decrease, NHRs experienced a slower and linear decline. These results confirm what was reported by previous studies [21,22,23,24] and highlight the necessity of booster doses, particularly for frail subjects. NHRs also exhibited weaker and more variable responses, likely influenced by aging-related immunosenescence [25,26,27,28].
4.2. Impact of Prior Infection and Booster Doses on Immune Response
Our results demonstrate a strong correlation between SARS-CoV-2 infection, vaccination, and antibody levels. Natural infection can induce production of proinflammatory cytokines [23] and amplify vaccine response through “hybrid immunity” [26,29]. Consistent with previous studies [29,30,31], NHRs with past SARS-CoV-2 infection had enhanced immune responses, though to a lesser extent than HCWs. In contrast to previous studies [21,31,32], our investigation uniquely assessed not only median IgG levels but also the probability of reaching a peak response and antibody variability. Interestingly, both booster doses and prior infection significantly increased the probability to reach the peak antibody response, but the effect was stronger in HCWs (64 times) compared to NHRs (11 times, compared to noninfected individuals) (Table S6). Post-second dose antibody decline was counteracted by booster dose, eliminating the immune response gap between NHRs and HCWs.
4.3. Role of Comorbidities and Clinical Characteristics
Several clinical factors influenced immune response in NHRs; indeed, age, BMI ≤ 18.5 kg/m^2^, AF, non-Alzheimer’s dementia, and COPD correlated with lower antibody levels, whereas C19, TD, hypertension, and stroke correlated with higher responses. Age, PAD, and HF were associated with a lower probability of reaching peak response, while C19, TD, female sex, and non-Alzheimer’s dementia increased it.
The role of BMI and comorbidities in vaccine responses was underexplored among NHRs; Meyers E. et al. showed that cardiometabolic diseases, nephrological comorbidities, and cancer may weaken immune response [33]; hyperpolypharmacy was also linked to weaker responses [34]. Our findings contribute to a better understanding of the complex interactions between chronic diseases and immune response; interestingly, among chronic diseases, only hypertension and stroke were associated with stronger immune responses, in contrast with previous studies reporting a negative relationship [35,36,37]. Indeed, Watanabe et al. found that hypertension was associated with lower antibody titers following COVID-19 vaccination, likely due to chronic inflammation and endothelial damage [35]; similarly, Soegiarto et al. reported that hypertensive individuals had a higher risk of breakthrough infections after vaccination, suggesting impaired vaccine efficacy [36]; a recent study revealed that hypertensive older patients with higher frailty levels experienced a more pronounced antibody reduction compared to patients with lower frailty [37]. The discrepancies between our study and previous ones may stem from differences in study populations, with frail and older adults often underrepresented in previous studies, as well as from the complex interplay between duration of hypertension and immune function.
Hypertension is characterized by chronic inflammation, endothelial dysfunction, and immune activation, which could influence vaccine-induced immunity. While chronic inflammation and endothelial dysfunction are thought to potentially impair immune responses and vaccine efficacy, long-lasting hypertension may induce sustained activation of both the adaptive and innate immune systems [38]; this immune activation, driven by pro-inflammatory pathways, may boost vaccine response. Additionally, renin–angiotensin system (RAS) dysregulation might contribute to enhanced post-vaccination response; the binding of circulating spike proteins from the vaccine to angiotensin-converting enzyme 2 (ACE2) can affect the balance between angiotensin II and its inactive form, angiotensin 1–7, which normally has a protective, hypotensive effect [39,40]. This inflammatory response may be particularly pronounced in individuals with pre-existing hypertension, as their immune systems may react more vigorously to the vaccine, potentially leading to elevated blood pressure and hyperinflammatory reactions. Further research is needed to clarify the mechanisms underlying this association and to determine whether specific antihypertensive medications modulate vaccine responses. Along with hypertension, stroke was also associated with enhanced immune response in NHRs, potentially due to increased activation of innate and acquired immunity following cerebrovascular events; stroke disrupts local and systemic immunity [41], causing long-term dysregulation, which may lead to enhanced and cross-reactive immune response following vaccination; additionally, stroke-induced immunological perturbations could increase latent SARS-CoV-2 infections [42], further amplifying IgG titers; however, this finding warrants further investigation to determine the underlying mechanisms involved.
4.4. Nutritional Status and Frailty-Related Immune Modulation
Undernutrition, common among NHRs, has been associated with decreased vaccine efficacy [43,44] due to deficiencies in essential vitamins and minerals necessary for robust immune function [44,45], thus reducing the ability to mount an effective response to vaccination. Our findings underscore the importance of nutritional status as part of comprehensive vaccination strategies for frail subjects.
Cardiovascular disease’s negative impact on vaccine response has been reported in previous studies; indeed, a higher prevalence of cardiovascular comorbidities was found among seronegative compared with seropositive individuals after vaccination [46]; furthermore, cardiovascular medications may modulate immune response and potentially reduce IgG titers in vaccinated individuals [47]; a previous study found that men with cardiovascular diseases had a weaker humoral response post-vaccination against SARS-CoV-2, aligning with our results [46].
Non-Alzheimer’s dementia was also associated with a decreased immune response, consistently with evidence that neurodegenerative diseases increase the prevalence and severity of COVID-19 as well as the risk of breakthrough infections [48,49,50,51]; immune dysregulation linked to neurodegeneration may underlie reduced vaccine efficacy [52,53]. However, Alzheimer’s dementia was not linked to antibody titers in our cohort, suggesting variations in immune function between dementia types. In this regard, Alzheimer’s disease is characterized by neuroinflammatory pathways that may not directly impair vaccine-induced immunity, whereas other forms of dementia may have more pronounced effects on immune function. Indeed, B and T cells tend to decrease in all forms of dementia, and monocytes and NK cells are decreased only in vascular dementias but not in Alzheimer’s disease [52]. These cells were shown to be particularly relevant for mounting effective response following SARS-CoV-2 vaccination [50,53,54].
The findings from our study have important implications for vaccination strategies in frail populations, particularly NHRs. Given the associations between comorbidity, nutritional status, and vaccine response, personalized vaccination strategies should be considered. Undernourished NHRs may benefit from targeted nutritional support, while those with cardiovascular diseases or dementia may require tailored vaccination schedules. Enhanced immune responses in hypertensive or stroke-affected NHRs suggest that these individuals may gain greater protection from booster doses. Future studies should explore the biological mechanisms underpinning these associations, incorporating both humoral and cellular immune assessments.
4.5. Methodological Considerations
A major strength of this study is the use of a robust statistical model (beta-generalized linear mixed model) to evaluate multiple parameters influencing immune response and allowing for the simultaneous specification of a regression model for the mean, μ, of the humoral response, a second one for the precision parameter, ϕ, and a third one for the probability to obtain the maximum immune response, α. This approach allowed us to identify with greater accuracy the key demographic and clinical characteristics affecting antibody response.
Our real-world data provide valuable insights for shaping ongoing and future vaccination campaigns. The distinct immune response trajectories observed between NHRs and HCWs reinforce the need for timely booster vaccinations, particularly for frail older populations who exhibit suboptimal immune response.
While our findings offer critical insights, some limitations should be acknowledged. Firstly, the relatively small sample size may limit generalizability. Additionally, our study focused solely on humoral immunity, omitting cellular and cytokine responses. On the other hand, our use of a single vaccine type (BNT162b2) and centralized laboratory testing enhance the reproducibility and reliability of study results. Moreover, humoral response remains a crucial component for clearance of cytopathic viruses and reinfection prevention, and its standard measurement facilitates comparison across studies.
5. Conclusions
This study provides a comprehensive analysis of antibody responses to BNT162b2 vaccination in older NHRs and younger HCWs in southern Italy. Our findings highlight distinct immune trajectories between these populations, with frail older NHRs showing delayed and attenuated responses that are partially restored by booster doses. Importantly, prior SARS-CoV-2 infection and booster vaccination substantially increased the probability of achieving peak antibody responses, underscoring the relevance of hybrid immunity and repeated antigen exposure. Clinical factors such as comorbidities, nutritional status, and age significantly influenced vaccine responsiveness, emphasizing the need for personalized vaccination strategies in frail and institutionalized populations. The observed associations between certain comorbidities and enhanced immune responses further suggest complex immunological mechanisms that warrant future investigation.
The reference list from the paper itself. Each links out to its DOI / PubMed record.
- 1Li Y. Wang L.W. Peng Z.H. Shen H.B. Basic reproduction number and predicted trends of coronavirus disease 2019 epidemic in the mainland of China Infect. Dis. Poverty 202099410.1186/s 40249-020-00704-432678056 PMC 7363992 · doi ↗ · pubmed ↗
- 2You J. Lessons from South Korea’s COVID-19 policy response Am. Rev. Public Adm.20205080180810.1177/0275074020943708 · doi ↗
- 3La Maestra S. Abbondandolo A. De Flora S. Epidemiological trends of COVID-19 epidemic in Italy over March 2020: From 1000 to 100,000 cases J. Med. Virol.2020921956196110.1002/jmv.2590832314804 PMC 7264625 · doi ↗ · pubmed ↗
- 4Choi K. Jang M. Kim S. Park S.J. Suh H.S. Impact of COVID-19 on disease-specific mortality, healthcare resource utilization, and disease burden across a population over one billion in 31 countries: An interrupted time-series analysis E Clinical Medicine 20258510331510.1016/j.eclinm.2025.10331540686673 PMC 12273489 · doi ↗ · pubmed ↗
- 5Ioannidis J.P.A. Pezzullo A.M. Cristiano A. Boccia S. Global estimates of lives and life-years saved by COVID-19 vaccination during 2020–2024 JAMA Health Forum 20256 e 25222310.1001/jamahealthforum.2025.222340711778 · doi ↗ · pubmed ↗
- 6Loo S.L. Jung S.M. Contamin L. Howerton E. Bents S.J. Hochheiser H. Runge M.C. Smith C.P. Carcelén E.C. Yan K. Scenario projections of COVID-19 burden in the US, 2024–2025 JAMA Netw. Open 20258 e 253246910.1001/jamanetworkopen.2025.3246940965885 PMC 12447233 · doi ↗ · pubmed ↗
- 7Harris E. COVID-19 vaccination linked with lower risk of cardiac problems JAMA 2024331143910.1001/jama.2024.515238607645 · doi ↗ · pubmed ↗
- 8Mulligan M.J. Lyke K.E. Kitchin N. Absalon J. Gurtman A. Lockhart S. Neuzil K. Raabe V. Bailey R. Swanson K.A. Phase I/II study of COVID-19 RNA vaccine BNT 162b 1 in adults Nature 202058658959310.1038/s 41586-020-2639-432785213 · doi ↗ · pubmed ↗