Tumor cell FAP orchestrates EMT and immune suppression in aggressive localized ccRCC
Teijo Pellinen, Lassi Luomala, Kalle E Mattila, Annabrita Hemmes, Katja Välimäki, Mariliina Arjama, Oscar Brück, Lassi Paavolainen, Elisa Kankkunen, Harry Nisén, Petrus Järvinen, Leticia Castillon, Sakari Vanharanta, Paula Vainio, Olli Kallioniemi, Panu M. Jaakkola, Tuomas Mirtti

TL;DR
Tumor cells in a type of kidney cancer express a protein called FAP, which is linked to aggressive behavior and immune suppression, offering new insights for treatment.
Contribution
The study identifies tumor-cell FAP as a novel biomarker for aggressive localized ccRCC, linking EMT and immune suppression.
Findings
Tumor-cell FAP expression is associated with an EMT-like state and immune suppression at the invasive border.
Tumor-cell FAP independently predicts poor recurrence-free survival in early-stage ccRCC.
Tumor-cell FAP outperforms PD-L1 as a biomarker for aggressive disease features.
Abstract
Background: In contrast to most solid tumors, high immune cell infiltration in clear cell renal cell carcinoma (ccRCC) is associated with poor patient prognosis. The biological mechanisms underlying this paradox remain unclear, particularly regarding tumor cell-microenvironment interactions promoting local invasion and recurrence. This study aimed to identify spatially resolved tumor, immune, and stromal features that define aggressive phenotypes in localized ccRCC. Methods: Multiplex immunofluorescence was performed using a 33-marker panel on 1,728 multi-region tissue cores from 435 surgically treated patients with localized ccRCC. Samples systematically included tumor centers, invasive borders, and adjacent benign tissue. Single-cell analyses quantified immune, stromal, endothelial, and epithelial cell populations within their spatial context. Results: Spatially resolved profiling…
Genes, proteins, chemicals, diseases, species, mutations and cell lines named across the full text — each resolved to its canonical identifier and authoritative record.
Click any figure to enlarge with its caption.
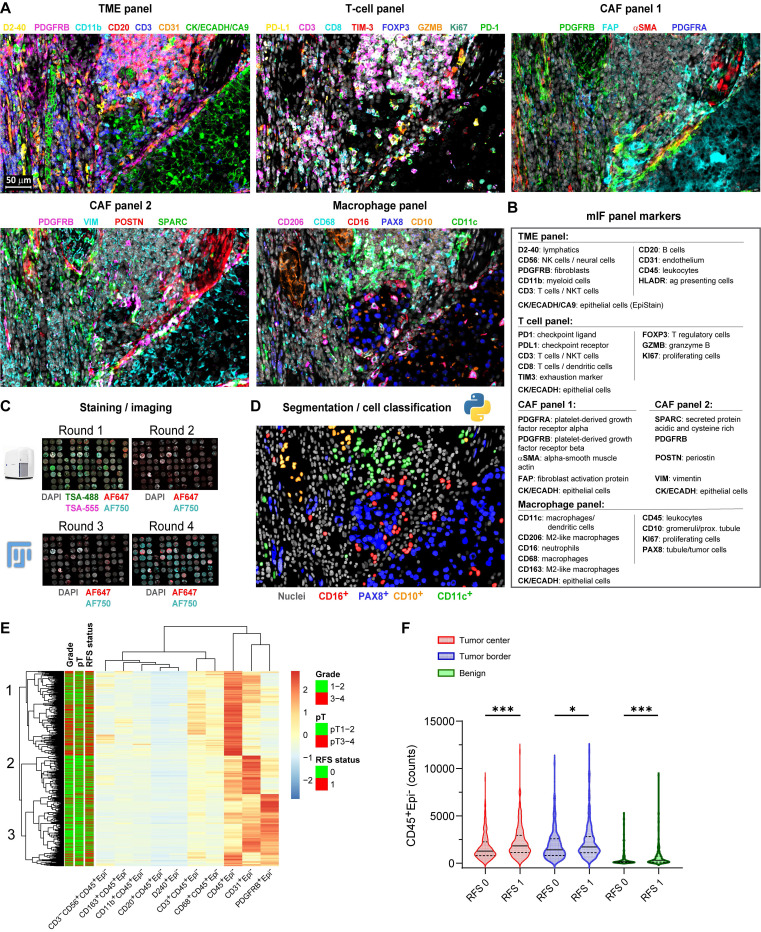 Figure 1
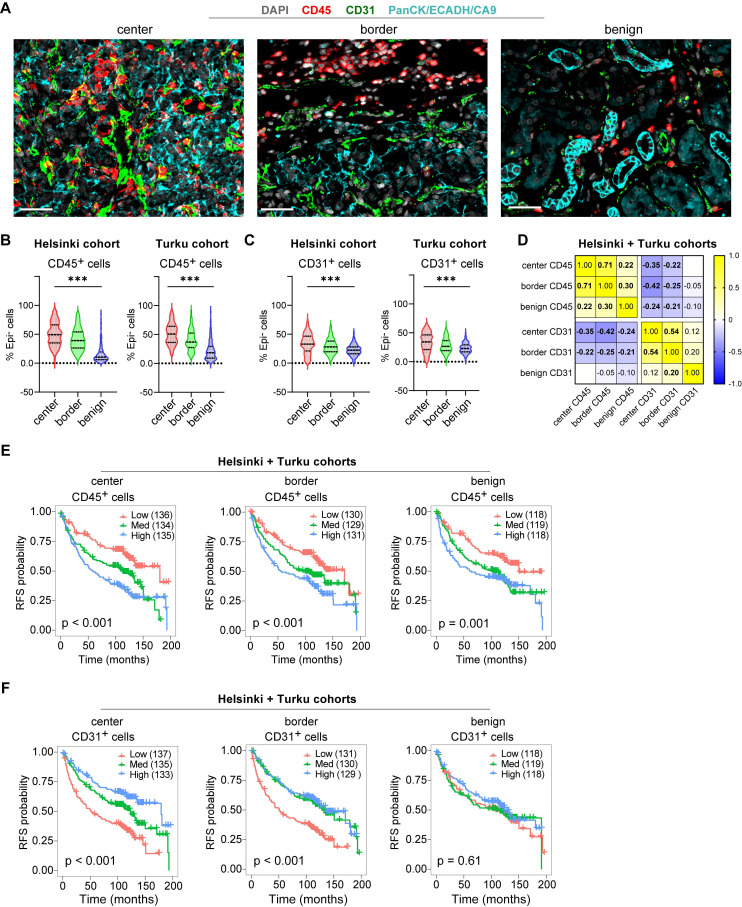 Figure 2
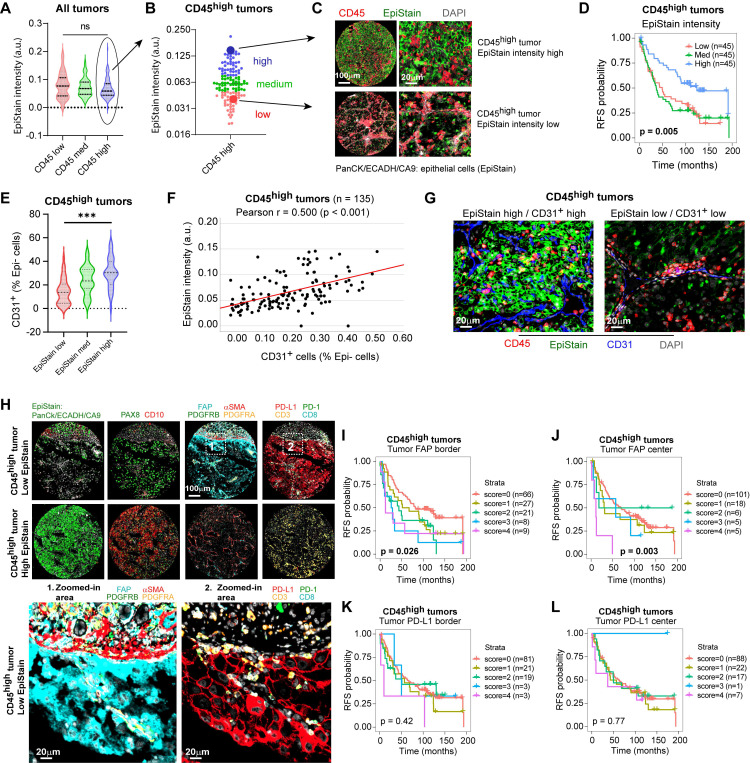 Figure 3
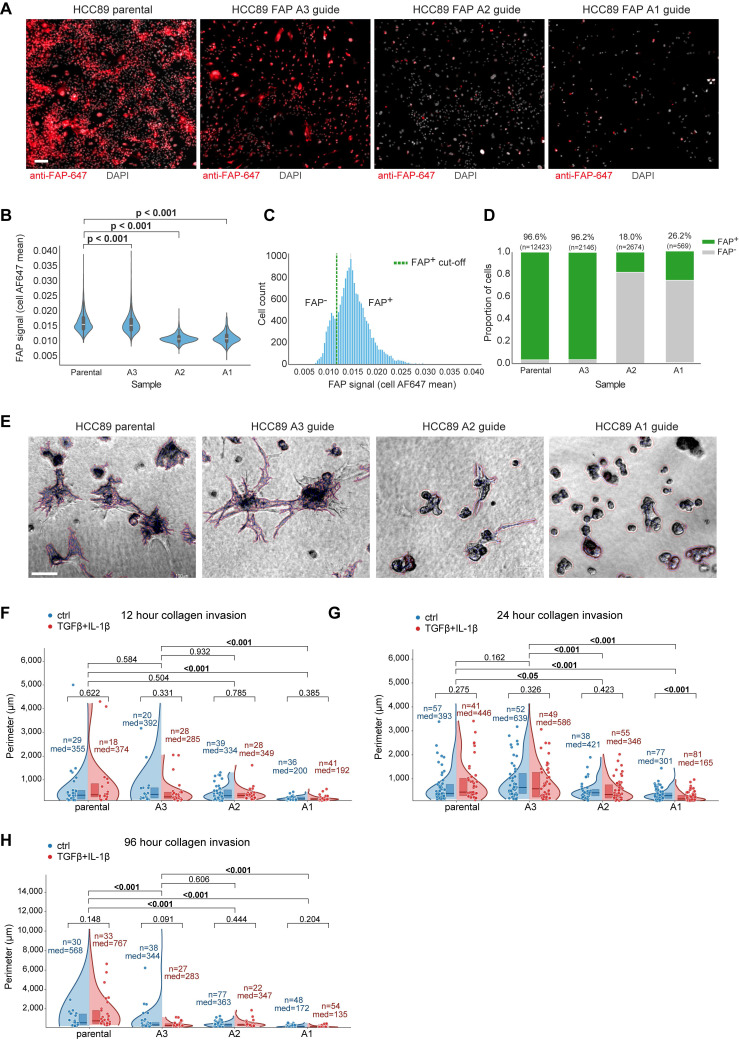 Figure 4
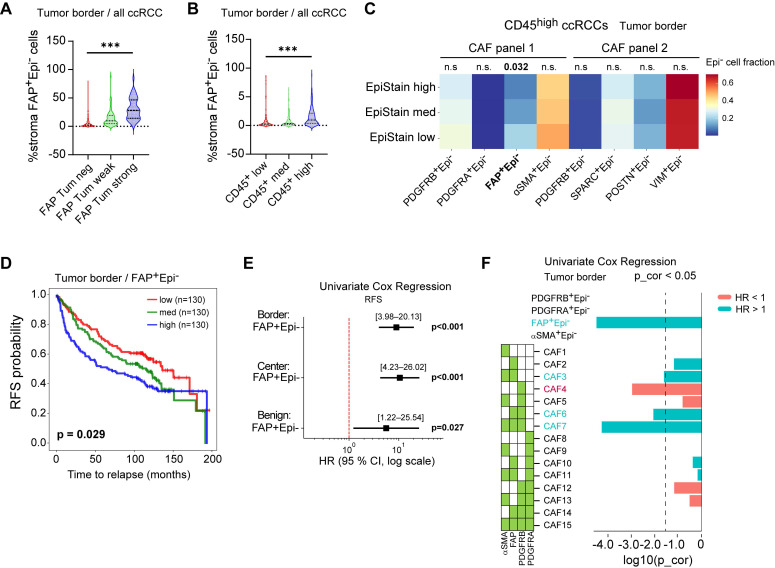 Figure 5
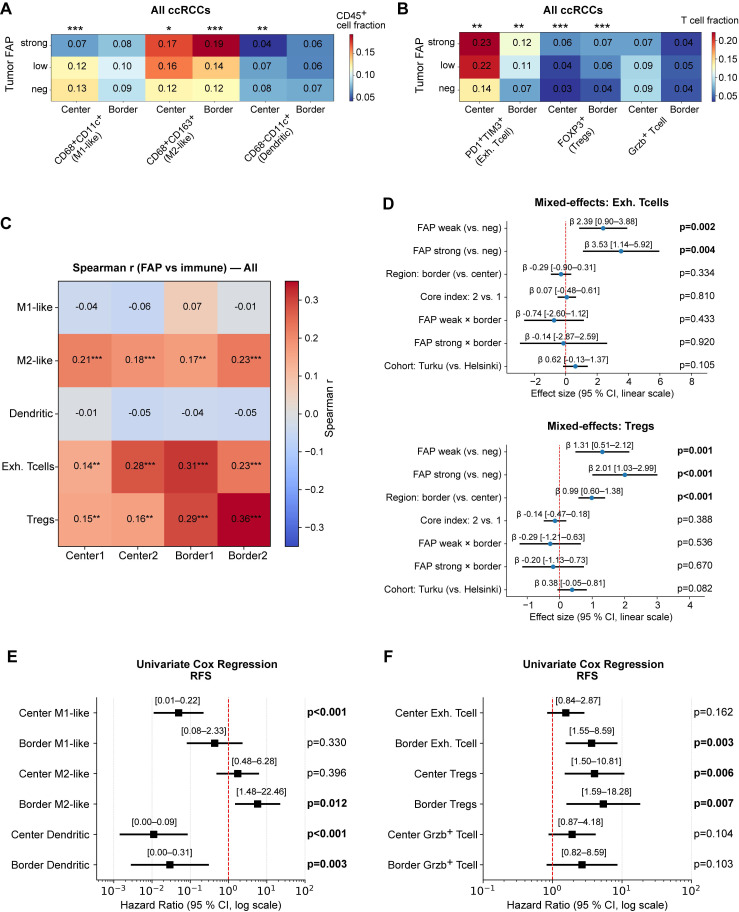 Figure 6
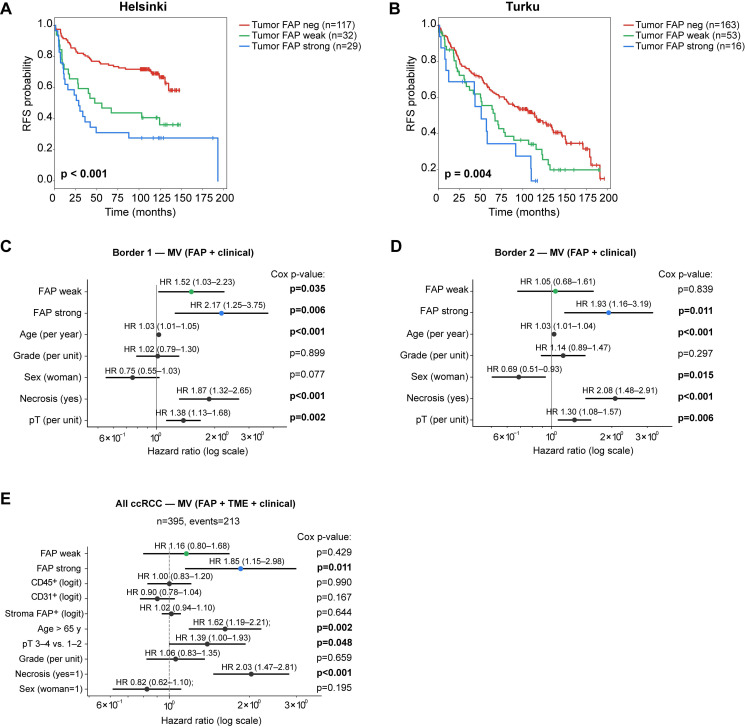 Figure 7
 Figure 8
Peer Reviews
No public reviews on file for this paper yet. If you reviewed it on a platform where reviews are public (OpenReview, ICLR, NeurIPS, ICML), you can paste yours below so the community can read it here.
Videos
No videos yet. Explain this paper in a talk, walkthrough, or lecture? Add one.
Taxonomy
TopicsPeptidase Inhibition and Analysis · Bladder and Urothelial Cancer Treatments · Cancer Immunotherapy and Biomarkers
Introduction
Localized clear cell renal cell carcinoma (ccRCC) carries significant recurrence risk despite surgery 1-3. Current therapies are limited by challenges in accurately selecting patients for intensified treatment or surveillance 4-6, highlighting an urgent need for robust prognostic biomarkers applicable across disease stages 7.
ccRCC tumors are highly vascularized and characterized by extensive immune infiltration 8. Paradoxically, while high angiogenesis signatures typically correlate with better survival, elevated immune infiltration often associates with poorer outcomes and therapy resistance, particularly in metastatic disease 8-14. Understanding this paradoxical association requires methods that can resolve complex spatial interactions between tumor cells and their microenvironment. Unlike conventional bulk analyses, spatially resolved techniques enable precise characterization of cell populations and their interactions at critical tumor regions, such as the invasive border, which may hold key insights into the mechanisms driving aggressive behavior and recurrence in localized ccRCC 15-17.
Recent studies suggest spatial interactions at tumor invasive margins involving cells undergoing epithelial-to-mesenchymal transition (EMT), immune cell subsets, and activated or myofibroblastic cancer-associated fibroblasts (CAFs) 17-19. These reports imply the existence of functionally specialized niches promoting local invasion and immune suppression. However, the detailed protein-level spatial organization and the precise cellular interplay responsible for driving disease recurrence remain poorly defined in localized ccRCC.
To specifically dissect the spatial tumor microenvironment (TME) characteristics linked with aggressive behavior in highly immune-infiltrated localized ccRCC, we employed multiplex immunofluorescence (mIF) on 1,728 multi-region tissue cores (tumor center, invasive border, adjacent benign) from 435 surgically treated patients. This spatially resolved analysis identified fibroblast activation protein (FAP) expression specifically on tumor epithelial cells as a defining feature of aggressive ccRCC. Although FAP has conventionally been viewed as a stromal marker, its unexpected expression by tumor cells was notably associated with hallmarks of EMT and a profoundly immunosuppressive niche. Importantly, tumor-specific FAP emerged as a robust independent predictor of disease recurrence in localized ccRCC.
Materials and Methods
Ethical approvals and data handling
This study adhered to the Declaration of Helsinki and was approved by the Institutional Review Boards of Helsinki University Hospital (Ethical Committee Helsinki University Hospital, diary number HUS/1040/2018) and Turku University Hospital (License number T06/032/15). Informed consent was waived per Finnish legislation allowing secondary use of anonymized health data.
Patient cohorts and tissue microarrays
We utilized formalin-fixed, paraffin-embedded (FFPE) surgical specimens from 435 treatment-naïve patients with localized (N0M0) clear cell renal cell carcinoma (ccRCC) who underwent nephrectomy at Helsinki (n = 196) and Turku (n = 239) University Hospitals between 2003 and 2013. Exclusion criteria included distant (M1) or regional lymph node (N1) metastases, prior kidney cancer, or multiple synchronous kidney tumors. Specimens and corresponding tissue microarrays (TMAs) were previously collected and constructed 20. TMAs included replicate cores (1.0 mm Helsinki, 1.5 mm Turku) from tumor center (n = 2), invasive border (n = 2), and adjacent benign kidney tissue (n = 1). The detailed clinicopathological variables collected from medical records are summarized in Table S1.
Multiplexed immunofluorescence (mIF)
We performed cyclic mIF using an established in-house protocol involving sequential rounds of antibody staining, imaging, and signal removal. Full antibody panel details and concentrations are in Table S2. The detailed step-by-step protocol with reagents is published in protocols.io (dx.doi.org/10.17504/protocols.io.rm7vz6775gx1/v1). Slides were scanned using Zeiss Axio Scan.Z1 with Colibri7 light source and filter set 112 (365 nm [DAPI], 488 nm, 555 nm, 647 nm, 750 nm).
FAP antibody validation
FAP antibody specificity was validated using CRISPR-Cas9 knockout in the WPMY-1 myofibroblast cell line (ATCC CRL-2854). Lentiviral constructs 21 targeting FAP were produced and used to infect WPMY-1 cells. Following puromycin selection, FAP knockout was confirmed via immunohistochemistry.
CRISPR-Cas9-mediated FAP silencing in HCC89 cells
Three single-guide RNAs (sgRNAs) targeting human FAP were cloned into a LentiCRISPRv2GFP plasmid (gift from David Feldser, Addgene plasmid # 82416) 22. The guides were the following: FAP A1 (exon 2) Forward: 5′-CACCGCAATAAGGCAAGCACAGCAG-3′, Reverse: 5′-aaacCTGCTGTGCTTGCCTTATTGC-3′; FAP A3 (exon 9) Forward: 5′-CACCGCTACAAAATATGCTCTCTGG-3′, Reverse: 5′ aaacCCAGAGAGCATATTTTGTAGC-3′; FAP A2 (exon 17) Forward: 5′-CACCGCCCATTTCCACCCTTCATGA-3′, Reverse: 5′-AAACTCATGAAGGGTGGAAATGGGC-3′. HCC89 cells were transduced with HelVi-BVC lentivirus (10 µl per well; 8 µg ml⁻¹ polybrene) and expanded in complete RPMI-1640 + 10% FBS. FAP knockout efficiency in A1/A2/A3 populations was assessed by anti-FAP-AF647 immunofluorescence.
3D collagen invasion assay
HCC89 parental and FAP-edited (A1/A2/A3) cells were seeded as 10,000 cells/well in 8-well chamber slides in 100 µL of 50% Matrigel (Corning, #356231, growth-factor-reduced) diluted in RPMI-1640 + 10% FBS. Spheroids were allowed to form for 72 h at 37 °C/5% CO₂. A 100 µl overlay of type-I collagen (1 mg/mL, Corning, #354236, rat tail) was then added on top; gels were allowed to polymerize for 1 h at 37 °C, followed by addition of 300 µl complete medium. Human TGF-β1 (PeproTech #200-01B) and Human IL-1β recombinant protein (PeproTech #100-21) were included at 1 ng/ml where indicated. Three independent invasion assays with different time point monitoring were performed (12 h, 24 h, 96 h). Phase-contrast imaging was performed at 10× magnification; images were calibrated at 0.667 µm/pixel (150 px = 100 µm). For analysis, images were processed in JupyterLab (Python): segmentation using either adaptive thresholding (Sauvola, parental/A3) or a ridge+edge fusion (A1/A2), skeleton pruning, and object labeling. Per-object geometric features were computed; the primary readout was perimeter (µm) per segmented invasive structure.
Image processing and feature extraction
Scanned images (Zeiss*.czi*) were exported as TIFFs. Tissue cores were annotated and de-arrayed in FIJI/ImageJ. Cycle-to-cycle registration in MATLAB used the DAPI channel 23. Autofluorescent red blood cells were detected with ilastik (v1.3.3) 24 and excluded. Panel-specific ilastik classifiers generated epithelial (EpiMask) and stromal masks (TME panel: CA9/PanCK/E-cadherin for EpiMask; CAF panel 1: PDGFRB and αSMA for stroma). Nuclear segmentation on full-resolution DAPI employed the nucleAIzer deep-learning model 25. Nuclear masks were radially dilated by ~3 pixels within tissue masks to approximate whole-cell boundaries. Per-cell mean fluorescence intensities were then extracted for each channel using CellProfiler (v4.2.1) 26. Cell segmentation and phenotyping followed our published workflow 23, adapted to the present panels.
Cell classification
All classifications were performed in Jupyter Notebook (Python 3.6.8). Marker positivity was determined using fixed intensity thresholds defined a priori by a pathologist (T.M.) and a multiplex-IF expert (T.P.) on representative tiles. Thresholds were reviewed against per-marker intensity histograms and raw grayscale overlays and locked before any outcome analyses. Final cell identities were assigned via rule-based combinations of marker positivity/negativity applied consistently across panels. Epithelial cells were defined as cells overlapping the ilastik-derived epithelial mask while not fulfilling criteria for leukocytes, endothelium, or stromal lineages. Stromal cells comprised non-epithelial, non-leukocyte, non-endothelial cells; when available (CAF panels), the ilastik-derived stroma mask supported this assignment. Leukocytes were defined as CD45-positive cells and further subclassified into T-cell subsets and myeloid populations using standard marker combinations (for example, CD45 with CD3 and CD8 or CD4 for T-cell lineages; FOXP3 for regulatory T cells; CD68 with CD163 for macrophages; and CD11c for dendritic-like myeloid cells). Endothelial cells were identified by CD31 positivity. Because fibroblast activation protein (FAP) is expressed in multiple compartments, FAP positivity was called separately within tumor-epithelial and stromal compartments using the same fixed thresholds. Throughout, we use “CD45⁺ leukocytes” to denote the pan-immune population and name immune subsets explicitly.
Quantification of cell populations
Poor quality TMA cores were excluded per panel. Cell counts/proportions were averaged across replicate cores for each patient region. Proportions were calculated relative to relevant parent populations (e.g., % of Epi^-^ cells, % of CD45^+^ cells, % CD3^+^CD8^+^ cells) as indicated in figure/table legends. Cancer-associated fibroblasts (CAFs) were classified into 30 subsets (CAF1-30) based on combinatorial expression of PDGFRA, PDGFRB, FAP, αSMA (Panel 1) or other markers (Panel 2), adapting established systems 23, 27. Subset proportions were calculated relative to the total classified CAFs within the respective panel.
Visual scoring of mesenchymal markers in tumor cells
Due to suboptimal automated detection for certain markers within epithelial regions, visual scoring was performed by two scientists (T.M., T.P., consensus) for specified mesenchymal markers (PDGFRA, PDGFRB, FAP, αSMA, SPARC, VIM, POSTN) and PD-L1 expression in tumor cells, guided by reference stains (H&E, PAX8, EpiStain). While PDGFRA/B, αSMA, and POSTN were negative, FAP, SPARC, VIM, and PD-L1 showed positivity in tumor cells. Expression in each tumor core (tumor center/border replicates) was scored as 0 (negative), 1 (weak), or 2 (strong). For specific analyses, these per-core scores were aggregated per patient using different methods (e.g., maximum score observed across cores, any positive score, or a cumulative score). The specific aggregation method used for each analysis is detailed in the relevant figure and table legends.
Spatial heterogeneity testing (center vs. border)
We quantified intra-tumoral heterogeneity of tumor-cell FAP (ordinal 0/1/2) by comparing center and invasive border cores, restricting analyses to patients with both regions. We modeled FAP as a function of region with center as the reference, estimating the mean difference Δ(border-center) with patient-clustered robust standard errors (SEs). Models were fit separately within each cohort (Helsinki, Turku) and then in a pooled model that included a cohort indicator to account for baseline differences. We also tested a region×cohort interaction to evaluate whether the center-border difference varied between cohorts. Effects are reported as Δ with cluster-robust 95% CIs and Wald p-values.
Duplicate-core reliability within regions
To assess sampling reliability independent of center-border differences, we compared duplicate cores within each region (center: c1 vs. c2; border: b1 vs. b2) using exact agreement, one-step agreement (|Δ| ≤ 1), and quadratic-weighted Cohen's κ. We also used paired Wilcoxon signed-rank tests to check for any systematic within-region shift.
Statistical analyses
Statistical analyses were performed using GraphPad Prism (version 10.3.1), IBM SPSS Statistics (version 29.0.0.0), RStudio (version 2023.12.0) with R (version 4.2.2), and JupyterLab (version 3.0.16) with Python (version 3.6.15). In R, data manipulation and visualization used the tidyverse suite (version 2.0.0), including dplyr, ggplot2, readr (version 2.1.4), and readxl (version 1.4.3). The Mann-Whitney U test and Kruskal-Wallis test were used for non-parametric comparisons between two or more groups, respectively. Associations between categorical variables were assessed with Fisher's exact test or the chi-square test, as appropriate.
Region/interaction models were implemented in Python (statsmodels). For tumor-cell FAP heterogeneity (center vs. border), we used patient-clustered linear models with Huber-White (sandwich) standard errors to estimate the center-border difference and its 95% CI. For spatial immune-composition models, we fit linear mixed-effects models (statsmodels.formula.api.mixedlm) with a random intercept for patient and fixed effects for FAP (weak/strong vs. neg), region (border vs. center), core index (2 vs. 1), cohort, and the pre-specified FAP×region interaction for T cells. If a mixed model did not converge, we re-fit the identical specification by OLS with patient-clustered (Huber-White) SEs; in our data, the mixed model converged for exhausted CD8⁺, whereas Tregs and all myeloid features used the patient-clustered OLS fallback. When multiple comparisons were made, p values were adjusted using Bonferroni or controlled at 10% FDR with Benjamini-Hochberg.
For survival analyses. Kaplan-Meier (KM) curves and Cox proportional hazards (PH) models were performed in either R (survival/survminer) or Python (lifelines). The survival endpoint was from surgery to recurrence (RFS/MFS), and/or death (RFS), or end of follow-up. KM curves used log-rank tests. Multivariable Cox models were cohort-stratified when indicated (strata: Helsinki/Turku) and included tumor-cell FAP (weak vs. negative; strong vs. negative), age (binary cut at 65 years unless otherwise stated), pT (3-4 vs. 1-2), sex, grade, necrosis, and when stated continuous stromal features (CD31⁺, CD45⁺, stromal FAP%) entered as logits of their fractional areas. We used complete-case data, verified events-per-variable >10, assessed collinearity (all VIFs < 2), and checked PH with Schoenfeld residual tests (global and per-covariate). Sensitivity analyses when stated included the age cutoff (60/65/70 years) and treated pT as a covariate versus an additional stratum; results for FAP strong were directionally consistent.
Results
High immune infiltration correlates with poor prognosis in localized ccRCC
We performed multiplex immunofluorescence (mIF) using 33 antibodies (Figure 1A-D) on 1,728 multi-region tissue cores from 435 localized ccRCC patients (Table S1), generating single-cell data on key TME populations. Unsupervised clustering based on immune and stromal cell densities identified three distinct tumor microenvironment (TME) subtypes characterized predominantly by CD45⁺ leukocytes, CD31⁺ endothelial cells, or PDGFRB⁺ stromal cells, respectively (Figure 1E). High CD45⁺ leukocyte cell density strongly associated with subsequent disease recurrence across all sampled regions (Mann-Whitney U test, p < 0.05; Figure 1F).
Further characterization confirmed expected spatial distributions: Both leukocyte marking CD45⁺ cells and vascular endothelium marking CD31⁺ cells were more abundant in tumor regions compared to benign areas (Figure 2A-C), while these cell subsets showed a modest inverse correlation across all tissue samples (Figure 2D). Survival analyses on the merged cohort confirmed high CD45⁺ leukocyte infiltration predicted shorter RFS across all regions (Log-rank p ≤ 0.001; Figure 2E), while high CD31⁺ density predicted longer RFS, significantly only in tumor regions (Log-rank p < 0.001; Figure 2F). These opposing prognostic associations were validated by univariate Cox regression performed independently on the Helsinki and Turku cohorts (Figure S1A-C). Thus, high immune infiltration marks an aggressive TME subtype, prompting deeper investigation into tumor cell states and tumor microenvironment spatial interactions driving this poor prognosis in localized ccRCC.
Tumor-specific FAP expression marks an EMT phenotype and stratifies immune-infiltrated ccRCC
While high leukocyte infiltration (CD45^high^) identifies a poor-prognosis group overall, these tumors exhibited considerable heterogeneity in epithelial marker expression (Figure 3A, B). We therefore investigated whether epithelial differentiation status could further stratify risk within this CD45^high^ cohort. Using a pan-epithelial marker cocktail (EpiStain: CA9, E-cadherin, cytokeratins), we categorized CD45^high^ tumors into low, medium, and high EpiStain groups based on expression in tumor centers (Figure 3A-C). Strikingly, this stratification revealed further survival differences within this cohort, with decreasing EpiStain predicting shorter RFS (overall Log-rank p = 0.005; Figure 3D). Further characterization revealed that EpiStain^low^ tumors possessed lower CD31⁺ densities (Figure 3E-G) as well as EMT-like features such as higher VIM (vimentin) and SPARC (secreted protein acidic and rich in cysteine) (Table 1). Notably, tumor-cell fibroblast activation protein (FAP) expression emerged as a key feature, significantly enriched in these highly immune infiltrated EpiStain^low^ cases, particularly at the tumor borders (p < 0.001; Table 1, Figure 3H).
To assess intra-tumoral spatial heterogeneity, we compared tumor-cell FAP (neg/low/high) between tumor center and invasive border. Within patients, borders showed higher FAP than centers (Δ(border-center) = 0.133; paired Wilcoxon p = 1.8×10⁻⁹, n = 411 patients; Figure S2A)). Category distributions corroborated this shift (more FAP-high cores at borders; 6.7% vs. 3.2%; Figure S2B). Duplicate cores within each region demonstrated high reliability (center: exact agreement 0.87, one-step 0.99, κ = 0.54; border: exact 0.81, one-step 0.97, κ = 0.56), and there was no systematic drift between duplicates (Wilcoxon p = 0.080 for centers; p = 0.738 for borders; Figure S2C). Cohort-specific, patient-clustered models confirmed consistent border enrichment (Helsinki Δ = 0.168, p = 3.8×10⁻⁶; Turku Δ = 0.090, p = 4.4×10⁻⁴) with a cohort-adjusted pooled effect Δ = 0.124 (p = 7.3×10⁻⁹), with no strong evidence that the border-center difference varied by cohort (interaction p = 0.077; Figure S2D). These analyses support border-enriched tumor FAP as a robust feature aligned with EMT-like, immune-rich tumor states.
Importantly, tumor FAP robustly predicted shorter RFS within the CD45^high^ group and the full cohort (Figure 3I-J; Figure S3A-B), while tumor PD-L1 showed no survival associations (Figure 3K-L; Figure S3C-D). Despite positive correlations with overall immune infiltration and tumor PD-L1 expression (Table S3, Figure 3H), tumor FAP offered additional prognostic stratification within the already poor-survival CD45^high^ patient group. This establishes tumor FAP as a key spatial biomarker intrinsically linked to highly aggressive, EMT-like phenotype of inflamed ccRCC.
Tumor-cell FAP promotes 3D collagen invasion in ccRCC cells
To functionally test whether epithelial FAP drives an invasive phenotype, we edited FAP-positive HCC89 ccRCC cells (Figure S4A-B) with three independent CRISPR-Cas9 guides (FAP-A1/A2/A3) and compared them with parental cells in a 3D collagen-invasion assay. Cells were first allowed to form 3D spheroids on top of Matrigel (48 h), after which a collagen overlay (1 mg/ml) was applied. Efficient on-target editing was confirmed by immunofluorescence (IF) on 2D cultures: per-cell FAP intensity was markedly reduced in two guides (A1/A2), with a left-shift in the population intensity histogram and a decreased fraction of FAP-positive cells (Figure 4A-D). FAP antibody performance was validated also by loss-of-signal in IHC of a fibroblast cell line (Figure S4C).
Phase-contrast imaging in collagen revealed striking morphology differences: parental cells and the minimally edited A3 line formed arborized, stellate protrusions with long, branched networks, whereas FAP-KO lines (A1/A2) remained as compact, rounded spheroids with short or absent protrusions (Figure 4E). Quantitatively, in the 96-h time point the median invasive perimeter was 153.5 μm (A1) and 355 μm (A2) versus 667.5 μm in parental, corresponding to 23% (A1) and 53% (A2) compared with parental. These effects were consistent across fields and time points and remained significant under non-parametric testing with FDR control (Figure 4F-H). TGF-β + IL-1β (1 ng/ml each) did not systematically alter the invasion readout (Figure 4F-H). Together, these experiments provide causal functional evidence that epithelial FAP promotes a collagen-invasive phenotype in ccRCC cells.
Coordinated tumor and stromal FAP expression defines an aggressive microenvironment
Investigating the interplay between FAP expression in different compartments, we observed that tumor-cell FAP positivity was closely associated with an increased abundance of FAP⁺ stromal cells, particularly at the invasive tumor border (Kruskal-Wallis test, p < 0.001; Figure 5A). FAP⁺ stromal cells were also enriched in CD45^high^ tumors (p < 0.001; Figure 5B). Within the CD45^high^ group, tumors with loss of epithelial marker expression (EpiStain^low^ cases) had higher FAP⁺ stromal cells (p = 0.032), an association not seen with other stromal markers (PDGFRA, POSTN, SPARC), indicating that stromal FAP specifically reflects an inflammation and EMT-associated response (Figure 5C). Increasing FAP⁺ stromal density associated with shorter RFS (overall Log-rank p = 0.029; Figure 5D), confirmed by Cox regression across tumor border and center (p < 0.001) as well as tumor adjacent benign regions (p = 0.027; Figure 5E). Further CAF subset spatial distribution analysis (Figure S5A-D) identified border-enriched myofibroblastic FAP⁺/αSMA⁺/PDGFRB⁺ subset (CAF7) predicting poor RFS (Cox p < 0.001; Figure 5F), while center-enriched single-marker POSTN⁺ cells predicted improved RFS (Cox p < 0.001, Figure S5E-H), highlighting spatial context importance for CAFs.
Tumor FAP expression associates with a spatially organized immunosuppressive microenvironment
We next examined how tumor FAP relates to immune composition and whether these associations depend on spatial context. Across all ccRCCs, higher tumor FAP scores were associated with a skewed myeloid landscape with more M2-like macrophages (CD163⁺) especially at the invasive border (Kruskal-Wallis p < 0.001) but fewer CD11c⁺ cells in the tumor center (p < 0.05; Figure 6A) and with increased fractions of terminally exhausted (PD-1⁺TIM-3⁺) CD8⁺ T cells and FOXP3⁺ regulatory T cells (Tregs) (p < 0.01; Figure 6B). These patterns persisted within CD45^high^ tumors (Figure S6A-B), indicating the effect is not driven by total leukocyte load.
At the per-core analysis, tumor-cell FAP correlated positively with Tregs and exhausted CD8⁺ T cells across all four cores (Center1/Center2/Border1/Border2) and with M2-like macrophages, while showing negative or null correlations with CD11c⁺ fractions (Figure 6C). Cohort-stratified correlation maps (Helsinki and Turku) showed the same pattern (Figure S6C-D).
To test whether these patterns reflect true spatial biology rather than between-patient differences, we fit multivariable linear mixed-effects models (LMM) with a patient-level random intercept, leveraging the four distinct TMA cores per patient. Fixed effects were tumor FAP category, region (center vs. border), TMA core index, and cohort (Helsinki/Turku), with prespecified FAP×region interactions for Tregs and exhausted CD8⁺ T cells, allowing us to estimate the independent effects of FAP and region while accounting for within-patient correlation. Exhausted CD8⁺ T cells and Tregs increased with FAP independent of cohort and region, and the region term was positive, confirming border-enrichment irrespective of FAP level (β = 1.31-3.53; joint wald test p ≤ 0.004; Figure 6D). Interaction terms (FAP×border) were small and non-significant (Wald0.05), indicating that FAP association is present in both regions rather than being confined to the border. For myeloid subsets, FAP was region-independently associated with CD163+ M2-like macrophages (β = 0.49-0.95; Wald p ≤ 0.001; Figure S6E mid-panel), whereas M1-like cells showed lower values at the invasive borders (β = -0.24; p** =** 0.003; left panel). For CD11c+ dendritic cell fractions, the region effect did not reach significance in the LMM (Figure S6E, right-panel). Core-index effects were near zero, and duplicate-core reliability was moderate (ICC(2,1) = 0.3-0.56), supporting robustness of per-core estimates (Figure S6F-G).
Finally, univariate Cox models using continuous immune fractions showed that higher M2-like macrophages (Univariate Cox p = 0.012), exhausted T cells (Cox p = 0.003), and Tregs (Cox p = 0.007) predicted shorter RFS, especially when enriched at the tumor border, whereas higher center CD11c⁺ cells was associated with better outcomes (Cox p < 0.003) (Figure 6E-F). Collectively, these data link tumor-cell FAP to a spatially patterned immunosuppressive TME, characterized by higher Treg and exhausted CD8⁺ T cell fractions and a shift toward M2-like macrophages, with enrichment most pronounced at the invasive border.
Tumor FAP independently predicts recurrence in ccRCC
We next evaluated the clinical relevance of tumor FAP expression in ccRCC. In Kaplan-Meier analyses with three-tier categorisation, positive tumor FAP was associated with shorter RFS both in Helsinki (n = 178) and Turku (n = 222) cohorts separately (log-rank, p ≤ 0.004 for both; Figure 7A-B). The association was also observed when tumor FAP was analyzed separately in spatially distinct tumor-border cores within each cohort (log-rank, p < 0.001 and p = 0.046; Figure S7A-B). To spatially and clinically validate these findings, we performed multivariable Cox regression in the two tumor-border foci of the same cases: strong tumor FAP remained independently associated with shorter RFS in both foci (Cox p = 0.006 and 0.011; Figure 7C-D).
To evaluate independence from clinical and stromal features, we constructed a cohort-stratified multivariable Cox model including age, sex, pT, grade, necrosis, and continuous logit-scaled stromal metrics (CD31⁺, CD45⁺, stromal FAP%). In this joint model, strong tumor-cell FAP remained independently associated with shorter RFS (Figure 7E), with consistent effect sizes across alternative age cut-points and pT handling (Figure S7C).
We then focused on early-stage disease (pT1-2; n = 302). Strong tumor FAP showed strong univariate association with shorter RFS (Cox p < 0.001; Figure S8A) and remained significant in Kaplan-Meier analyses performed on the combined cohort (log-rank p < 0.001; Figure S8B) and within each cohort separately (log-rank p ≤ 0.031; Figure S8C-D). Crucially, strong tumor FAP remained an independent predictor of RFS in multivariable regression (Cox p = 0.022; Figure S8E). The effect was even stronger for metastasis-free survival (MFS) (Cox p < 0.001; Figure S8F), where tumor FAP outperformed age as a predictor of metastatic potential. Collectively, tumor-cell FAP is a robust, independent prognostic marker in ccRCC, including early-stage disease.
Discussion
This study leveraged multi-region, single-cell spatial profiling to dissect the complex tumor microenvironment of localized clear cell renal cell carcinoma (ccRCC), revealing an unexpected and central role for fibroblast activation protein (FAP) expressed directly on tumor epithelial cells. While conventionally viewed as a stromal marker, our findings establish that tumor-cell FAP expression identifies a distinct and aggressive subset of localized ccRCC. This phenotype, particularly enriched in highly immune-infiltrated tumors, integrates key hallmarks of poor prognosis: an epithelial-to-mesenchymal transition (EMT)-like state, profound immune suppression characterized by M2-like macrophage and regulatory T cell enrichment, T cell exhaustion, and reduced angiogenesis. Crucially, tumor FAP emerged as a robust independent predictor of recurrence-free survival, even in early-stage disease, highlighting its potential role in early tumor progression.
Our analysis confirmed key TME prognostic associations (high CD45⁺ correlating with shorter RFS and high CD31⁺ with longer RFS) within localized ccRCC, extending observations previously made largely in metastatic settings 8-14. However, we moved beyond this by showing tumor FAP expression effectively stratifies the prognostically heterogeneous CD45^high^ group. Tumor-cell FAP integrates multiple converging adverse processes (EMT, immune evasion including PD-L1 co-expression, impaired angiogenesis), encapsulating the core biology of this aggressive immune-rich phenotype in a single spatial marker.
Tumor FAP association with low EpiStain and other mesenchymal markers provides strong, spatially resolved protein-level evidence for an EMT-like program in aggressive localized ccRCC. FAP marked this state more robustly than traditional EMT markers prognostically, perhaps reflecting a distinct EMT program linked to immune modulation 17, 19. Frequent PD-L1 co-expression further suggests tumor FAP signifies cells undergoing EMT while engaging adaptive immune resistance. Our EMT findings in ccRCC progression build on earlier transcriptomic studies 12, 14 by demonstrating protein-level changes in localized tumors. Consistent with an invasion-competent EMT state, CRISPR-Cas9 FAP knockout in HCC89 spheroids attenuated 3D collagen I invasion, supporting a cell-autonomous role for tumor-cell FAP in invasion.
We explicitly assessed intra-tumor spatial heterogeneity and found higher tumor-cell FAP at the invasive border relative to tumor centers, with consistent effects across cohorts. This inter-regional pattern aligns with the observed enrichment of immunosuppressive niches at the border. Intriguingly, tumor-cell FAP expression strongly correlated with the abundance of FAP⁺ CAFs, with spatial colocalization particularly evident at the invasive border. This co-occurrence, alongside the co-enrichment of both FAP⁺ tumor cells and FAP⁺ CAFs in immune-rich (CD45^high^) and EMT^high^ (EpiStain^low^) tumors, suggests a shared induction mechanism - a “field effect” in which immune-driven inflammation may up-regulate FAP via cytokines such as IL-1β, TGF-β, or CCL2 28-31. However, our detailed CAF subtyping also revealed significant spatial and functional heterogeneity within the stroma. While myofibroblastic FAP⁺/αSMA⁺ CAFs (e.g., CAF7) enriched at the border correlated strongly with poor prognosis, echoing findings in other cancers 19, 23, 27, POSTN⁺ CAFs specifically within the tumor center were linked to improved survival, potentially aligning with reports of antigen-presenting CAF functions 19. This highlights the importance of CAF subtype and spatial location when assessing stromal roles in ccRCC progression.
The microenvironment associated with high tumor-cell FAP expression was profoundly immunosuppressive, characterized by skewed myeloid populations (increased M2-like CD68⁺CD163⁺ macrophages, decreased CD11c⁺ myeloid cells) and accumulations of FOXP3⁺ regulatory T cells (Tregs) and terminally exhausted (PD-1⁺TIM-3⁺) CD8⁺ T cells. Importantly, these immunosuppressive elements were specifically enriched at the invasive tumor border regions in tumors with strong tumor-cell FAP expression. Survival analyses underscored the prognostic significance of this spatial organization: higher densities of M2-like macrophages, exhausted CD8⁺ T cells, and Tregs at the tumor border predicted significantly shorter recurrence-free survival. Conversely, tumors with low FAP expression in the tumor center exhibited enrichment of CD11c⁺ myeloid cells, correlating with improved outcomes. Thus, tumor-cell FAP expression is not only indicative of immune dysfunction but spatially coordinates this dysfunction specifically at the invasive front, suggesting immune evasion mechanisms concentrated at critical tumor-host interaction sites. Remarkably, these associations persisted even within the CD45^high^ subgroup, emphasizing that tumor-cell FAP captures distinct aspects of immune dysfunction independent of overall immune infiltration levels.
Our findings position tumor FAP as a compelling biomarker. Its independent prediction of recurrence, particularly in early-stage ccRCC, suggests utility for risk stratification and potentially guiding adjuvant therapy selection. Non-invasive FAPI-PET imaging 32 could enable real-time risk assessment. Furthermore, FAP is an attractive therapeutic target 33-35, and our data showing its dual expression on both aggressive tumor cells and 'activated' CAFs provide strong rationale for investigating FAP-targeted therapies in this high-risk subtype. In addition, consistent with an invasion-competent EMT state, CRISPR-Cas9 knockout of FAP in ccRCC spheroids reduced 3D collagen invasion, providing causal, cell-autonomous support for tumor-cell FAP as a driver of invasive behavior and aligning with our tissue-level EMT/immunosuppression phenotype.
The limitation of this study includes the reliance on multi-region TMAs, which inherently sample a limited field of view. To mitigate this, we systematically analyzed two center and two border cores per patient, demonstrated high within-region reliability and consistent border-center differences across two independent cohorts, and replicated prognostic associations in duplicate border cores as well as in cohort-stratified multivariable models. Spatial mixed-effects analyses and orthogonal functional invasion assays further support the biological conclusions. Nevertheless, prospective validation on whole-slide sections and in biopsy cohorts will be important to confirm generalizability and to facilitate clinical implementation. Because FAP and immune subsets were measured on different sections, we could not compute single-cell proximity/neighbor statistics between FAP⁺ tumor cells and immune cells; our region- and core-level analyses with mixed-effects modeling partially address spatial relationships. Future work will implement same-section multiplexing to enable per-cell nearest-neighbor/co-occurrence tests. In addition, functional validation was limited to an in vitro 3D spheroid invasion assay in a single ccRCC line that does not model immune crosstalk and additional in vivo studies will be needed to define mechanism and generalizability. Mechanisms driving tumor FAP expression warrant further study.
Conclusions
Our spatial analysis identifies tumor epithelial FAP expression as a hallmark of aggressive, highly immune-infiltrated localized ccRCC. Tumor FAP integrates EMT programs with a spatially organized immunosuppressive TME and independently predicts recurrence. These findings highlight spatial context importance and position tumor FAP as a promising biomarker and therapeutic target. Future research should utilize these insights to guide biomarker-driven therapeutic decisions for localized ccRCC.
Supplementary Material
Supplementary figures and tables.
The reference list from the paper itself. Each links out to its DOI / PubMed record.
- 1Kane CJ Mallin K Ritchey J Cooperberg MR Carroll PR Renal cell cancer stage migration: analysis of the National Cancer Data Base Cancer 200811378831849137610.1002/cncr.23518 · doi ↗ · pubmed ↗
- 2Leibovich BC Lohse CM Cheville JC Zaid HB Boorjian SA Frank I Predicting Oncologic Outcomes in Renal Cell Carcinoma After Surgery Eur Urol 201873772802939826510.1016/j.eururo.2018.01.005 · doi ↗ · pubmed ↗
- 3Leibovich BC Lohse CM Crispen PL Boorjian SA Thompson RH Blute ML Histological subtype is an independent predictor of outcome for patients with renal cell carcinoma J Urol 20101831309152017168110.1016/j.juro.2009.12.035 · doi ↗ · pubmed ↗
- 4Allaf M Kim SE Harshman LC Mc Dermott DF Master VA Signoretti SLBA 67 Phase III randomized study comparing perioperative nivolumab (nivo) versus observation in patients (Pts) with renal cell carcinoma (RCC) undergoing nephrectomy (PROSPER, ECOG-ACRIN EA 8143), a National Clinical Trials Network trial Annals of Oncology 202233 S 1432 S 3
- 5Motzer RJ Russo P Grunwald V Tomita Y Zurawski B Parikh O Adjuvant nivolumab plus ipilimumab versus placebo for localised renal cell carcinoma after nephrectomy (Check Mate 914): a double-blind, randomised, phase 3 trial Lancet 2023401821323677493310.1016/S 0140-6736(22)02574-0PMC 10259621 · doi ↗ · pubmed ↗
- 6Pal SK Uzzo R Karam JA Master VA Donskov F Suarez C Adjuvant atezolizumab versus placebo for patients with renal cell carcinoma at increased risk of recurrence following resection (I Mmotion 010): a multicentre, randomised, double-blind, phase 3 trial Lancet 20224001103163609992610.1016/S 0140-6736(22)01658-0 · doi ↗ · pubmed ↗
- 7Powles T Albiges L Bex A Grunwald V Porta C Procopio GESMO Clinical Practice Guideline update on the use of immunotherapy in early stage and advanced renal cell carcinoma Ann Oncol 202132151193459779910.1016/j.annonc.2021.09.014 · doi ↗ · pubmed ↗
- 8Senbabaoglu Y Gejman RS Winer AG Liu M Van Allen E Mde Velasco G Tumor immune microenvironment characterization in clear cell renal cell carcinoma identifies prognostic and immunotherapeutically relevant messenger RNA signatures Genome Biol 2016172312785570210.1186/s 13059-016-1092-z PMC 5114739 · doi ↗ · pubmed ↗