Correction: Suzuki, K.; Ito, T. Virtual Observation Using Location-Dependent Statistical Information of Cyclists’ Movement for Estimation of Position and Uncertainty. Sensors 2025, 25, 5122
Kento Suzuki, Takuma Ito

Abstract
Click any figure to enlarge with its caption.
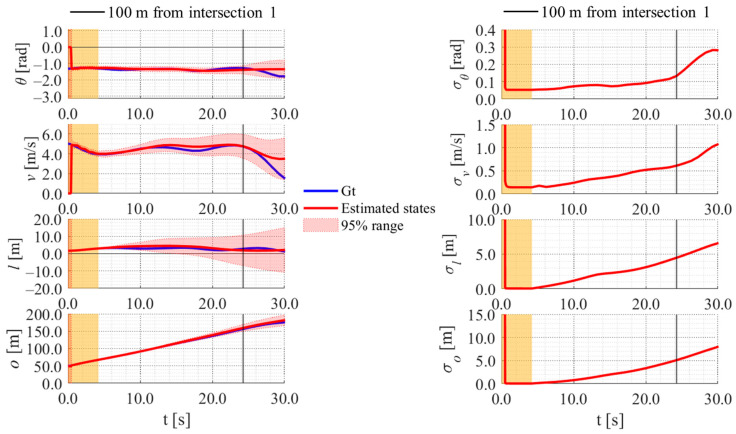 Figure 23
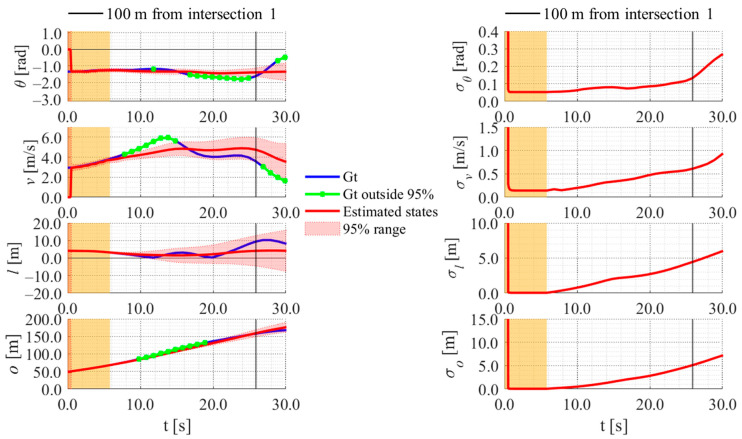 Figure 25
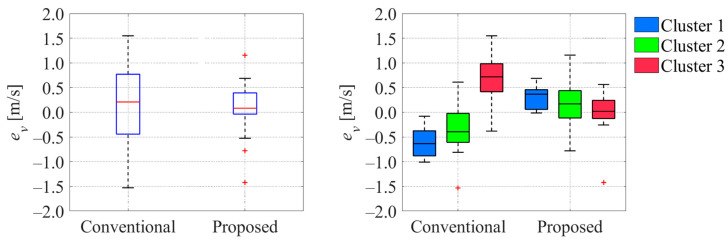 Figure 26
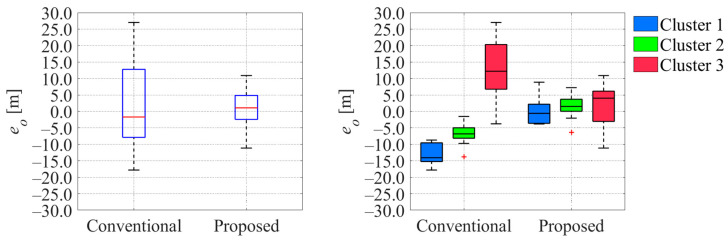 Figure 27
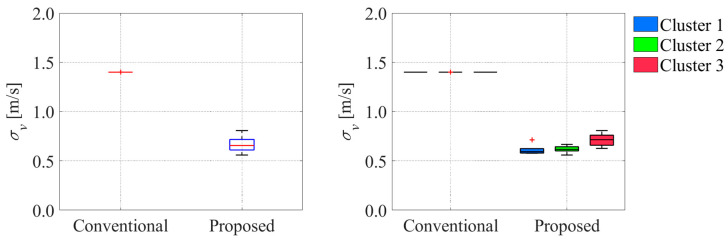 Figure 28
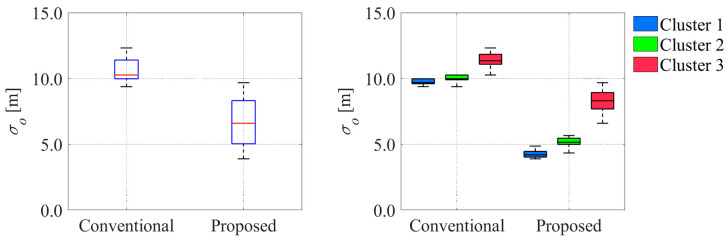 Figure 29
| GT Cluster | Cluster 1 (5 Data) | Cluster 2 (9 Data) | Cluster 3 (15 Data) | |||||||
|---|---|---|---|---|---|---|---|---|---|---|
| Classified Cluster | 1 | 2 | 3 | 1 | 2 | 3 | 1 | 2 | 3 | |
| Correct | Wrong | Wrong | Wrong | Correct | Wrong | Wrong | Wrong | Correct | ||
| Average ratio within the confidence interval | Velocity | 0.90 | 0.72 | 0.38 | 0.65 | 0.92 | 0.89 | 0.44 | 0.46 | 0.94 |
| Offset | 0.77 | 0.65 | 0.36 | 0.57 | 0.93 | 0.83 | 0.24 | 0.15 | 0.93 | |
Peer Reviews
No public reviews on file for this paper yet. If you reviewed it on a platform where reviews are public (OpenReview, ICLR, NeurIPS, ICML), you can paste yours below so the community can read it here.
Videos
No videos yet. Explain this paper in a talk, walkthrough, or lecture? Add one.
Taxonomy
TopicsInertial Sensor and Navigation · Indoor and Outdoor Localization Technologies · Human Mobility and Location-Based Analysis
An implementation mistake was found in our simulation program which makes minor changes in some figures and a table in the original publication [1].
Figure Correction
In the original publication [1], there were mistakes in Figures 23 and 25–29. The corrected version of the figures are provided below.
Estimated results of data 22 in Cluster 2 using the proposed method.
Estimated results of data 11 in Cluster 2 using the proposed method.
Comparison of estimated velocity error between conventional and proposed methods. The blue boxes in the left graph indicate the interquartile range, and the red lines inside the blue box indicate the median. The red plus signs in the graphs indicate the outliers.
Comparison of estimated offset error between conventional and proposed methods. The blue boxes in the left graph indicate the interquartile range, and the red lines inside the blue box indicate the median. The red plus signs in the graphs indicate the outliers.
Comparison of velocity uncertainty between conventional and proposed methods. The blue boxes in the left graph indicate the interquartile range, and the red lines inside the blue box indicate the median. The red plus signs in the graphs indicate the outliers.
Comparison of offset uncertainty between conventional and proposed methods. The blue boxes in the left graph indicate the interquartile range, and the red lines inside the blue box indicate the median.
Table Correction
In the original publication [1], there were mistakes in Table 3. The corrected version of the table is provided below.
The authors apologize for any inconvenience caused and state that the scientific conclusions are unaffected. The original article has been updated. This correction was approved by the Academic Editor. The original publication has also been updated.
The reference list from the paper itself. Each links out to its DOI / PubMed record.