Volatile Profiling and Variety Discrimination of Leather Using GC-IMS Coupled with Chemometric Analysis
Lingxia Wang, Siying Li, Xuejun Zhou, Yang Lu, Xiaoqing Wang, Zhenbo Wei

TL;DR
This study uses GC-IMS and chemometric analysis to distinguish between cowhide, sheepskin, and pigskin based on their volatile compound profiles.
Contribution
The study introduces a robust method combining GC-IMS and chemometric techniques for accurate leather type discrimination.
Findings
Cowhide showed distinct volatile profiles, clearly separating from sheepskin and pigskin.
Shared and unique volatile markers were identified for each leather type using chemometric methods.
GC-IMS combined with chemometrics proved effective for leather authentication.
Abstract
Volatile fingerprint analysis using Gas Chromatography–Ion Mobility Spectrometry (GC-IMS) was applied to differentiate cowhide (22 samples), sheepskin (6 samples), and pigskin (6 samples). A total of 126 signal peaks were detected from the whole GC-IMS dataset, with 96 volatile compounds identified. Principal Component Analysis (PCA) revealed distinct clustering: cowhide exhibited unique volatile profiles, separating itself clearly from sheepskin and pigskin, which showed significant similarity. This was confirmed by Hierarchical clustering, K-means clustering (optimal k = 2), and Partial Least Squares Discriminant Analysis (PLS-DA) (R2 = 0.9836, Q2 = 0.9040). Cowhide was characterized by exclusive compounds (2-Hexanone, alpha-Thujene, Butyl acetate, 3-Methyl-2-butanol, 2-Heptanone, Hexyl methyl ether-monomer, Diethyl disulfide). Sheepskin and pigskin shared exclusive compounds…
Genes, proteins, chemicals, diseases, species, mutations and cell lines named across the full text — each resolved to its canonical identifier and authoritative record.
Click any figure to enlarge with its caption.
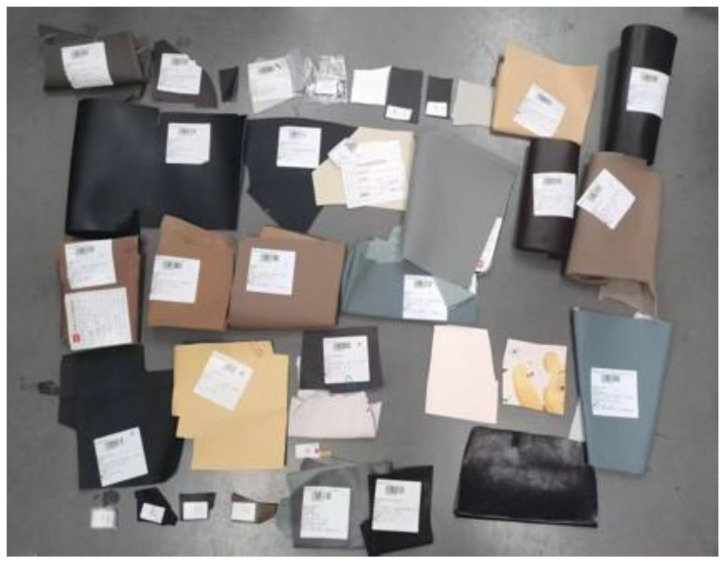 Figure 1
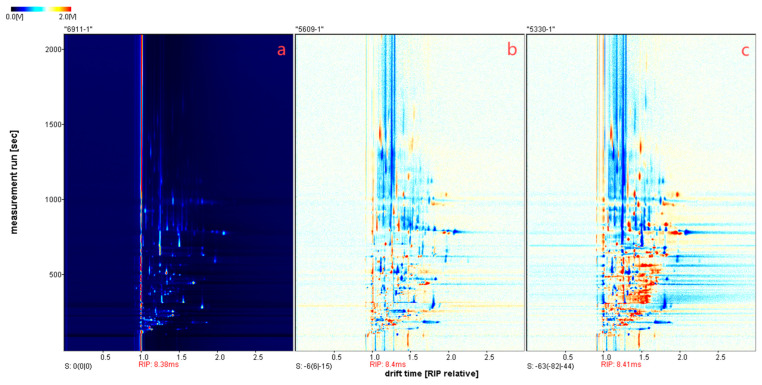 Figure 2
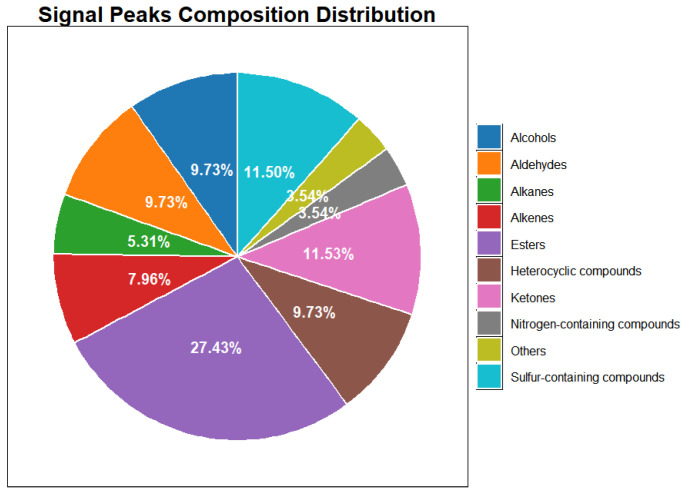 Figure 3
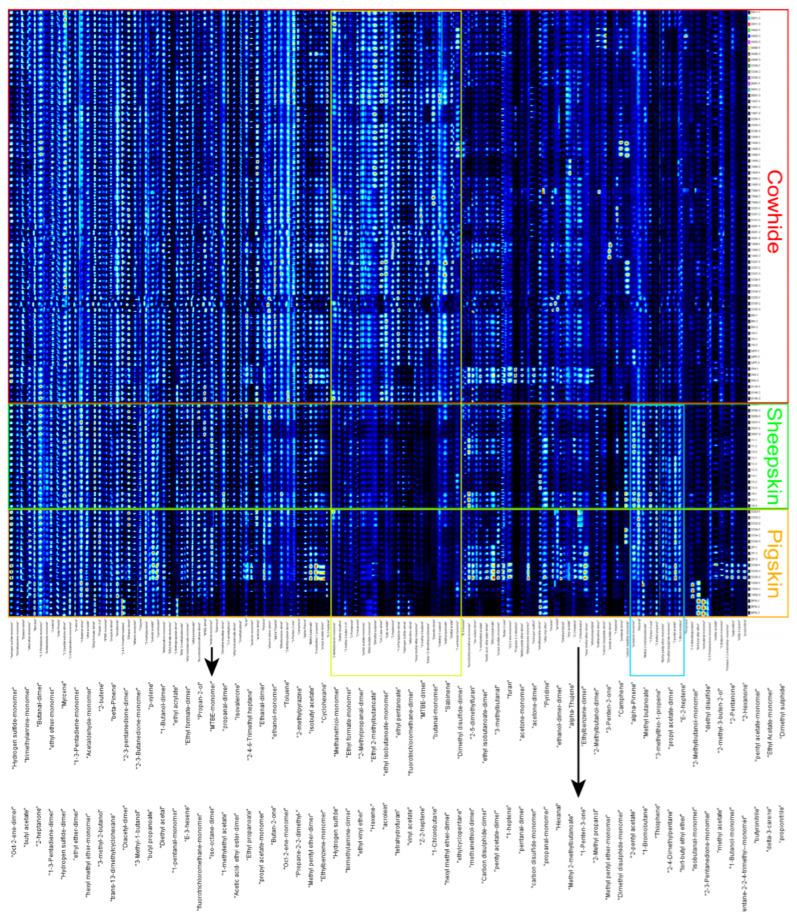 Figure 4
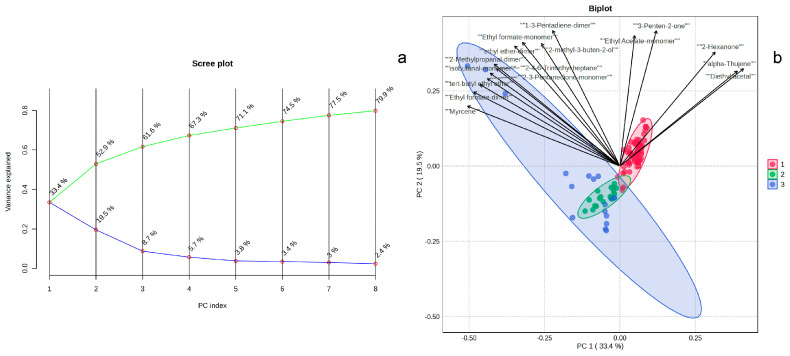 Figure 5
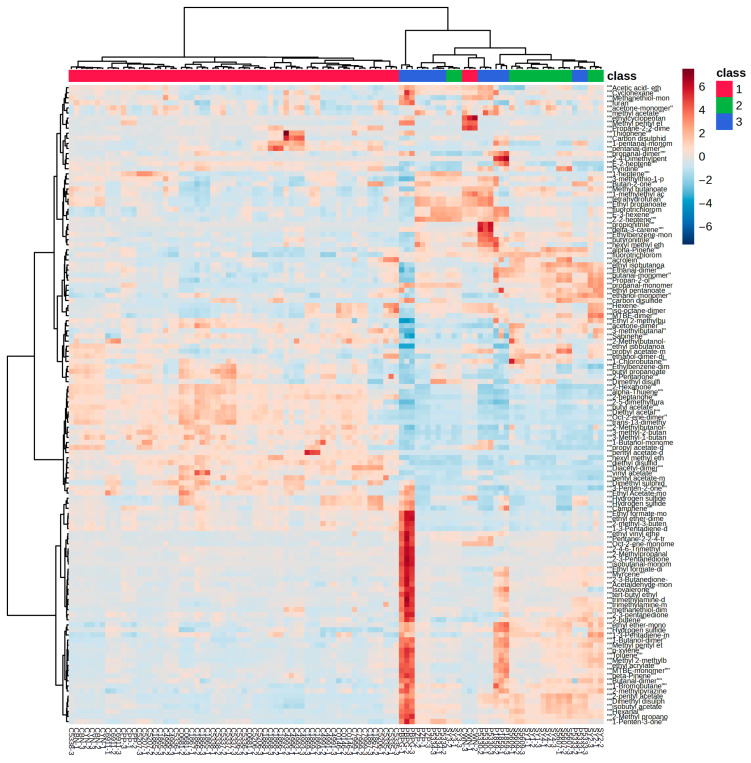 Figure 6
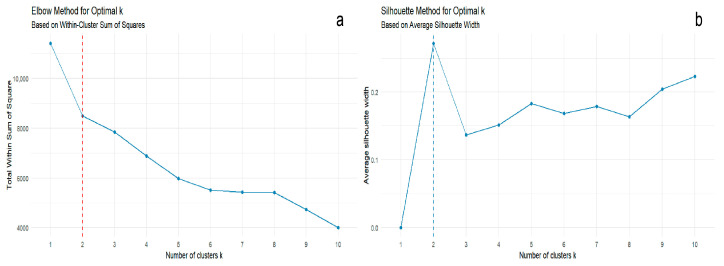 Figure 7
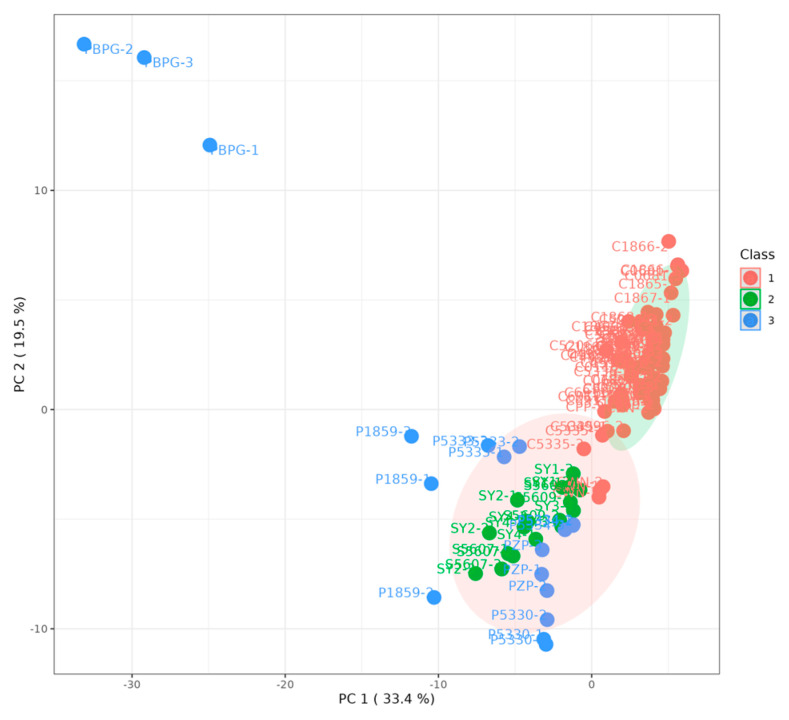 Figure 8
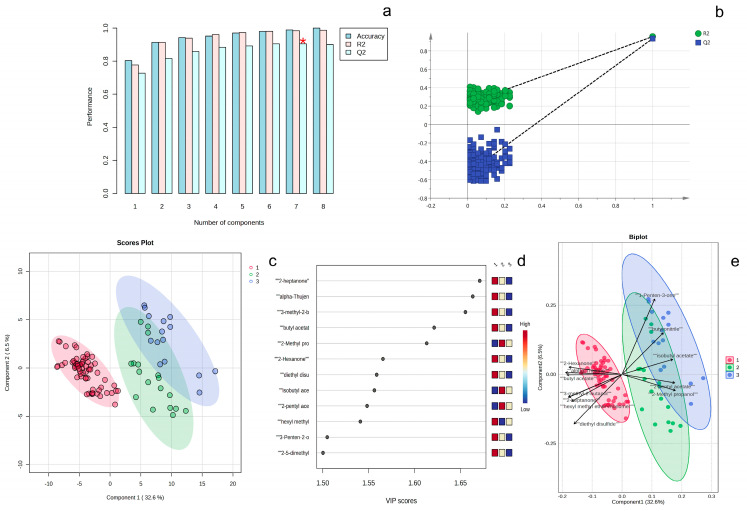 Figure 9
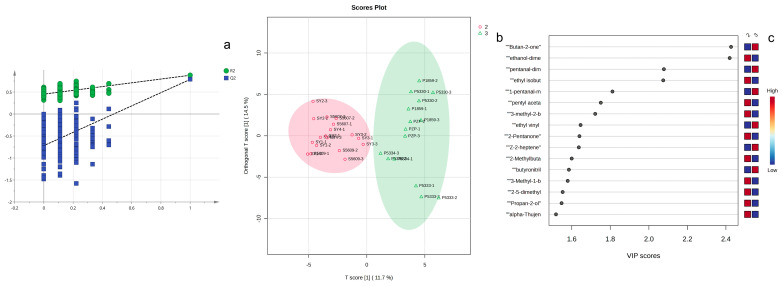 Figure 10
- —Science and Technology Program Project of the Zhejiang Administration for Market Regulation
Peer Reviews
No public reviews on file for this paper yet. If you reviewed it on a platform where reviews are public (OpenReview, ICLR, NeurIPS, ICML), you can paste yours below so the community can read it here.
Videos
No videos yet. Explain this paper in a talk, walkthrough, or lecture? Add one.
Taxonomy
TopicsFermentation and Sensory Analysis · Wood and Agarwood Research · Cultural Heritage Materials Analysis
1. Introduction
Leather is widely utilized in daily life. As a polymeric composite material derived from animal hides, leather products exhibit favorable hygiene properties, dyeability, and robust mechanical performance, demonstrating significant potential for use in apparel, footwear, bags, and household goods [1,2]. Natural leathers such as cowhide, sheepskin, and pigskin exhibit substantial performance variations, making them suitable for different manufacturing applications [3]. Their market values also differ considerably, posing challenges for consumer identification [4,5]. Characterizing the composition and concentration of volatile substances in cowhide, sheepskin, and pigskin provides critical safeguards for consumers selecting safe and compliant leather products. This not only protects consumer rights but also assists manufacturers in optimizing production processes. These insights contribute to improved product quality, the reduction of undesirable odors, enhanced customer satisfaction, and strengthened market competitiveness. Furthermore, this research provides data supporting the establishment of relevant industry standards and specifications, enabling effective differentiation of leather product raw materials and components to promote standardized development within the leather industry [6]. Traditional identification methods such as sensory evaluation and infrared spectroscopy have been largely phased out in the market due to their ineffectiveness in distinguishing leather types [4,7]. Meanwhile, optical microscopy identification is cost-prohibitive, technically complex, and challenging for non-specialists to implement accurately [5,8].
Volatile organic compound (VOC) emissions and odor is established as the important indicators for different types of leathers [9,10], because the complex sources of VOCs and odor are produced by its animal-sourced inherent characteristics as a natural product. The flavor analysis techniques like Gas Chromatography–Mass Spectrometry (GC-MS) was applied for the animal species of samples studies, and five different types of Leather (goatskin, sheepskin, horsehide, bovine, and pigskin) were clear classified [11,12]. However, GC-MS provide precise compound identification but require complex sample preparation and are time-consuming [13,14,15]. Although electronic nose detection offers rapid analysis, it exhibits limitations in differentiating samples with similar aromatic profiles [14]. Gas Chromatography–Ion Mobility Spectrometry (GC-IMS), an emerging analytical technique, combines the high separation capability of gas chromatography with the high sensitivity of ion mobility spectrometry [13,14,16]. Requiring minimal sample preparation, featuring straightforward operation, and delivering rapid detection, this technology demonstrates unique advantages in volatile compound analysis and shows significant promise for food and agricultural product authentication, particularly for distinguishing volatile profiles across different leather types [7,13].
Therefore, this study employs GC-IMS technology to analyze the volatile fingerprints of cowhide, sheepskin, and pigskin samples. Through chemometric approaches, we aim to identify marked volatile components for discriminating these three leather types and establish a methodological model for their identification, providing a scientific foundation for classification and authentication within the leather market.
2. Materials and Methods
2.1. Leather Collection and Sample Preparation
Twenty-two types of cowhide samples (C6911, C4993, C4996, C5336, C0681, C1867, C5206, C1868, C1866, C1865, C7999, C5207, C4991, C1869, C5337, C5338, C5335, CBN, CYN, CPP, CWN, C0146), six types of sheepskin samples (S5609, S5607, SY1, SY2, SY3, SY4) and six types of pigskin samples (P5333, P5334, PZP, P5330, P1859, PBPG) were provided by the Zhejiang Institute of Quality Science (Hangzhou, China) transported to the laboratory and stored at room temperature for testing (all finished leather, Figure 1).
2.2. Volatile Profiles Analysis of Leather
Analysis was performed using a Flavourspec^®^ GC-IMS system (G.A.S., Dortmund, Germany) equipped with an autosampler (CTC Analytics AG, Zwingen, Switzerland) and an Rtx-WAX capillary column (30 m × 0.32 mm × 0.25 μm, RT-12424; Restek, Beijing, China). A 1 g sample of leather, cut into 5 cm × 5 cm pieces was placed in a 20 mL headspace vial (Agilent Technologies, Santa Clara, CA, USA). The headspace vial was incubated at 60 °C with 500 r/min agitation for 30 min. Subsequently, 300 μL of headspace gas was injected into the inlet (80 °C) using a gastight syringe maintained at 85 °C. The column was maintained at 40 °C. Ultra-pure nitrogen (99.99%) carrier gas flow was programmed as follows: initial flow 2 mL/min (hold 2 min), ramped to 10 mL/min over 10 min, ramped to 100 mL/min over 20 min, ramped to 150 mL/min over 30 min. Ionization utilized a β-radiation source (^3^H, 300 MBq) in positive ion mode. The drift tube operated at 45 °C with a 9.8 cm length and 500 V/cm electric field strength, using nitrogen drift gas at 150 mL/min. Retention indices were calibrated using n-ketone standards (C_4_–C_9_; Sinopharm, Beijing, China). Three parallels were set for each sample. Volatile compound identification was achieved by matching against both the NIST database and the GC-IMS Library Search application’s IMS database. The identification of compounds consists of two key steps: first, comparing the retention index of the compound with that of reference standards in the NIST database; second, comparing its drift time with that of standard compounds in the IMS database. If both values show close agreement with those of known standards, the compound can be confidently identified. Data extraction, processing, and generation of topographic plots and comparative gallery plots were performed using LAV software (version 2.2.1; G.A.S., Dortmund, Germany) to obtain signal peaks information.
2.3. Statistical Analysis
Principal Component Analysis (PCA) utilized median-based autoscaling normalization (centering on the median and scaling by the standard deviation of each variable [13]) of the raw data implemented in MetaboAnalyst 6.0 (www.metaboanalyst.ca, access date: 20 June 2025). Hierarchical cluster analysis (HCA) is a clustering technique used to group similar objects into clusters based on their pairwise distances or similarities. HCA builds a treelike hierarchical decomposition of the data, where clusters at each level of the hierarchy are formed by merging or splitting existing clusters [17]. K-means minimizes within-cluster squared distances and is simple to implement when using class cardinality, which denotes the number of samples per class [18]. HCA was executed using MetaboAnalyst 6.0 and the h-clust function from the base R package (R 4.4.1). The optimal number of clusters (k) was determined using the within-group sum of squares (WSS) and the silhouette method, implemented via the fviz_nbclust function from the factoextra R package [19,20]. Specific classification results were visualized as heatmaps and PCA score plots. Heatmaps and PCA score plots were generated by MetaboAnalyst 6.0. Partial Least Squares Discriminant Analysis (PLS-DA) and Orthogonal Partial Least Squares Discriminant Analysis (OPLS-DA) were also conducted using MetaboAnalyst 6.0. Other data calculations were performed using Microsoft Excel 2016 (Microsoft Corp., WA, USA).
3. Results and Discussion
3.1. Volatile Profiles Analysis of Leather with Different Varieties
A total of 126 signal peaks were extracted from three types of leather samples (Table 1). Approximately 93% of the compounds were located in the front region of the topographic plot (Figure 2), with retention times concentrated between 100–1000 s and retention indices ranging from 400 to 1200. Ninety-six volatile compounds were identified, encompassing esters, alcohols, acids, ketones, aldehydes, alkanes, sulfur-containing compounds, nitrogen-containing compounds, and heterocyclic compounds. Among these, esters constituted the largest proportion at 27.43% (Figure 3). When all signal peaks were arranged in a gallery plot (Figure 4), the volatile fingerprints of sheepskin and pigskin showed significant similarity, while cowhide exhibited distinct differences from both. Three compounds—dimethyl disulphide-monomer, 2-pentyl acetate, and 1-bromobutane—were exclusively present in both sheepskin and pigskin but absent in cowhide. Conversely, hexyl methyl ether-monomer, 3-methyl-2-butanol, and diacetyl-dimer were uniquely detected in cowhide but not observed in either sheepskin and pigskin samples.
3.2. Principal Component Analysis of GC-IMS Data
To further analyze the volatile fingerprint characteristics of leather and identify signature volatile components for discriminating the three leather types, PCA was performed on the GC-IMS data. PCA was performed to visualize the overall volatile profile of leather samples (Twenty-two types of cowhide, six types of sheepskin and six types of pigskin were used for PCA, and three parallels were set for each sample). PCA is an unsupervised dimensionality reduction technique that projects high-dimensional data onto a lower-dimensional space through linear transformation, preserving the directions of maximum variance (principal components) [16]. The first 8 principal components (PCs) cumulatively explained 79.9% of the variance in the odor profiles (Figure 5a). Among these, the first two principal components (PC1 and PC2) individually accounted for 33.4% and 19.5% of the odor profile variance, respectively. In the biplot composed of the score plot and the loading plot (Figure 5b), it can be observed that the positions of the cowhide and sheepskin samples were relatively concentrated, indicating that their volatile fingerprint characteristics were quite similar and the differences among the samples were small. The positions of the pigskin samples were relatively scattered, suggesting that the volatile fingerprint characteristics among the pigskin samples varied significantly. Furthermore, the interaction between chemical agents and the skin matrix varies significantly according to the hide’s initial density, fiber weave tightness, and lipid content during pre-tanning operations, and different volatile profiles can be modulated based on the same raw material. By marking the signal peaks that contributed significantly to PC1, it can be found that except for Ethyl Acetate-monomer, 3-penten-2-one, 2-hexanone, alpha-thujene, and Diethyl acetal which contribute to cowhide, the others all contribute to pigskin and sheepskin.
3.3. Construction of Clustering Model and Elimination of Abnormal Samples
Hierarchical clustering and K-means clustering analysis were further employed to identify distinct leather categories. All leather samples were subjected to hierarchical clustering analysis, and the results were presented in the form of a heatmap (Figure 6). It can be observed that the samples were mainly clustered into two groups: one group consisted entirely of cowhide samples, and the other group included one cowhide sample (CWN) and all the sheepskin and pigskin samples. A set of compounds was identified as the key differentiators between cowhide sample CWN and other specimens, including Ethylcyclopentane, Methyl pentyl ether-dimer, Propane-2,2-dimethyl-, Methyl butanoate, 1-methylethyl acetate, Tetrahydrofuran, Ethyl propanoate, Fluorotrichloromethane-dimer, E-3-hexene, and Z-2-heptene. Additionally, the PBPG sample from the pigskin was significantly different from the other leather samples and could be excluded as an outlier in subsequent analyses.
The optimal number of clusters (k) in K-means clustering analysis was determined using WSS and the silhouette method. WSS is the sum of the squared distances from each sample point to the cluster center [21,22]. Generally, as the number of clusters (cluster centers) increases, the within-cluster sum of squares decreases gradually until it reaches a turning point, after which the rate of decrease slows down. This turning point is usually the optimal number of clusters [19]. The silhouette method assesses the ratio of intra-cluster similarity to inter-cluster similarity [20]. Generally, as the number of clusters (cluster centers) increases, intra-cluster similarity increases gradually and inter-cluster similarity decreases gradually, so the silhouette coefficient increases gradually until it reaches a turning point, after which the rate of increase slows down. This turning point is usually the optimal number of clusters [20]. Therefore, the k value should be the one with a smaller within-cluster sum of squares and a larger average silhouette coefficient. Based on the results of the odor profile score calculation, it was found that the within-cluster sum of squares continued to decrease with the increase of k, and a turning point occurred at k = 2 (Figure 7a), while the average silhouette coefficient reached its maximum at k = 2 (Figure 7b). This indicates that the leather can be clustered into two groups based on the volatile fingerprint characteristics. Therefore, k = 2 was chosen for K-means clustering, and the clustering results were presented in the score plot of principal component analysis (Figure 8). It can also be observed that the cowhide samples were clustered into one group, and the sheepskin and pigskin samples were clustered into another group. Among them, the PBPG sample from the pigskin was located far away from the other leather samples in the figure, confirming that PBPG could be excluded as an outlier.
3.4. Construction of Discriminative Model and Screening of Key Signal Peaks
PLS-DA is a supervised classification method that employs a projection-based approach for dimensionality reduction. It is commonly used to build predictive models and visualize the distribution and trends among different sample groups [16]. All samples were subjected to PLS-DA analysis based on leather types after excluding PBPG (Figure 9). The GC-IMS signal peak intensities of all samples were automatically scaled for analysis. Through five-fold internal cross-validation [13], it was found that the first 7 latent variables made significant contributions to the model, so the model was established using the first 7 latent variables (Figure 9a). The goodness-of-fit value (R^2^) of the model constructed by the first 7 latent variables was 0.9836, and the predictive ability parameter (Q^2^) was 0.9040, which was greater than 0.4, indicating that the model was predictive [23]. The robustness of the PLS-DA model was demonstrated through permutation tests (Figure 9b). The score distribution of the three types of leather samples was analyzed using the first 2 latent variables (accounting for 39.1% of the cumulative variance) (Figure 9c). It was found that the cowhide samples could be distinguished from the other two types of samples, but there was some overlap between the pigskin and sheepskin samples. The projection importance variable (VIP) values of each signal peak were calculated to identify those signal peaks that made significant contributions to the discrimination of the three types of leather. A VIP value greater than 1.5 is usually considered an indicator of extremely important variables [24]. In this model, 12 signal peaks had VIP values greater than 1.5 (Figure 9d), indicating their significant contributions to the discrimination of the three types of leather. The above 12 signal peaks were marked on the score plot (Figure 9e). It was found that 7 signal peaks (2-hexanone, alpha-thujene, Butyl acetate, 3-methyl-2-butanol, 2-Heptanone, Hexyl methyl ether-monomer, Diethyl disulfide) mainly contributed to cowhide leather, while the remaining 5 signal peaks (2-methyl propanol, Isobutyl acetate, 2-pentyl acetate, 3-penten-2-one, 2,5-dimethylfuran) contributed to sheepskin and pigskin samples. The differences in volatile organic compound (VOC) profiles among various leathers can be fundamentally attributed to the combined effects of biological characteristics. Genetic factors determine fundamental differences in skin composition and structure. These include variations in collagen cross-linking patterns, keratin types, lipid composition (particularly in subcutaneous fat deposits), and the distribution and secretory activity of sweat and sebaceous glands. For instance, sheepskin’s characteristic lanolin content generates distinct esters and aldehydes upon degradation, while pigskin’s unique follicle structure and dense sweat glands may produce more sulfur- or nitrogen-containing volatile metabolites.
OPLS-DA is an enhanced multivariate statistical approach specifically designed for binary classification problems and data noise reduction. Its core principle involves decomposing data into predictive variation (associated with class prediction) and orthogonal variation (unrelated to class labels) through Orthogonal Signal Correction (OSC), thereby enhancing model interpretability and robustness [25,26]. To further distinguish the sheepskin and pigskin samples, OPLS-DA was employed for the analysis. An OPLS-DA model was established based on one predictive variable and two orthogonal variables, with the model R^2^ being 0.612 and Q^2^ being 0.525 based on the predictive variable. The robustness of the OPLS-DA model was demonstrated through permutation tests (Figure 10a). According to the score plot (Figure 10b), it can be observed that the sheepskin and pigskin samples can be differentiated based on the predictive variable. Among them, there are 16 signal peaks (VIP > 1.5) that have significant contributions to the predictive variable (Figure 10c). Ethyl isobutanoate-dimer, Pentyl acetate-dimer, 3-methyl-2-butanol, 2-pentanone, 2-methylbutanol-dimer, 3-methyl-1-butanol, 2,5-dimethylfuran, Propan-2-ol, Ethanol-dimer, and alpha-thujene contributed more in the sheepskin samples, while Butan-2-one, Pentanal-dimer, 1-pentanal-monomer, Ethyl vinyl ether, Z-2-heptene, and Butyronitrile contributed more in the pigskin samples. And alpha-thujene, 3-methyl-2-butanol, and 2,5-dimethylfuran not only had significant contributions to the differentiation of the three types of leather but also to the distinction between sheepskin and pigskin samples. Therefore, they can be regarded as key signal peaks for differentiating various types of leather.
4. Conclusions
These inherent biochemical constituents form unique “species fingerprints” in VOC profiles. Based on the comprehensive GC-IMS analysis of volatile fingerprints combined with multivariate statistical methods (PCA, HCA, K-means, PLS-DA, OPLS-DA), the three leather types exhibited distinct profiles enabling clear differentiation. Cowhide displayed unique volatile characteristics, significantly differing from both sheepskin and pigskin, as evidenced by its separation in analyses and the exclusive presence of compounds like Hexyl methyl ether-monomer, 3-methyl-2-butanol, and Diacetyl-dimer. Conversely, sheepskin and pigskin showed substantial similarity, forming a distinct cluster separate from cowhide; compounds such as Dimethyl disulphide-monomer, 2-pentyl acetate, and 1-bromobutane were exclusively shared by these two. PLS-DA further confirmed this distinction, identifying key markers like 2-hexanone, alpha-thujene, and Diethyl disulfide as contributing to cowhide, and others like 2-pentyl acetate and 2,5-dimethylfuran as contributing to sheepskin/pigskin. OPLS-DA successfully differentiated the similar sheepskin and pigskin, revealing specific markers for each (e.g., Ethyl isobutanoate-dimer for sheepskin; Butan-2-one, Pentanal-dimer for pigskin). Crucially, alpha-thujene, 3-methyl-2-butanol, and 2,5-dimethylfuran emerged as universal key markers, significantly contributing to the discrimination of all three leather types. The robust statistical models (R^2^ = 0.9836, Q^2^ = 0.9040 ˃ 0.4 for PLS-DA) validated the approach, confirming GC-IMS volatile fingerprinting as a powerful tool for leather type authentication. Nevertheless, this study has several limitations. For instance, the relatively small sample sizes of sheepskin and pigskin may affect the further validation of the model’s stability and predictive performance. Additionally, GC-IMS is restricted to detecting volatile small-molecule compounds, thereby potentially overlooking diagnostic differences that may exist in non-volatile compounds among different leather types. In future work, expanding the sample set to include a greater number and diversity of leather specimens, as well as incorporating complementary techniques such as GC-MS, would help enhance the robustness and broader applicability of the findings.
The reference list from the paper itself. Each links out to its DOI / PubMed record.
- 1Zhao B. Qian Y. Qian X. Fan J. Liu F. Duo Y. Preparation and Properties of Split Microfiber Synthetic Leather J. Eng. Fibers Fabr.201813152110.1177/155892501801300203 · doi ↗
- 2Adem M. Production of hide and skin in Ethiopia; marketing opportunities and constraints: A review paper Cogent Food Agric.20195156507810.1080/23311932.2019.1565078 · doi ↗
- 3Wang H. Advantages of animal leather over alternatives and its medical applications Eur. Polym. J.202421411315310.1016/j.eurpolymj.2024.113153 · doi ↗
- 4Braz C.E.M. Jacinto M.A.C. Pereira E.R. Souza G.B. Nogueira A.R.A. Potential of near-infrared spectroscopy for quality evaluation of cattle leather Spectrochim. Acta Part A-Mol. Biomol. Spectrosc.201820218218610.1016/j.saa.2018.05.02529783149 · doi ↗ · pubmed ↗
- 5Catauro M. Guadagno L. D’Angelo A. Raimondo M. Zarrelli M. Piccirillo A. Use of Spectroscopic, Mechanical, and Microbiological Analysis to Study a Natural Sheep Leather Proceedings of the 6th International Conference on Design and Technologies for Polymeric and Composites Products (POLCOM)Bucharest, Romania 23–26 November 2022
- 6Choi Y.H. Lee K.H. Ethical Consumers’ Awareness of Vegan Materials: Focused on Fake Fur and Fake Leather Sustainability 20211343610.3390/su 13010436 · doi ↗
- 7Zhou Q. Feng X. Zhu Y. Zhou C. Chen P. Zhao S. Zhou Q. Chen M. Li D. Liu L. Discriminative analysis of aroma profiles in diverse cigar products varieties through integrated sensory evaluation, GC-IMS and E-nose J. Chromatogr. A 2024173346524110.1016/j.chroma.2024.46524139153428 · doi ↗ · pubmed ↗
- 8Chen M. Zhou D.L. Chen Y. Zhu P.X. Analyses of structures for a synthetic leather made of polyurethane and microfiber J. Appl. Polym. Sci.200710390390810.1002/app.25233 · doi ↗