A Study of Absolute Pressure Inside the Cabins of Land Transport Vehicles—The Concept of a Ventilation System Regulating the Pressure in the Vehicle
Tomasz Janusz Teleszewski, Katarzyna Gładyszewska-Fiedoruk

TL;DR
This study shows that pressure changes in vehicles during travel can affect human comfort and health, suggesting the need for pressure regulation systems.
Contribution
The paper introduces a ventilation system concept to regulate cabin pressure in land transport vehicles.
Findings
Absolute pressure fluctuations in vehicles are most significant in mountainous terrain.
Pressure changes exceeding 8 hPa in 24 hours can negatively impact the nervous system.
A simplified model for predicting cabin pressure based on altitude was developed.
Abstract
What are the main findings? Significant differences in absolute pressure occur during land travel (car, bus, train).A pressure change of 8 hPa within a 24 h period constitutes an unfavorable mechanical stimulus for the human body and causes changes in the excitability of the nervous system. Significant differences in absolute pressure occur during land travel (car, bus, train). A pressure change of 8 hPa within a 24 h period constitutes an unfavorable mechanical stimulus for the human body and causes changes in the excitability of the nervous system. What are the implications of the main findings? Changes in absolute pressure undoubtedly cause changes in comfort and affect the human body; therefore, absolute pressure should be taken into account in assessing thermal comfort.It is worth implementing a pressure stabilization system in vehicles. Changes in absolute pressure undoubtedly…
Genes, proteins, chemicals, diseases, species, mutations and cell lines named across the full text — each resolved to its canonical identifier and authoritative record.
Click any figure to enlarge with its caption.
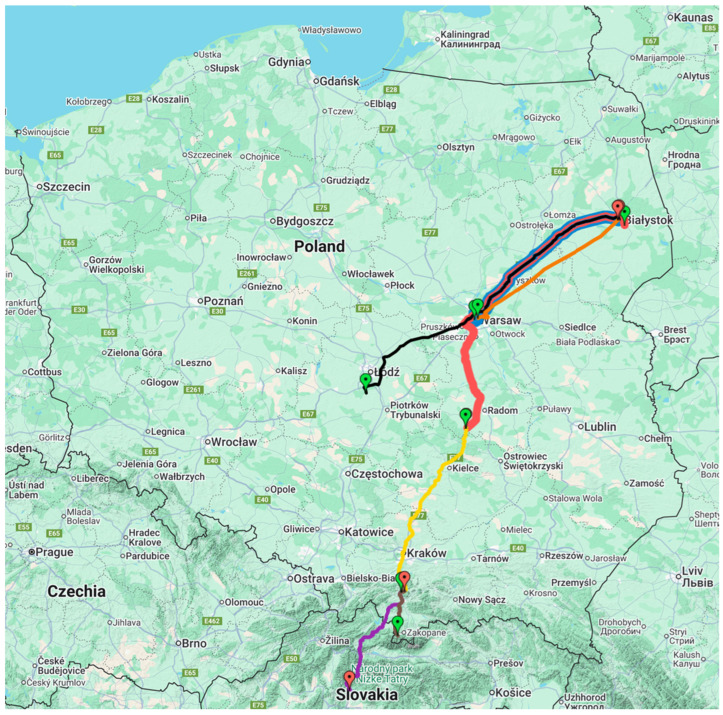 Figure 1
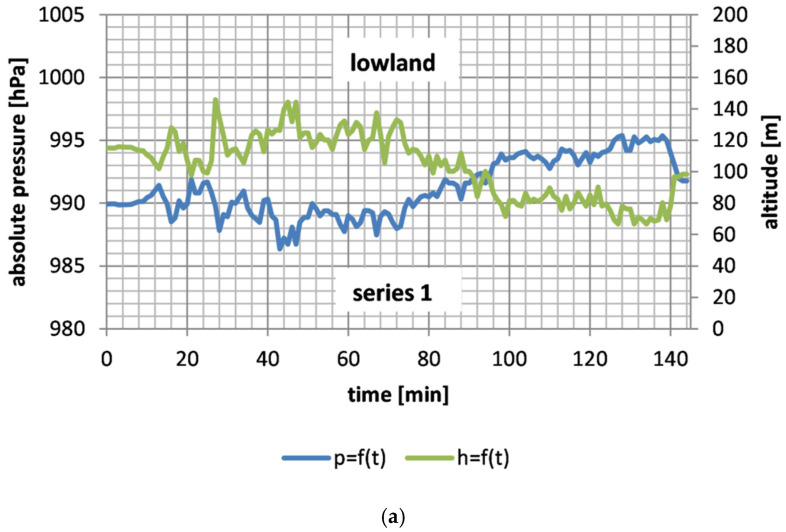 Figure 2
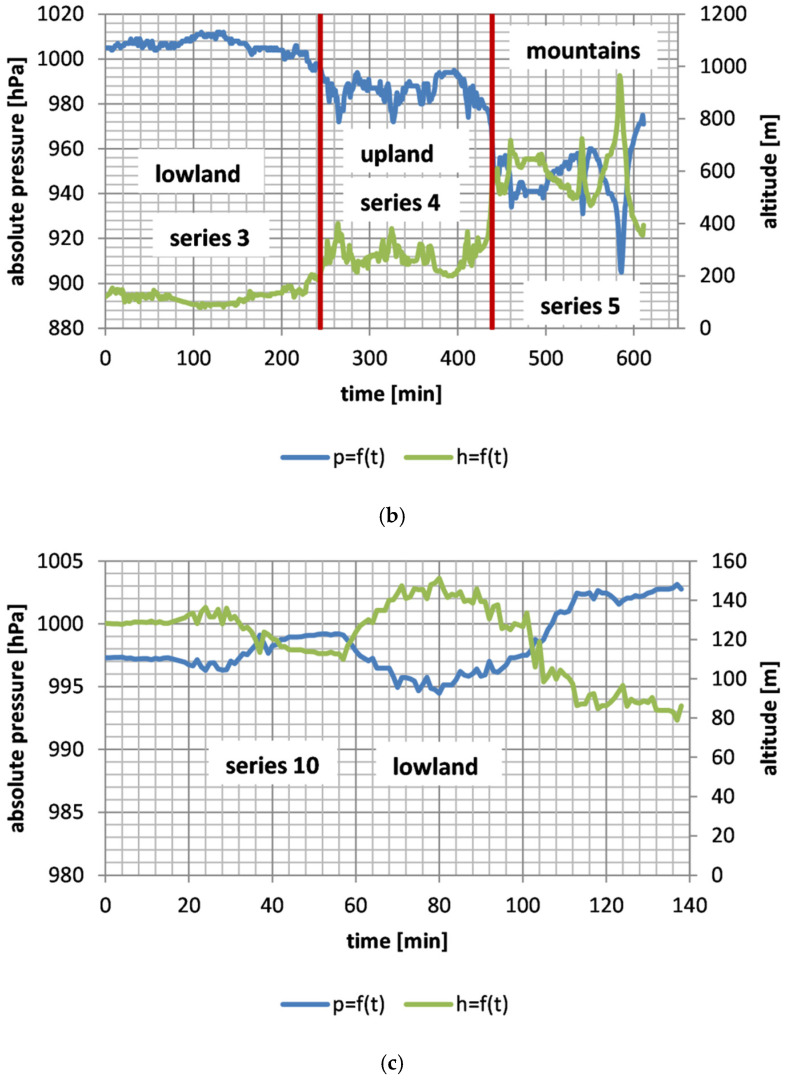 Figure 3
 Figure 4
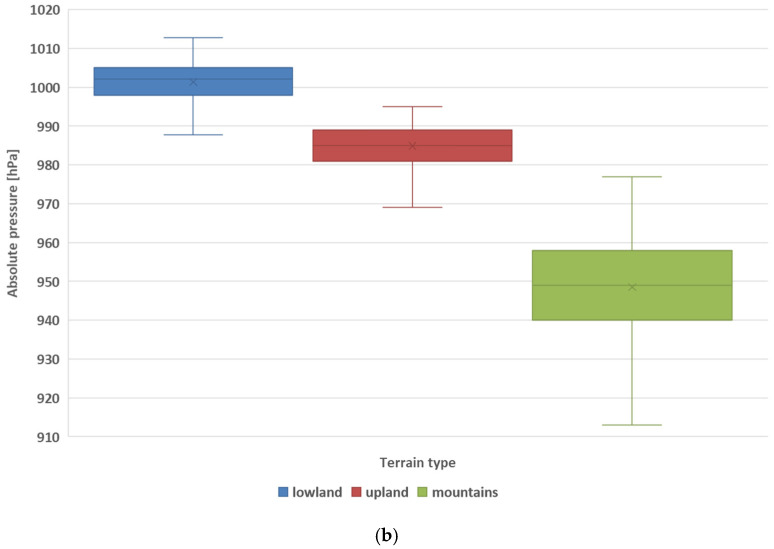 Figure 5
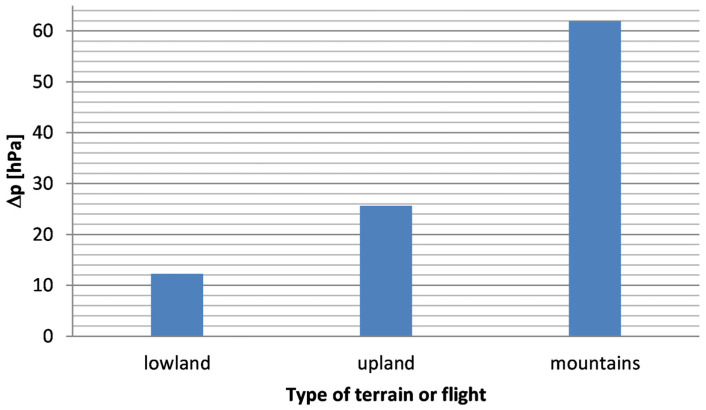 Figure 6
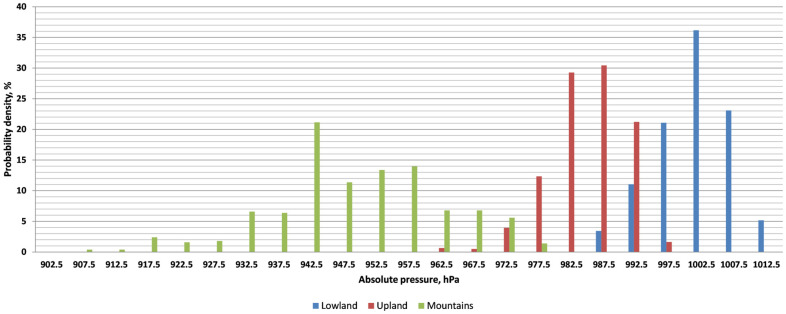 Figure 7
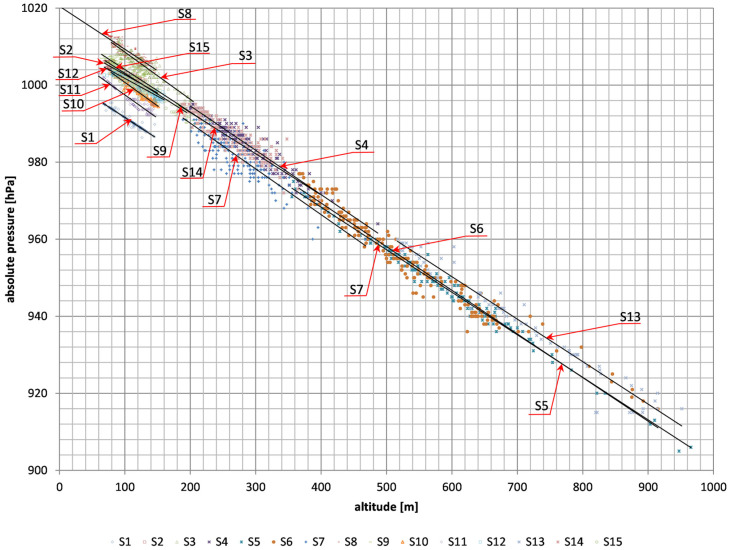 Figure 8
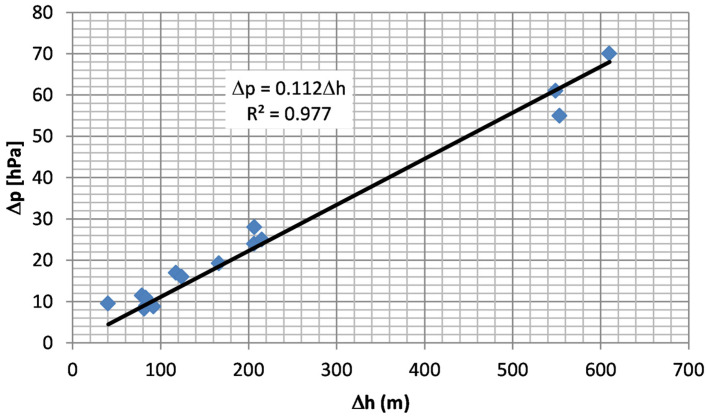 Figure 9
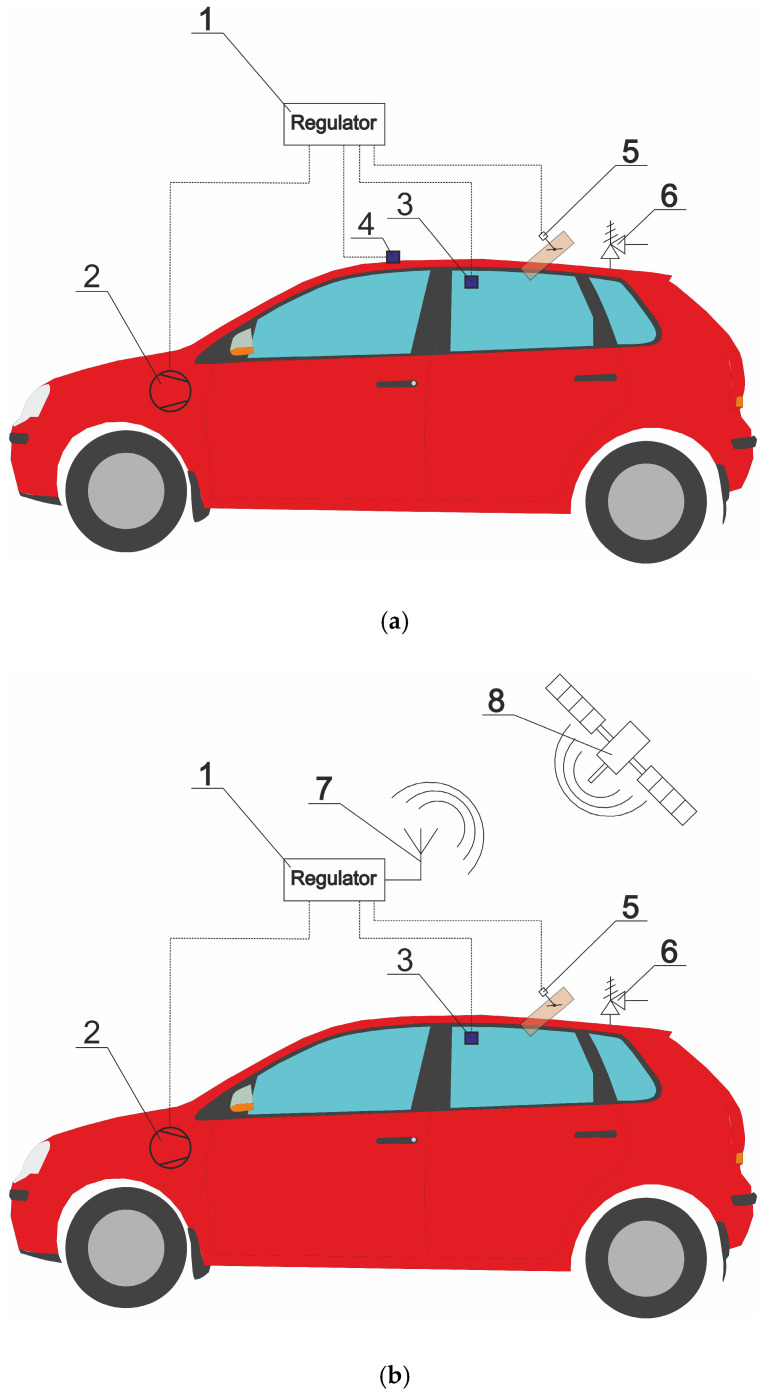 Figure 10
- —Ministry of Science and Higher Education
- —Institute of Environmental Engineering, Warsaw University of Life Sciences (SGGW)
Peer Reviews
No public reviews on file for this paper yet. If you reviewed it on a platform where reviews are public (OpenReview, ICLR, NeurIPS, ICML), you can paste yours below so the community can read it here.
Videos
No videos yet. Explain this paper in a talk, walkthrough, or lecture? Add one.
Taxonomy
TopicsAerodynamics and Fluid Dynamics Research · Thermoregulation and physiological responses · Refrigeration and Air Conditioning Technologies
1. Introduction
The study and analysis of indoor microclimate parameters include issues related to the measurement of pollutants and monitoring of thermal comfort parameters [1,2], the design of measuring devices [3,4] and the regulation of ventilation systems [5]. One of the important microclimate parameters in rooms occupied by people is absolute pressure.
Absolute ambient pressure in rooms occupied by people affects well-being and health [6,7,8,9,10,11]. Publication [6] examined the effect of short-term weather parameters on knee joint pain. An increase in barometric pressure causes increased pain in patients with knee osteoarthritis. The relationship between blood pressure and atmospheric pressure in temperate climates at different times of the year was determined in [7]. The greatest effect of atmospheric pressure on blood pressure in temperate climates was observed during winter and spring [7].
Article [8] presented the results of research on the effect of atmospheric pressure on heart attacks and coronary heart disease. The lowest incidence of heart attacks occurred at an atmospheric pressure of 1016 mbar, while the highest incidence occurred at minimum and maximum values of atmospheric pressure [8].
Based on registered deaths between 2003 and 2011 in Guangzhou, China [9], a significant effect of minimum atmospheric pressure on the increase in mortality from cardiovascular causes was observed. Based on a study [10] of 250 patients with arterial hypertension aged 65–92, it was noted that the greatest complications occur at low pressures. Another health problem associated with pressure changes is non-epileptic seizures [11]. In the United States [11], a significant association was noted between atmospheric pressure and the occurrence of non-epileptic seizures. The increase in epileptic seizures by 31.8% and 11.1% occurred for atmospheric pressure that was lower or higher than the level generally considered comfortable (1013 hPa), respectively.
The pressure value in rooms where people stay depends primarily on the type of ventilation system [12,13,14,15] and the way the rooms are used [16,17]. In [18], it was concluded that the environmental pressure should be taken into account in the thermal comfort index in relation to the design of ventilation systems.
The popular indicator used to assess thermal comfort in enclosed spaces, PMV (Predicted Mean Vote) in ASHRAE-55 [19] and ISO7730 [20], is determined without taking into account the influence of atmospheric pressure. Atmospheric pressure is only included in psychrometric calculations. Atmospheric pressure has a direct impact on metabolic rate [18]. In car cabins, temperature, humidity, and carbon dioxide concentration are taken into account when assessing optimal air parameters [21].
The literature [22,23,24] provides general guidelines on the impact of atmospheric pressure differences over a given period on human health. Fluctuations in atmospheric pressure can significantly impact human health [22,25]. Optimal atmospheric pressure values for human health are 1013 hPa [11,26] and 1016 hPa [8].
In means of transport, the most common measurements were temperature [27,28], humidity [29,30], and carbon dioxide [31,32]. No pressure measurements were found in land passenger transport vehicles in the literature.
The aim of the work was to analyze the absolute pressure in selected types of land passenger transport vehicles: passenger cars, buses and trains, and to develop a concept of ventilation regulating the pressure in the passenger vehicle cabin with a simplified calculation model for determining the absolute pressure value as a function of altitude above sea level.
The following chapters present the remaining content of this article. Section 2 describes in detail the methodology for measuring absolute pressure, altitude above sea level, and vehicle travel routes. Section 3 presents the results and their discussion. A simplified model of absolute pressure in passenger vehicle cabins was constructed (Section 4). Additionally, a scheme for regulating and stabilizing pressure in a passenger car cabin was proposed. Section 5 contains the conclusions of this work.
2. Materials and Methods
Absolute pressure measurements were performed in a passenger car, bus and train. In the overland studies, the bus and train routes passed through lowlands, while the passenger car route passed through lowlands, uplands, and mountains. Lowlands are most often defined as areas below 200 m above sea level [33], uplands encompass altitudes ranging from 200 m to 300 m above sea level [34], and mountains can be located from 300 m above sea level, depending on the class [35].
Table 1 presents the basic parameters of the 16 measurement series: measurement series number, beginning and end of the travel route, measurement date, vehicle type, travel duration, terrain type, and the name of the geographical region through which the route passed. Figure 1 show the travel routes on maps [36] (series no. 1–15). Passenger transport routes ran through lowlands (series 1–3 and series 8–12, 15), through uplands (measurement series 4, 7, 14) and mountains (series 5–6, 13).
A Testo data logger with an accuracy of ±3 hPa and a resolution of 0.1 hPa was used to measure absolute pressure. Prior to testing, the sensors were calibrated by an external calibration laboratory. To determine the exact measurement uncertainty of the Testo instrument, the absolute pressure measurement results of the Testo probe were compared with a mercury barometer with an accuracy of ±0.2 mm of mercury (0.27 hPa). The measurement uncertainty of the Testo probe was determined using the following formulas [37]:
where p_w_ is the atmospheric pressure value obtained from the mercury barometer, is the arithmetic mean of the Testo atmospheric pressure measurements for 30 readings, and σ_run_ is the standard deviation of the 30 readings.
The accuracy of the Testo probe determined according to formulas (1)–(3) was 1.1 hPa, while the relative error of the Testo probe determined as the difference in absolute pressure read from the mercury barometer and the Testo recorder related to the absolute pressure from the mercury barometer was 0.18%.
Altitudes above sea level were recorded using a Holux data logger with a horizontal accuracy of <2.2 m and a vertical accuracy of <5 m with a GPS (Global Positioning System) synchronization time of 0.1 ms.
3. Results and Discussion
Table 2 presents the minimum (h_min_), maximum (h_max_), mean (h_avg_) and standard deviation (σh) values of altitude above sea level, as well as the minimum (p_min_), maximum (p_max_), mean (p_avg_) and standard deviation (σp) values of absolute pressure for 15 measurement series. Additionally, Table 2 presents the differences in altitude above sea level between the maximum and minimum values (Δh = h_max_ − h_min_) and the differences in absolute pressure between the maximum and minimum values (Δp = p_max_ − p_min_). Figure 2a–c present changes in altitude above sea level and absolute pressure as a function of time, for example, measurement series of land transport (series 1, 3, 4, 5 and 10, respectively).
The absolute pressure values in passenger car, bus and train cabins depended primarily on the altitude above sea level (Figure 2a–c), which is consistent with the classical theory [38]. With increasing height above sea level, the absolute pressure decreases, which is caused by the lower pressure of the air column at the measuring point [38]. The trends of absolute pressure changes during the passenger car, bus and train cabin are symmetrical to the trends of changes in altitude above sea level (Figure 2a–c), which indicates a small impact of ventilation operation on absolute pressure in these vehicles.
Figure 3a,b present box plots for altitude above sea level and absolute pressure in passenger vehicle cabins, respectively, for various terrain types. The lowest absolute pressure values occur in mountainous areas (Figure 3b), which is related to the higher altitude above sea level in the mountains (Figure 3a) compared to other landforms. The greatest fluctuations in absolute pressure occur in the mountains (Figure 3b), which is caused by significant changes in altitude above sea level in these areas (Figure 3a). Special attention should be paid to safety when driving in mountainous terrain, taking into account the impact of significant changes in absolute pressure on the driver and passengers.
Figure 4 presents the average maximum absolute pressure differences inside passenger transport vehicles during travel for lowland areas (series 1–3, 8–12, 15), uplands (series 4, 7, 14) and mountains (series 5–6, 13) The largest pressure differences in land transport occur in mountainous areas and highlands, while the smallest absolute pressure differences occur in lowland areas. In the case of travel through the mountains, the average value of absolute pressure differences (series 5–6, 13) is as much as 5.1 times greater than the average value of absolute pressure differences for land transport through the lowlands (series 1–3, 8–12, 15). A pressure change of 8 hPa within a 24 h period constitutes an unfavorable mechanical stimulus for the human body and causes changes in the excitability of the nervous system [22]. In all measurement series, absolute pressure fluctuations exceeded 8 hPa. Daily fluctuations in atmospheric pressure above 5.5 hPa may contribute to an increased number of epileptic events for people who are susceptible to these diseases [25].
Sudden and significant changes in atmospheric pressure cause compression and expansion of air in the middle ear, which may cause discomfort in hearing [21,22]. Boksha and Boguckij [23] developed a scale of sensations of atmospheric pressure changes depending on the absolute pressure difference. The scale of sensations [21,22] is based on the following pressure difference ranges: within the range up to 4.0 hPa, weak changes in sensations due to pressure are assumed, then for the Δp range from 4.1 hPa to 8.0 hPa, moderate changes, for the Δp range from 4.1 hPa to 8.0 hPa, moderate changes, for the Δp range from 8.1 hPa to 12.0 hPa, strong changes, and for the Δp range above 12.0 hPa, very strong changes. Taking into account the above scale of changes in sensations due to differences in atmospheric pressure, it can be stated that in the case of lowlands there is a full range of sensations, while in the case of highlands and mountains there are very strong sensations.
Based on the absolute pressure measurements for the series, a histogram of the frequency of absolute pressure intervals was plotted (Figure 5) for journeys through lowlands, uplands, and mountains. The frequency distribution of a given absolute pressure was determined by summing the number of one-minute absolute pressure measurements in a given pressure interval [p_i_, p_i_+1):
where n_i_—number of measurements from a given interval [p_i_, p_i_+1), and N is the number of all measurements in a given period.
Absolute pressures were divided into 5 hPa numerical intervals with range boundaries ranging from 900 to 905 hPa to 1010–1015 hPa. Figure 5 shows the middle values of the adopted ranges on the horizontal axis, while the vertical axis shows the frequency of a given pressure, expressed as a percentage. In the lowlands, the highest probability of 36.2% occurs for the pressure range [1000 Pa, 1005 Pa]. In the uplands, the pressure ranges [980 Pa, 985 Pa) and [985 Pa, 990 Pa) occurred most frequently, with probabilities of 29.3% and 30.4%, respectively. In the mountains, the dominant pressure range was [940 Pa, 945 Pa) with a probability of 21.2%. The optimal pressure range [1010 Pa, 1015 Pa) [8,11,26] appears with a probability of 5.2% when traveling through lowlands.
Analyzing the data from [8], it can be concluded that the lowest probability of myocardial infarction may occur in lowland areas. A low drop in atmospheric pressure below 1013 hPa, associated with blood pressure, is associated with a greater number of cardiovascular and cerebral complications [10]. On the other hand, the highest mortality [9] occurs at extremely high atmospheric pressures above 1020 hPa, although such high absolute pressures were not recorded in this study. Pressure lower than comfort pressure (1013 kPa) may also cause epileptic seizures [11] in people treated for these conditions.
4. Simplified Model of Absolute Pressure as a Function of Altitude
Figure 6 shows the dependencies of absolute pressure inside the passenger car, bus and train cabin on altitude above sea level for measurement series 1–15. For low altitudes up to 1500 m, the change in absolute pressure as a function of altitude can be described by a simplified relationship in which the pressure drops by approximately 11 hPa for each 100 m increase in altitude at a pressure above sea level of 1013.2 hPa [39].
Based on the measurements of absolute pressure and altitude above sea level, a model based on linear regression was determined:
where the coefficient a is the change in the absolute pressure value in hPa per 1 m of height, while the coefficient b is the equivalent of the absolute pressure above sea level.
The coefficients a and b depend on local conditions related to air parameters and the operation of ventilation systems in means of transport. The coefficients a and b are presented in Table 2. In the case of land transport, the average value of the coefficient a from 15 measurement series is 0.112 hPa, while the average value of the coefficient b is 1013.6 hPa, and these values are close to the value of the absolute pressure of outside air [39].
Figure 7 shows the dependence of extreme differences between the maximum (p_max_) and minimum (p_min_) absolute pressure on the extreme differences in height above sea level (h_max_ − h_min_) for measurement series no. 1–15 (Table 2). Based on the determined linear regression (Figure 6), it can be concluded that a 1 m height change generates a pressure change of 0.112 hPa, which is also similar to the outdoor air parameters [39].
Due to the fact that absolute pressure fluctuations affect human comfort, well-being and health [8,11,22,23,24], it is worth implementing a pressure stabilization system in vehicles. Figure 8a,b show proposed pressure regulation schemes for a passenger car cabin. The regulator (1) should be set to the desired pressure inside the car cabin. The recommended pressure value is 1013 hPa, which is optimal for oxygen saturation and proper functioning of the human body [8,11,26]. The pressure inside the cabin is read using a pressure sensor (3), which can be placed on the car’s ceiling. An air compressor (2) with the function of generating both overpressure and underpressure, and a control valve (5), maintain the appropriate pressure inside the cabin. In a combustion engine vehicle, a compressor driven by a V-belt can be used, while in an electric vehicle, a compressor driven by an electric motor can be used.
Pressure regulation can be implemented in two variants. In the first variant (Figure 8a), the pressure inside the cabin is set as a constant value on the controller (1) and is maintained regardless of the vehicle’s altitude above sea level. To adjust the compressor’s output (2), it is also necessary to measure the pressure outside the vehicle using an external pressure sensor (3). Regulating the pressure inside the cabin using the compressor (2) can be achieved, for example, by changing the compressor rotor speed as a function of the pressure difference between sensors (3) and (4), which is an energy-saving solution. Reducing excess pressure can be achieved by opening the pressure relief valve (5). The cabin pressure regulation system is protected by a safety valve (6), which prevents excessively low or high pressure inside the vehicle in the event of a system failure.
In the second variant (Figure 8b), cabin pressure regulation can be supported by a planned route in the navigation system connected to the controller (1), which connects via an antenna (7) to a satellite (8) to read GPS points. Based on the planned route and current GPS altitude readings, pressure changes due to changes in terrain elevation can be predicted. In the second variant, the external pressure is determined from Equation (5) based on altitude above sea level. The presented solution for stabilizing pressure in a passenger car cabin (Figure 8a,b) can also be used in buses and trains. Control of the operation of the ventilation system with pressure regulation can be implemented within the Internet of Things (IoT) [40].
Limitations and Future Research
Absolute pressure is most often overlooked in studies on thermal comfort and air quality in occupied spaces, which is why this topic requires more extensive research. In addition to altitude, external weather conditions, vehicle cabin ventilation, and vehicle operation also influence absolute pressure in land transport cabins. A broader understanding of changes in absolute pressure in vehicle cabins requires additional research. The main limitations of this publication, which will also serve as the basis for further research and analysis, are presented below:
- This publication proposes a preliminary pressure regulation scheme in a vehicle without selecting individual devices. Further research is planned to involve building a prototype of a ventilation system with pressure regulation inside the car and carrying out tests.
- The rate of pressure change in the vehicle cabin was not analyzed, which would be necessary to propose a detailed procedure for regulating and monitoring changes in absolute pressure inside and outside the vehicle. Analyzing pressure rate changes requires the use of shorter time intervals; therefore, this topic will be explored in subsequent studies.
- Including atmospheric pressure in the PMV (Predicted Mean Vote) thermal comfort index primarily requires survey research, which will be conducted in subsequent studies.
- The external air parameters during driving and the impact of changing atmospheric conditions on the absolute pressure inside the vehicle were not analyzed.
- The paper also does not analyze vehicle operating conditions such as constant or variable vehicle speed, the impact of window and door opening on absolute pressure in the vehicle cabin, or the impact of ventilation type and operation on absolute pressure in the vehicle cabin.
5. Conclusions
Significant differences in absolute pressure occur during land travel (car, bus, train). In the case of land transport, absolute pressure depends primarily on altitude. The largest fluctuations in absolute pressure for land transport were recorded in the mountains and highlands, while the smallest fluctuations were recorded in the lowlands. The obtained results confirm the close dependence of absolute pressure on height above sea level, which is approximately 0.11 hPa/m for land transport. Changes in absolute pressure undoubtedly cause changes in comfort and affect the human body; therefore, absolute pressure should be taken into account in assessing thermal comfort, just as it is with temperature and humidity. A way to reduce absolute pressure is to use a ventilation system to maintain a constant pressure inside the passenger vehicle cabin.
Practical implications:
- The obtained results may find application in the design of HVAC and ventilation systems in passenger cars, enabling the regulation of cabin pressure, as well as temperature and humidity control.
- The simplified pressure model proposed in this study can support the prediction of pressure variations along different routes and assist in adaptive control of cabin climate systems.
- The proposed pressure control system based on a pressure sensor, compressor and GPS data can be used to stabilize pressure in land transport vehicles, improving passenger comfort, especially in areas with significant height differences above sea level.
- The findings may contribute to the development of comfort assessment standards (such as ASHRAE 55 or ISO 7730) by including absolute pressure as a factor influencing human well-being.
- The results can also be used in transport planning and personnel training, particularly for managing the comfort of passengers sensitive to pressure fluctuations (e.g., elderly individuals or those with cardiovascular diseases).
The reference list from the paper itself. Each links out to its DOI / PubMed record.
- 1Yu Y. Gola M. Settimo G. Capolongo S. Can the Building Make a Difference to User’s Health in Indoor Environments? The Influence of PM 2.5 Vertical Distribution on the IAQ of a Student House over Two Periods in Milan in 2024 Atmosphere 20251693610.3390/atmos 16080936 · doi ↗
- 2Ogundiran J. Nyembwe J.-P.K.B. Ogundiran J.O. Santos R.A.d.S. Pereira L.D. Gameiro da Silva M. 3Sq Air Project: A Living Lab Towards Sustainable Smart Strategy for Indoor Climate Quality Assurance in Classrooms Atmosphere 20251658410.3390/atmos 16050584 · doi ↗
- 3Hernandez W. Cañas N. Sensing Classroom Temperature, Relative Humidity, Illuminance, CO 2, and Noise: An Integral Solution Based on an Io T Device for Dense Deployments Sensors 202424512910.3390/s 2416512939204826 PMC 11360498 · doi ↗ · pubmed ↗
- 4Fissore V.I. Arcamone G. Astolfi A. Barbaro A. Carullo A. Chiavassa P. Clerico M. Fantucci S. Fiori F. Gallione D. Multi-Sensor Device for Traceable Monitoring of Indoor Environmental Quality Sensors 202424289310.3390/s 2409289338732999 PMC 11086227 · doi ↗ · pubmed ↗
- 5Qassim A.B. Hashim S.M. Aboud W.S. Design and Implementation of a Cascade Control System for a Variable Air Volume in Operating Rooms Based on Pressure and Temperature Feedback Sensors 202525565610.3390/s 2518565641012895 PMC 12473823 · doi ↗ · pubmed ↗
- 6Mc Alindon T. Formica M. Schmid C.H. Fletcher J. Changes in Barometric Pressure and Ambient Temperature Influence Osteoarthritis Pain Am. J. Med.200712042943410.1016/j.amjmed.2006.07.03617466654 · doi ↗ · pubmed ↗
- 7Kamiński M. Cieślik-Guerra U. Kotas R. Mazur P. Maranda W. Piotrowicz M. Sakowicz B. Napieralski A. Trzos E. Uznańska-Loch B. Evaluation of the Impact of Atmospheric Pressure in Different Seasons on Blood Pressure in Patients with Arterial Hypertension Int. J. Occup. Med. Environ. Health 20162978379210.13075/ijomeh.1896.0054627518887 · doi ↗ · pubmed ↗
- 8Danet S. Richard F. Montaye M. Beauchant S. Lemaire B. Graux C. Cottel D. Marécaux N. Amouyel P. Unhealthy Effects of Atmospheric Temperature and Pressure on the Occurrence of Myocardial Infarction and Coronary Deaths Circulation 1999100 e 1e 7.10.1161/01.CIR.100.1.e 110393689 · doi ↗ · pubmed ↗