Undervalued Contribution of OVOCs to Atmospheric Activity: A Case Study in Beijing
Kaitao Chen, Ziyan Chen, Fang Yang, Xingru Li, Fangkun Wu

TL;DR
This study highlights the significant role of oxygenated volatile organic compounds (OVOCs) like phenols in atmospheric reactivity and ozone formation in Beijing.
Contribution
The study re-evaluates the importance of OVOCs, particularly phenols, in atmospheric chemical processes and ozone formation.
Findings
Phenols contributed the most to total VOC concentration (38.87%) and had a dominant role in SOAFP and LOH reactivity.
Carbonyls were the largest contributors to the ozone formation potential (OFP) at 59.03%.
Solvent use and organic chemical production were identified as the primary sources of VOCs, accounting for 31.76% of emissions.
Abstract
VOCs are significant precursors for the formation of O3 and SOA, directly impacting human health. This study employs multiple approaches to analyzing atmospheric VOCs by focusing on OVOCs including aldehydes, ketones, and phenols, with a case study in Beijing, China. We analyzed the concentration levels and compositions of VOCs and their atmospheric activities, offering a new perspective on VOCs. This analysis was conducted through offline measurements of volatile phenols and carbonyl compounds, complemented by online VOC observations during the summer period of high O3 levels. The total atmospheric VOCs concentration was found to be 51.29 ± 10.01 ppbv, with phenols contributing the most (38.87 ± 11.57%), followed by carbonyls (34.91 ± 6.85%), and aromatics (2.70 ± 1.03%, each compound is assigned to only one category based on its primary functional group, with no double counting).…
Genes, proteins, chemicals, diseases, species, mutations and cell lines named across the full text — each resolved to its canonical identifier and authoritative record.
Click any figure to enlarge with its caption.
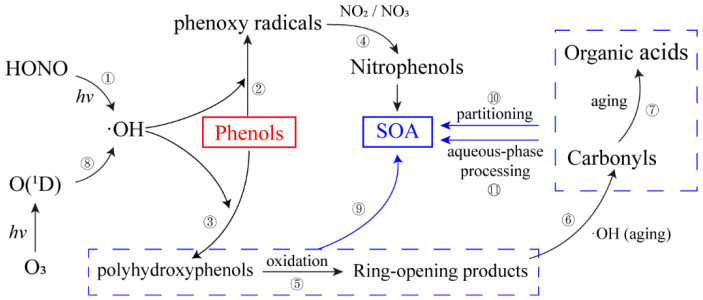 Figure 1
- —National Natural Science Foundation of China
Peer Reviews
No public reviews on file for this paper yet. If you reviewed it on a platform where reviews are public (OpenReview, ICLR, NeurIPS, ICML), you can paste yours below so the community can read it here.
Videos
No videos yet. Explain this paper in a talk, walkthrough, or lecture? Add one.
Taxonomy
TopicsAtmospheric chemistry and aerosols · Air Quality and Health Impacts · Indoor Air Quality and Microbial Exposure
1. Introduction
The acceleration of urbanization and industrialization has led to the emergence of severe ozone (O_3_) and haze pollution as a significant environmental concern in China’s urban atmosphere. This pollution is characterized by the co-existence of O_3_ and fine particulate matter (PM_2.5_), which presents a unique challenge for environmental management [1]. From January to July 2023, the average proportion of “good days” (daily AQI ≤ 100, GB 3095–2012 [2]) in the “2 + 26” cities of the Beijing–Tianjin–Hebei and surrounding regions was 56.6%, showing a year-on-year decline of 5.6%. The average proportion of days with heavy and above pollution was 4.8%, a year-on-year increase of 2.8%. The average concentration of PM_2.5_ was 43.18 ± 12.57 μg/m^3^, a year-on-year flat. The average concentration of O_3_ was 97.2 ± 57.68 ppbv, a year-on-year increase of 2.7% [3]. The data indicate an upward trajectory in O_3_ levels within the Beijing-Tianjin-Hebei region. Volatile Organic Compounds (VOCs) are important precursors of O_3_ and PM_2.5_ [4] as well as precursors of secondary organic aerosols [5]. VOCs are a ubiquitous environmental contaminant, encompassing a diverse array of chemical compounds, including hydrocarbons, oxygenated VOCs, and nitrogenous or sulfurous VOCs. These substances are volatile at room temperature and can enter the atmosphere through a number of pathways, including industrial emissions, transportation, and natural biological processes. VOCs not only have a direct impact on air quality, but also generate ozone and fine particulate matter through photochemical reactions, causing indirect harm to human health and ecosystems [6]. Since around 2017, the composition of atmospheric VOCs in urban areas of China has exhibited a clear shift, with oxygenated VOCs (OVOCs) increasingly replacing alkanes as the dominant chemical class. Consistent with this trend, OVOCs were identified as the predominant component of urban atmospheric VOCs, accounting for 23.76%, 52%, and 61.21% of the total VOC concentrations in Shijiazhuang (2017) [7], Lhasa (2021) [8], and Weihai (2022) [9], respectively. Conversely, alkanes constituted only approximately 20% of the total VOCs, a notable deviation from the findings of the preceding study, which indicated that alkanes were the primary component of VOCs [10,11,12].
However, research on OVOCs has predominantly focused on aldehydes, ketones, organic acids, alcohols, and ethers, while phenolic compounds have received comparatively less attention [13,14,15], and volatile phenols, which are also members of OVOCs, have been neglected for a long time [16]. This may be attributed to their intricate chemical structures, stronger photochemical activities, and technical constraints. Volatile phenols are a highly toxic industrial pollutant, primarily derived from paper, chemical wastewater, ammonia, and other industrial processes. It is also a type of aromatic compound, with a benzene ring that contains at least one hydroxyl group (·OH) [17]. The multiplicity of applications of phenols has resulted in their progressive accumulation in the environment, particularly in the atmosphere, water, and soil. Various higher concentrations of phenols were measured in sewage (up to 53 ppmv), ambient water (1.5100 ppbv), drinking water (unquantified), groundwater (1.910 ppbv), rainwater (0.0751.2 ppbv), sediment (>10 ppbv) and ambient air (0.0344 ppbv) [18].
Atmospheric monitoring and mechanism studies commonly report and/or target a broader suite of functionalized phenolics beyond phenol and cresol isomers, including higher alkyl-substituted phenols (e.g., dimethyl- and trimethylphenols), naphthols, and nitrated phenols (nitrophenols). This broader functional coverage is relevant because substitution patterns and nitration chemistry can alter both gas-phase reactivity and SOA formation pathways [19]. It can be observed that the concentration of volatile phenols exhibits considerable variation across different regions. Furthermore, the concentration of volatile phenols was found to be higher in urban areas than in rural areas. With regard to phenol, for instance, the observed concentrations in urban areas were as follows: 0.08 ppbv in Portland [20], 0.11 ppbv in Milan [21], and 0.03 ppbv in Santiago de Chile [22]. The concentration of phenol in a rural area of the UK was observed to range from 0~0.01 ppbv [23], a figure that is considerably lower than that recorded in urban areas. This perspective is corroborated by the findings of Delhomme et al. [24], which indicate that urban concentrations > suburban areas > rural settings.
Volatile phenols are plentiful in the atmosphere and originate from a multitude of sources, including biomass combustion [16,25], vehicle exhaust [26], and other anthropogenic activities [27]. In addition, phenolic species can be produced and further transformed through OH-initiated atmospheric oxidation, in which aromatic hydrocarbons form phenols as first-generation products and phenols/cresols are subsequently oxidized to dihydroxy benzenes such as catechol [28,29,30]. Among the aforementioned sources, combustion processes and vehicle exhaust emissions represent significant primary sources of phenols [31], while the chemical reactions of benzene, toluene, and other aromatic compounds in the presence of ·OH represent important secondary mechanisms for the generation of phenols [32].
In addition to the well-known hydrocarbons, aldehydes, and ketones, atmospheric phenolic compounds also play a pivotal role in urban air pollution events. These compounds can undergo photochemical reactions with ·OH, NO_3_ radicals (·NO_3_), and triplet excited carbonyls (^3^C*), which are formed via photosensitization following intersystem crossing of carbonyl-containing chromophores, to generate photo-oxidized products and secondary organic aerosols in the troposphere, with reported mass yields approaching 100% [16,17,25]. ^3^C* are now recognized as important non-radical oxidants in atmospheric multiphase chemistry, capable of initiating hydrogen atom transfer, electron transfer, and energy transfer reactions with phenolic compounds under actinic irradiation [33].
In the tropospheric gas phase, the dominant sink of phenolic VOCs is radical-initiated oxidation rather than direct ozonolysis. Daytime loss is typically governed by OH addition to the aromatic ring, while nighttime processing can be driven by NO_3_-initiated oxidation and nitration chemistry under NO_X_ [34,35,36]. Cl-atom reactions may be episodically important in chloride-influenced environments. Recommended rate coefficients for phenol and cresol isomers are on the order of 10^−11^–10^−10^ cm^3^ molecule^−1^ s^−1^ for OH, whereas NO_3_ reactions are generally slower but can be atmospherically consequential at night due to elevated [NO_3_] and efficient formation of nitrated products; these evaluated kinetics are available in community-recommended compilations (AtmVOCkin) and IUPAC evaluations [37]. Mechanistically, OH oxidation of phenols proceeds predominantly via OH addition to the aromatic ring to form hydroxy cyclohexadienyl radicals, followed by O_2_ addition and RO_2_ chemistry [28,38,39]. Under urban high-NO conditions, RO_2_–NO reactions efficiently propagate radical chains and favor formation of ring-retaining oxygenated aromatics (e.g., dihydroxy benzenes such as catechol and related quinone-type products), whereas under lower-NO conditions RO_2_ pathways can shift toward peroxy radical autoxidation and formation of highly oxygenated low-volatility products that contribute to SOA [39,40,41].
Beyond phenol and cresol isomers, kinetic and mechanistic evidence also exists for more highly alkyl-substituted phenols (including trimethylphenols), indicating that the same radical-initiated oxidation framework (dominant OH addition to the aromatic ring followed by RO_2_ chemistry) can be extended across higher substituted phenolic precursors. In parallel, NO_X_-driven nighttime chemistry not only oxidizes phenols but also promotes nitration, yielding nitrated phenols that are atmospherically persistent enough to be observed and are mechanistically relevant to aerosol formation. Importantly, nitrophenol formation and subsequent SOA-relevant evolution have been explicitly demonstrated in laboratory and modeling studies; therefore, both higher substituted alkyl phenols (up to trimethylphenols) and nitrated phenols are explicitly included in our conceptual map (Figure 1) to reflect the functional range of atmospheric phenolics [40,42,43].
These compounds then participate in the broader atmospheric chemical processes. From a gas-phase kinetics perspective, many atmospheric phenolic VOCs (including alkyl-substituted phenols) react efficiently with OH via aromatic-ring addition during daytime, while NO_3_-initiated oxidation coupled with NO_2_-driven nitration at night favors the formation of nitrated phenols that can further contribute to SOA-relevant product evolution (Figure 1) [37,43]. The gas-phase reactions of these compounds and substituted phenols with atmospheric oxidants, including ·OH, ·NO_3_, Cl atoms, and O_3_, represent a primary degradation mechanism, as illustrated in Figure 1. The study of the transformation and degradation reaction mechanism of guaiacol triggered by atmospheric ·OH demonstrated that the products nitroguaiacol, methoxybenzoquinone, hydroxyphenyl formate, 2-methoxybenzene-1,3-diol, and dialdehyde all contributed favorably to the formation of SOA. Additionally, nitroguaiacol was experimentally detected as the main constituent of SOA under conditions of high concentration of NO_2_ during nighttime hours [44]. As demonstrated by Xiao et al. [16], in the typical polluted atmosphere of Beijing in winter, phenols from biomass combustion contribute significantly to the formation of aqueous SOA (aqSOA), and the rate of aqSOA formation can be up to 0.42 μg/(m^3^·h) at midday, which accounts for 15% of the total aqSOA formation rate. Therefore, the monitoring and control of volatile phenols is an important issue in environmental science research and policy making.
Literature-supported conceptual reaction classes for functionalized phenolics in urban air, covering phenol/cresols, higher alkyl-substituted phenols (dimethyl- and trimethylphenols), and nitrated phenols (nitrophenols), including ring-retaining oxygenation, nitration, and ring-opening oxidation branches. The formation of SOA is indicated at stages where low-volatility oxygenated and nitrated products, including ring-opening products, contribute to particle-phase mass through gas–particle partitioning and/or aqueous-phase processing. Each number corresponds to a reaction class with representative references: ① [45], ② [46,47], ③ [48], ④ (nitration/nitrophenol formation and SOA relevance) [34,43,49], ⑤ (multi-generation oxidation including higher substituted phenols) [42,49,50,51], ⑥ [50,52], ⑦ [53], ⑧ [54,55], ⑨ [35,56], ⑩ [56,57,58], ⑪ [59,60].
Through comprehensive investigation of the field of atmospheric VOCs, we have identified several shortcomings in the current body of research. These include the incomplete nature of fundamental data and the lack of comprehensive atmospheric activity. We employed volatile phenols as a novel approach for in-depth investigation. We conducted atmospheric observations in Beijing, China, and analyzed atmospheric volatile phenols by solid-phase solvent extraction and high-performance liquid chromatography (HPLC) to complete the study of the fundamental data of VOCs. Our objective was to introduce an innovative perspective that could potentially inject new ideas and methods for regional ozone pollution control, expand the research horizons of atmospheric VOCs, particularly OVOCs, and provide theoretical guidance for the future management of regional ozone pollution. It is anticipated that this novel research approach will facilitate the introduction of novel ideas and methodologies into the field of regional ozone pollution control. Furthermore, it is hoped that this research will expand the scope of research into atmospheric VOCs, with a particular focus on OVOCs. Finally, it is expected that this research will provide theoretical guidance for future regional ozone pollution control. Therefore, the present study was conducted from 27 June to 19 July 2023 in Beijing to observe atmospheric volatile phenols as well as alkanes, olefins, aromatics, carbonyl compounds, and other traditional types of VOCs in the external field. The main objectives of this study are (1) to understand the emission characteristics of VOCs based on the volatile phenol perspective, (2) to fill in the missing chemical activity of atmospheric VOCs through the estimation of ·OH depletion rate, ozone generation potential and secondary organic aerosol generation potential, and (3) to identify the source categories of VOCs and to estimate their contributions by using the PMF model.
2. Materials and Methods
2.1. Sample Collection
Beijing is located in the northern part of the North China Plain, surrounded by mountains in the west, north and northeast, and a plain sloping gently toward the Bohai Sea in the southeast. Beijing has a warm temperate semi-humid and semi-arid monsoon climate, with hot and rainy summers and cold and dry winters. The sampling point of this study is located on the third-floor platform of the experimental building of Beijing Capital Normal University (latitude 22.73° N, longitude 112.93° E; approximately 60 m above ground). The experimental building is situated in the middle of the city, adjacent to the West Third Ring Road, the main transportation artery in Beijing. It is also in close proximity to gas stations, restaurants, and residential areas. The surrounding area is devoid of any discernible sources of pollution, which renders it an apt representation of the typical urban environment in Beijing. This environment is characterised by a convergence of residential, transportation and commercial activities, and exhibits the typical urban characteristics observed in such settings. The summer season is associated with a heightened prevalence of ozone pollution [7]. In this study, we opted to conduct concurrent offline and online observations during the period of elevated ozone levels, specifically from 27 June to 19 July 2023.
The analysis of phenolic compounds is determined in accordance with the methods published by the Ministry of Ecology and Environment of China (https://www.mee.gov.cn/, Last accessed on 1 December 2025). The samples were collected using an atmospheric sampler (Beijing Kangwei Nengte Environmental Technology Co., Ltd., Beijing, China) and XAD-7 resin adsorption columns (inner diameter 6 mm, outer diameter 8 mm, length 11 mm, Beijing Ke’an Labor Protection New Technology Company, Beijing, China). The sampling flow rate was established at 0.3 L/min, with a sampling duration of 4 h. After completion, the column was closed at both ends with PTFE caps, wrapped with aluminum foil, placed in an airtight container, brought back to the laboratory, stored in a refrigerator at 4 °C or below to protect it from light, and analyzed within 14 days. A total of 48 valid samples and 3 blank samples of volatile phenols, 44 valid samples and 2 blank samples of carbonyls were collected in this study. The Ecological Environment Research Center of the Chinese Academy of Sciences provided online data on VOCs, including alkanes, alkenes, and aromatics, in ambient air for the same period.
2.2. Sample Analysis
Prior to analysis, the phenolic compounds were subjected to solid-phase extraction. The sampling tubes were brought to room temperature and washed by slowly adding 5 mL of methanol (HPLC Grade, 99.9%, Fisher Chemical, Waltham, MA, USA) from the outgassing end of the sampling tubes using a solid-phase extraction device. The eluent flowed naturally from the outgassing end, and was collected in a 5 mL centrifuge tube and blown down to less than 2 mL using a gentle stream of nitrogen gas. The solution was diluted with methanol to 2 mL and filtered through an organic phase filter membrane (0.22 μm) into a brown liquid phase injection vial for measurement.
Following sample processing, the samples were subjected to qualitative and quantitative analysis via HPLC (Thermo Fisher, Waltham, MA, USA, UltiMate 3000). The chromatographic column utilized was an Acclaim 120 C18 column (5 μm, 25 cm × 4.6 mm) with the column temperature set at 40 °C, the injection volume of 10.0 μL, the detection wavelength of 280 nm, the flow rate of 1.5 mL/min, and the mobile phases of acetonitrile (HPLC Grade, 99.95%, Fisher Chemical) and ultrapure water with 0.1% formic acid (HPLC Grade, 99%, DIKMA, Foothill Ranch, CA, USA) added. The elution gradient is detailed in Supplementary Materials Table S1. Additionally, an additional 5 min equilibration method was established to linearly change the solvent composition from 100% acetonitrile to 30% acetonitrile/70% water before running the next sample.
For further details on the methodology employed in the collection of samples and the analytical techniques used for the analysis of carbonyl compounds, please refer to Supplementary Materials Text S1.
2.3. Quality Assurance and Quality Control
The procedures for sample collection and analysis in this study were conducted in accordance with established standards to ensure the integrity and reliability of the data throughout the entire process, from the initial stages of pre-sampling preparation and field collection to the final stages of sample preservation, transportation, analysis, and data processing. The discrepancy in flow rate before and after collection is less than 5%. At least one blank is determined for each batch of samples, and the result is below the method detection limit.
The standard curves of phenols and carbonyls are presented in Supplementary Materials Texts S2 and S3, respectively. The standard curves and the correlation coefficients are shown in Supplementary Materials Tables S2 and S3. The correlation coefficients for the phenols range from 0.9991 to 0.9996, while those for the carbonyls range from 0.997 to 1.000. The method limit of detection (LOD) was calculated using the EPA TO11A method. A standard solution at a concentration close to the desired LOD was prepared and analyzed seven times. The standard deviation was calculated, and the LOD for each compound was determined at the 99% confidence level (see Supplementary Materials Tables S4 and S5). The detection limit for phenols was found to be 0.15380.6880 ppbv at a sampling volume of 72 L. Similarly, the detection limit for carbonyls was determined to be 2.510.4 × 10^−3^ ppbv at a sampling volume of 144 L.
The relative standard deviations (RSDs) of the carbonyls and phenols were calculated, and the RSD_i of the carbonyls and phenols were found to be less than 2.80% and 7.54%, respectively. Two parallel samples were collected at the same place at the same time, and the relative deviations of each substance were calculated to evaluate the precision of the method, and the RSD_m of carbonyl compounds and phenolic compounds were lower than 3.63% and 7.51%, respectively. The spiked recoveries of carbonyls and phenols exhibited a range of 62.17% to 111.70% and 96.65% to 126.22%, respectively, with the associated errors falling within the acceptable range. The results demonstrate that the method is highly reliable and can be employed in subsequent studies. The detailed evaluation results are presented in Supplementary Materials Tables S4 and S5.
2.4. Atmospheric Chemical Activity Analysis
2.4.1. OH Radical Loss Rate Calculation Method (LOH)
OH radicals have strong oxidizing properties and are capable of reacting with most pollutants in the atmosphere, thus affecting the atmospheric chemical lifetimes of pollutants [61].
During night, the altitude of the atmospheric boundary layer and the concentration of OH radicals are low, which prevents the removal of atmospheric pollutants by atmospheric diffusion or ·OH degradation, leading to their accumulation near the surface and increasing atmospheric reactivity. During the daytime, the dispersion of air pollutants increases as the height of the mixed layer rises. Concurrently, an augmentation in the concentration of OH radicals augments the capacity for pollutant elimination, thereby curbing the activity of pollutants. Consequently, the activity of pollutants can be quantified by calculating the ·OH loss rate (L_OH_), which enables the contribution of each substance to the atmospheric reaction to be determined. The specific calculation formula is as follows [62]:
where R is the reaction rate; is the volume fraction of OH radicals; is the reaction rate constant between pollutant i and OH radicals. All K_OH_ values are taken from the latest dataset provided by McGillen, M. R. et al. (AtmVOCkin-3.1) [37]; c is the volume fraction of a particular pollutant; and are the volume fraction of pollutant i and the total volume fraction of pollutants, respectively; is the total reaction rate constant.
2.4.2. Ozone Formation Potential (OFP)
The maximum ozone formation potential (OFP) of a pollutant can be estimated from its maximum incremental reactivity (MIR) value. This approach allows for the quantification of the maximum contribution of atmospheric pollutants to ozone production. Furthermore, the magnitude of the OFP values allows for the identification of the pollutant species that contribute the most to the production of O_3_. Additionally, the sum of the OFP values of all the species can be used as a relative representation of the overall activity of air pollutants in the region. The specific calculation formula is as follows [63]:
where is the maximum ozone production potential of pollutant I, is the maximum incremental reactivity of pollutant I, the value of which is adopted from [64,65]; and is the volume fraction of pollutant i.
2.4.3. Secondary Organic Aerosol Formation Potential (SOAFP)
SOA represents the most abundant component of organic aerosol, which can be generated through the photochemical oxidation of VOCs [66]. The secondary organic aerosol formation potential (SOAFP) is a common method for characterizing the contribution of SOA generation from VOCs [67]. The most widely used approach is the fractional aerosol coefficient (FAC) [68]. The specific calculation formula is as follows:
where SOAFP_i_ is the SOA formation potential; FAC_i_ is the fraction aerosol coefficient of species i. The FAC value is adopted from refs. [69,70,71] and ref. [72]; is the emission concentration of VOCs of species i.
3. Results and Discussion
3.1. Emission Characteristics
A total of 79 VOC species were obtained from this study, including 28 alkanes, 9 alkenes, 15 aromatics, 17 carbonyls, 10 volatile phenols, and the specific components are shown in Supplementary Materials Table S6. It should be noted that each compound is assigned to a single category based on its dominant functional group for reactivity analysis. For example, volatile phenolic compounds are counted only as phenols and are not included within the aromatic group. Therefore, direct comparisons of VOC class dominance between this study and NMHC-focused datasets should be interpreted with caution, as differences in species coverage and classification schemes can substantially alter the apparent contribution of individual VOC classes. Figure 2 illustrates the concentration levels of different components of VOCs, the percentage contribution, and the top ten VOC species. From Figure 2a, it can be seen that the total concentration of atmospheric VOCs is 51.29 ± 10.01 ppbv, and the concentration levels of different components are in the order of volatile phenols (19.95 ± 4.50 ppbv) > carbonyls (17.90 ± 6.85 ppbv) > alkanes (9.74 ± 4.05 ppbv) > alkenes (2.29 ± 2.27 ppbv) > aromatics (1.41 ± 1.17 ppbv). As illustrated in Figure 2b, the largest proportion of volatile phenols was observed, accounting for 38.87 ± 11.57% of the total, followed by carbonyls with 34.91 ± 6.85%, and aromatics exhibited the smallest component, at 2.70 ± 1.03%.
We compared results with summer-only observational datasets that explicitly reported the measurement window. A PTR-MS study conducted in Beijing during summer 2018 reported a total VOC mixing ratio of 39.4 ppb for the targeted VOC suite, with OVOCs contributing the dominant fraction [73]. In eastern China, a 1-year GC-based dataset in urban Nanjing reported a summer minimum of 18.5 ± 14.6 ppbv [74], whereas a long-term investigation in an industrial area of Nanjing reported a summer TVOC level of 38.8 ± 10.2 ppbv [4]. In western China, a petrochemical-industrial campaign in Lanzhou during summer 2019 reported a TVOC level of 50.8 ± 46.1 ppbv [75], comparable to the present study in magnitude. In the Sichuan Basin, an urban campaign in Chengdu during summer (June–August 2019) reported an average VOC concentration of 36.63 ± 12.92 ppbv [76]. Collectively, these summer-only comparisons place our observed TVOC (51.29 ppbv) at the higher end of summer urban datasets, while the consistently high OVOC/oxygenated fraction reported for Beijing summer observations support the robustness of OVOC dominance in photochemically active periods.
Nevertheless, volatile phenols and carbonyls together contributed more than 70% of TVOCs in this study, highlighting that OVOCs (including oxygenated aromatics when measured) can dominate summer VOC composition in Beijing. This also indicates that comparisons based solely on NMHC-focused species lists may systematically under-represent oxygenated aromatics and thereby bias the inferred “dominant” VOC classes in summertime megacities.
Building on this OVOC-dominated profile, the compositional contrast among VOC classes provides mechanistic insight into the summertime atmospheric processing regime in urban Beijing. The exceptionally large phenolic fraction, together with the substantial carbonyl loading, indicates that oxygenated products are not merely secondary or marginal components but constitute a major reservoir of ambient VOC carbon during summer. Such a pattern is characteristic of an environment with elevated temperatures and strong solar radiation, where photochemical oxidation of primary hydrocarbons proceeds efficiently and continuously converts parent compounds into oxygenated products, while volatilization from surfaces and materials further enhances the abundance of oxygenated aromatics [77]. Meanwhile, the very small fraction of non-oxygenated aromatics does not necessarily imply a weak influence of aromatic precursors. Instead, it likely reflects rapid daytime oxidation that limits the atmospheric persistence of parent aromatic hydrocarbons and shifts the chemical burden toward their oxygenated derivatives, which are classified as OVOCs rather than conventional NMHC aromatics [78].
In addition, the distribution of the top ten VOC species demonstrates a pronounced concentration centralization, whereby a limited number of compounds account for a large fraction of the total mixing ratio. The co-occurrence of phenol and methylphenols with formaldehyde and acetone among the most abundant species suggests that both secondary formation and continuous source replenishment sustain these compounds at elevated levels [79]. This concentration structure implies that source signatures and transformation pathways converge on a few chemically stable or persistently produced species, allowing them to dominate bulk concentration statistics even in the presence of a chemically diverse VOC mixture. Furthermore, the relatively large standard deviations observed for phenols and carbonyls indicate strong temporal variability, which is consistent with the combined influence of boundary-layer evolution, episodic emissions, and short-lived photochemical production events [80]. Overall, these features highlight that summertime VOC composition in Beijing is strongly shaped by oxygenated compounds and underscore that hydrocarbon-focused measurement strategies may substantially underestimate the contribution of oxygenated aromatics unless volatile phenols and related OVOCs are explicitly included.
3.2. Photochemical Reactivity
In the current literature, estimates of the atmospheric chemical activity of VOCs are primarily based on three key parameters: the maximum ozone production potential (OFP), the secondary organic aerosol production potential (SOAFP), and the rate of loss of ·OH (L_OH_). Therefore, the present study explores these three activity calculations separately, and the estimation results are shown in Figure 3.
3.2.1. OFP
The total ozone formation potential for VOCs is 171.19 ± 76.55 ppbv O_3_. The OFP values, as well as the contribution percentages of each VOC component, are shown in Figure 3a,b, respectively. Carbonyl compounds collectively accounted for the largest fraction of the total OFP (100.99 ± 25.15 ppbv, 59.03 ± 14.69%), primarily driven by a small number of highly reactive carbonyl species (e.g., formaldehyde and acetaldehyde) with high MIR values and elevated abundances. This phenomenon reflects secondary oxidation and fragmentation pathways under Beijing’s intense summer photochemistry: formaldehyde (5.08 ± 1.15 ppbv) and acetaldehyde (2.27 ± 0.70 ppbv) are already at high abundance levels, while small-molecule carbonyls such as glyoxal/glyoxalate are also significantly present. This indicates that alkenes/isoprene and aromatic systems rapidly ‘converge’ towards small-molecule carbonyls under high NO conditions. This shifts the OFP budget towards a ‘secondary-product-dominant’ urban summer pattern, an ‘aldehyde-dominated OFP’ configuration repeatedly observed in summer studies across other cities. Followed by volatile phenols, with an OFP value of 34.15 ± 7.31 ppbv O_3_, accounting for 19.94 ± 4.27% of the total; and aromatics had the lowest OFP value of 6.35 ± 2.18 ppbv O_3_, accounting for 3.70 ± 1.27% of the total. Compared to alkanes, alkenes and aromatics contribute more to O_3_ formation due to their high reactivity, although their concentrations are lower than those of alkanes, and the results are consistent with [81]. The dominant species were formaldehyde, acetaldehyde, phenol, isoprene and methylglyoxal. Among them, four aldehydes and ketones, two alkenes and four volatile phenols contributed 55.27 ± 7.69%, 9.90 ± 3.31% and 19.95 ± 6.22% to the OFP, respectively. The sum of the ozone-forming dominant species’ OFPs is 145.70 ± 29.43 ppbv O_3_, representing 85.11 ± 17.19% of the total. This further indicates that the ‘reactivity weighting’ of O_3_ precursors is highly concentrated in a few species and their upstream precursors. Therefore, control strategies should prioritize reducing direct emissions and secondary formation precursors (highly reactive alkenes and isoprene) of carbonyls such as formaldehyde/acetaldehyde, while simultaneously constraining aromatic emission sources capable of generating phenols. By contrast, merely reducing low-reactivity alkanes based on concentration is likely to yield lower ozone emission reduction benefits per unit effort.
3.2.2. SOAFP
The total estimated secondary organic aerosol formation potential for VOCs is 60.44 ppbv. Figure 3c,d shows the SOAFP values and their contribution to each VOC component, respectively. The SOAFP values and contributions of the components were alkanes (4.68 ± 1.47 ppbv, 7.74 ± 2.43%), alkenes (3.74 ± 0.38 ppbv, 6.18 ± 0.62%), aromatics (5.73 ± 0.66 ppbv, 9.48 ± 1.09%), carbonyls (20.15 ± 6.02 ppbv, 33.33 ± 9.96%), and volatile phenols (26.14 ± 3.61 ppbv, 43.25 ± 5.97%). At the class-aggregated level, volatile phenols showed the largest contribution to SOAFP; however, this dominance arises from the high SOA formation potentials of several individual phenolic species (e.g., phenol and methyl phenols), rather than implying uniformly high SOA yields across the entire phenolic class. The ten substances with the highest contribution to SOA include phenol, benzaldehyde, formaldehyde, isoprene, n-dodecane, toluene, acetaldehyde, p/m-xylene, acetone, and cis-2-pentene. Four carbonyls, one alkane, two alkenes, two aromatics and one volatile phenol contributed 33.15 ± 4.97%, 3.83 ± 0.76%, 5.57 ± 0.99%, 5.02 ± 0.60% and 43.37 ± 9.53% to the SOAFP, respectively. The sum of SOAFPs for the top ten SOA-forming dominant species was 54.90 ± 7.98 ppbv, representing 90.83 ± 13.20% of the total.
3.2.3. LOH
As shown in Figure 3e, the ΣL_OH_ of the measured VOCs observed in Beijing during the summer of 2023 reached 31.7 s^−1^, which is substantially higher than the <10 s^−1^ level typically reported for global clean regions, and approximately 2.8 times that of the summer “VOC reactivity” in Beijing in 2017 (11.2 s^−1^) [82]. Interregional comparisons further indicate that summertime VOC-related OH sinks in Beijing fall within the magnitude characteristic of “high-reactivity cities.” The average total ·OH reactivity observed in London during summer was 18.1 s^−1^ [83]; In the Pearl River Delta (Backgarden/PRD), summertime diurnal variations showed a midday minimum of approximately 20 s^−1^ and an early-morning peak reaching up to 50 s^−1^ [84]; In Mexico City, summertime daytime OH reactivity averaged around 25 s^−1^ and could surge to ~120 s^−1^ during the morning rush hour [85]; In a suburban forested area near Tokyo, the summertime mean OH reactivity was reported as 11.4 s^−1^ [86]. Together, these summertime observations indicate that the ΣLOH derived in this study not only exceeds background levels typical of temperate cities and the mean values of some metropolitan areas, but also lies within the characteristic range of summer conditions in cities with high emissions and strong photochemical activity.
Phenolic compounds accounted for 67.74 ± 16.72% of ΣLOH during the observation period, exceeding the aggregated contributions of alkenes and carbonyls. This result indicates that, at the class-aggregated level, phenolic compounds constitute an important contributor to OH reactivity in the studied urban atmosphere (Figure 3f). This finding contrasts markedly with earlier conclusions that summertime VOC reactivity in Beijing is typically dominated by alkenes [87,88]. One key reason for this discrepancy is that most previous field campaigns did not systematically include volatile phenols, focusing instead on traditional NMHCs (e.g., C_2_–C_10_ alkanes and alkenes) [89]. Owing to their molecular structures, which combine aromatic π systems with strong electron-donating substituents, phenolic compounds exhibit K_OH_ values substantially higher than those of alkenes with the same carbon number and monocyclic aromatics [62]. Consequently, even at moderate concentrations, phenols can contribute disproportionately to ·OH consumption. Their omission therefore leads to a systematic underestimation of the true summertime ·OH reactivity in urban environments and exaggerates the apparent dominance of alkenes. By incorporating volatile phenols at the species level, the reactivity pattern revealed in this study more closely represents the middle-to-late stages of aromatic hydrocarbon oxidation toward oxygenated aromatic products, pointing to a more advanced degree of secondary oxygenation and a chemical age structure closer to the “aromatic–oxygenated aromatic” transition regime [19].
C_6_–C_10_ species contributed 73.74 ± 2.79% of ΣL_OH_, approximately 3.3 times that of C_2_–C_5_ species, demonstrating that intermediate-carbon-number organics play a dominant role in the OH reactivity budget in urban environments [62]. This feature reflects the tendency of such compounds, under multi-source emission backgrounds (including solvent use, combustion emissions, and secondary formation), to simultaneously exhibit relatively high atmospheric abundances and large K_OH_ values, thereby occupying a substantial fraction of the ·OH sink. It should be noted that OH reactivity is highly species-specific rather than class-specific: the top 5% of high-L_OH_ species comprised only four compounds, yet accounted for 54.27 ± 17.40% of the total L_OH_. These species primarily included 1-naphthol, methyl phenol isomers, phenol, and isoprene, all of which share conjugated π systems combined with electron-donating substituents or high-electron-density double bonds. Under urban high-NO conditions, compounds dominated by ·OH addition reactions more readily promote RO_2_–NO reaction pathways [90,91], leading to a strong concentration of ·OH consumption among a small number of highly reactive species and amplifying the influence of ·OH reactivity on ozone formation. Mechanistically, alkanes primarily undergo H-abstraction reactions, with reaction rates constrained by steric effects and C–H bond dissociation energies, resulting in relatively low unit-concentration contributions to the OH sink [92,93]. In contrast, alkenes and aromatic systems predominantly react via ·OH addition, where substituent electronic effects enhance the branching ratio of addition pathways and accelerate the conversion of RO_2_ to NO reaction channels [92,94], allowing ·OH consumption to participate more directly in ozone formation. Phenolic compounds occupy a critical position within the aromatic oxidation system, as they can originate from both primary emissions and early- or mid-generation products of aromatic hydrocarbon oxidation [95]. Their substantial contribution to the ·OH sink indicates that summertime ozone and secondary organic aerosol formation in Beijing are more likely governed by the combined influence of aromatic hydrocarbons and their oxygenated derivatives, rather than being driven solely by traditional alkene precursors [49,96].
3.3. Source Apportionment
In this study, the PMF model was employed to ascertain the six source factors of VOC in Beijing during the summer season. These included fuel evaporation sources, gasoline vehicle exhaust sources, biological sources, diesel vehicle exhaust sources, solvent use and organic chemical sources, and petrochemical industry sources. A detailed textual description of the PMF model can be found in Supplementary Materials Text S4. The results of the PMF model analysis are presented in Supplementary Materials Figure S1.
Factor 1 is dominated by C_6_~C_7_ alkanes, including 2-methylpentane and 3-methylpentane, as well as cis-2-pentene. These species are characteristic of oil and gas evaporation [97,98], and thus factor 1 is regarded as a fuel evaporation source.
Factor 2 is notable for its high content of propylene, trans-2-butene, and cis-2-butene, as well as the presence of benzenes such as p-/m-ethyltoluene, which are the main components of gasoline vehicle exhaust [99,100]. Consequently, this factor was identified as a source of gasoline vehicle exhaust emissions.
Factor 3 is regarded as a biogenic emission source, exhibiting a distinctive chemical signature characterised by isoprene, which serves as an invaluable tracer for identifying vegetative emission sources [101].
Factor 4 contains a high level of n-dodecane, and diesel vehicle exhaust typically employs long-chain alkanes as markers, including n-undecane and n-dodecane [102]. Therefore, factor 4 is regarded as a contributor to diesel exhaust emissions.
Factor 5 contains a variety of OVOCs, including acetone, which is a common solvent. Additionally, solvent use contributes to the formation of benzaldehyde, acetaldehyde, and phenol [103,104]. Furthermore, the substance contains elevated concentrations of phenolic compounds, predominantly derived from the organic chemical industry. Phenol, chlorophenol, naphthol, etc., are extensively utilized in a multitude of organic chemical intermediates and raw materials [105,106,107]. Accordingly, factor 5 was identified as solvent use and organic chemical sources.
Long-chain alkanes with a high proportion of factor 6 are a dominant presence in the petrochemical industry, particularly n-heptane and methylcyclohexane [108]. Thus, this factor was identified as a potential source within the petrochemical industry.
Figure 4 illustrates the relative proportions of the contribution of atmospheric VOCs in Beijing by each source category. The contributions of each source category to VOCs are, in descending order, solvent use and organic chemical sources, diesel use sources, biological sources, fuel evaporation, petrochemical industry, and gasoline vehicle exhaust. It is important to note that solvent use and organic chemical sources (31.76%), as well as motor vehicle exhaust (27.48%, including vehicle exhaust and diesel use), contribute significantly to VOC pollution in Beijing.
The results of the atmospheric VOCs source analysis for 1 province and 18 cities in China for the period 2015–2023 are shown in Figure 5. It is possible that the source of VOCs varies from region to region due to different topography, industrial structure, etc. A comparison of the results of PMF source analysis in Beijing with those of 18 other sites in China revealed that vehicle exhaust (including gasoline and diesel exhaust) is the primary source of VOCs in Chinese cities, with a share ranging from 17% to 56% in the majority of cities. Among the aforementioned cities, the contribution of vehicle exhaust to Weihai is the largest (56%); the contribution to Lhasa, Tianjin, and Shijiazhuang is approximately 12%, and the lowest is in Jilin Province (4.6%), which indicates that the concentration of VOCs in urban areas is significantly influenced by vehicles. Secondly, Chinese cities are also heavily influenced by combustion sources, including biomass and coal combustion. The prevalence of the condition in Lhasa is approximately 29.0%, which is comparable to that observed in Tumushuke (30.9%) and higher than that observed in Weihai (25.1%), Shijiazhuang (21.5%), Jilin Province (21.4%), Changzhi (20.3%), and other sites. The diel profile (Supplementary Materials Figure S2) suggested that biomass burning persists in the suburbs of Lhasa [109], despite the suppression of older aerosol sources, such as wood, agricultural residues, cow dung cake burning, and garbage incineration, since the release of the Air Pollution Prevention and Control Action Plan (APAP) in 2013 [8]. Furthermore, incense burning represents another significant source of VOCs in Lhasa [110]. Industrial processes can also significantly affect the concentration of atmospheric VOCs. Especially in Jilin Province, as one of the typical representatives of China’s old industrial bases, with intensive chemical and petrochemical industries, the contribution to VOCs reaches an alarming 70.6%. Solvent use, NG/LPG, biogenic and fuel evaporation are also not negligible for the emission of VOCs in the urban atmosphere, accounting for about 2.73% to 31.76%. In addition, the petrochemical industry plays a significant role in certain urban areas, representing the largest source of VOCs in Shijiazhuang (26.2%), a figure that is higher than that observed in Beijing (11.5%) and Shanghai (16.6%). In addition, unlike other cities in China, the largest source of VOCs in Lhasa is secondary generation (39.0%), which is higher than combustion sources (29.0%) and much larger than NG/LPG (13.0%), vehicle exhaust (12.0%) and solvent use (7.0%). This phenomenon can be mainly attributed to the unique geographical situation of Lhasa, the Tibetan Plateau (Supplementary Materials Figure S3). It is well known that the Tibetan Plateau, with an average altitude of over 4000 m above sea level, has thin air and strong solar radiation. This results in the formation of VOCs being more strongly influenced by solar factors. The typical daytime peaks of OVOCs support this effect, as shown in Supplementary Materials Figure S4 [8]. In summary, by comparing with other sites in China, we found that the sources of VOCs are diverse and complex, especially affected by vehicle exhaust, and the sources of VOCs in Beijing could not escape the results of this analysis.
4. Conclusions
This study characterized the concentration levels and compositional features of VOCs and their contributions to atmospheric chemical processes based on summer observations in downtown Beijing. Phenols and carbonyls were identified as the dominant VOC groups, accounting for 38.87% and 34.91% of total concentrations, respectively, highlighting the importance of OVOCs in shaping urban TVOC burdens.
Phenolic species showed strong species-level contributions to SOA formation and OH radical loss, and, when aggregated, ranked second to carbonyl compounds in their contribution to O_3_ formation. Among them, phenol and cresols (including their isomers) were the most reactive species, indicating that volatile phenols are key drivers of urban oxidizing capacity as well as O_3_ and SOA formation.
Fuel evaporation, gasoline vehicle exhaust, biogenic emissions, diesel vehicle exhaust, solvent use and organic chemicals, and the petrochemical industry. Solvent-related and vehicle-related sources were the dominant contributors to VOC pollution in Beijing, providing important implications for regional emission control strategies.
Despite clear evidence for the critical role of OVOCs, several knowledge gaps remain. Multi-season and multi-site observations are needed to better constrain the spatiotemporal variability of phenols and carbonyls and to distinguish primary emissions from secondary formation. Higher time-resolution VOC measurements combined with constraints on radical chemistry would enable more mechanistic attribution of O_3_ and SOA formation. In addition, integrating receptor-based source apportionment with chemical transport modelling is necessary to evaluate sector-specific control strategies under different O_3_ sensitivity regimes. Finally, SOA formation estimates for phenolic compounds should incorporate Beijing-specific NO_X_ levels, aerosol loading, and multiphase chemistry to reduce uncertainties in translating formation potentials into policy-relevant outcomes.
Collectively, these findings strengthen the understanding of VOC pollution in Beijing and provide a clearer basis for targeted air quality management, while also defining priorities for future OVOC-focused observational and modelling studies in megacities.
The reference list from the paper itself. Each links out to its DOI / PubMed record.
- 1Zhang H. Jiang H. Jian G. Li H. Formation Mechanism and Management Strategy of Cooperative Control of PM 2.5 and O 3Res. Environ. Sci.20223561162010.13198/j.issn.1001-6929.2022.01.03 · doi ↗
- 2GB 3095-2012 Ambient Air Quality Standards Ministry of Ecology and Environment of the People’s Republic of China Beijing, China 2012
- 3Ministry of Ecology and Environment of the People’s Republic of China Ministry of Ecology and Environment Reports on National Ambient Air Quality Conditions in July and January–July Available online: https://www.mee.gov.cn/hjzl/sthjzk/zghjzkgb/(accessed on 1 December 2025)
- 4Mozaffar A. Zhang Y.-L. Lin Y.-C. Xie F. Fan M.-Y. Cao F. Measurement report: High contributions of halocarbon and aromatic compounds to atmospheric volatile organic compounds in an industrial area Atmos. Chem. Phys.202121180871809910.5194/acp-21-18087-2021 · doi ↗
- 5Song M.D. Tan Q.W. Feng M. Qu Y. Liu X.G. An J.L. Zhang Y.H. Source Apportionment and Secondary Transformation of Atmospheric Nonmethane Hydrocarbons in Chengdu, Southwest China J. Geophys. Res. Atmos.20181239741976310.1029/2018 JD 028479 · doi ↗
- 6Ji Y.M. Shi Q.J. Li Y.X. An T.C. Zheng J. Peng J.F. Gao Y.P. Chen J.Y. Li G.Y. Wang Y. Carbenium ion-mediated oligomerization of methylglyoxal for secondary organic aerosol formation Proc. Natl. Acad. Sci. USA 2020117132941329910.1073/pnas.191223511732493751 PMC 7306812 · doi ↗ · pubmed ↗
- 7Wang S. Cui J. Feng Y. Liu D. Chen J. Wang M. Wang X. Wang T. Characteristics and Source Apportionment of VO Cs and O 3 in Shijiazhuang Environ. Sci.2020415325533510.13227/j.hjkx.20200530233374048 · doi ↗ · pubmed ↗
- 8Ye C. Guo S. Lin W. Tian F. Wang J. Zhang C. Chi S. Chen Y. Zhang Y. Zeng L. Measurement report: Source apportionment and environmental impacts of volatile organic compounds (VO Cs) in Lhasa, a highland city in China Atmos. Chem. Phys.202323103831039710.5194/acp-23-10383-2023 · doi ↗