Atrial Fibrillation Detection from At-Rest PPG Signals Using an SDOF-TF Method
Mamun Hasan, Zhili Hao

TL;DR
This paper introduces a new method to detect atrial fibrillation from PPG signals by analyzing motion artifacts and harmonic parameters.
Contribution
The novel SDOF-TF method improves AF detection accuracy by quantifying motion artifacts and extracting harmonic features.
Findings
The SDOF-TF method achieved 100% accuracy in distinguishing AF from non-AF cases using RM, HRV, and HR standard deviation.
AF subjects showed diminished RM trends across harmonics compared to non-AF subjects.
The method effectively removes motion artifacts and noise to extract accurate physiological parameters.
Abstract
At-rest PPG signals have been explored for detecting atrial fibrillation (AF), yet current signal-processing techniques do not achieve perfect accuracy even under low-motion artifact (MA) conditions. This study evaluates the effectiveness of a single-degree-of-freedom time–frequency (SDOF-TF) method in analyzing at-rest PPG signals for AF detection. The method leverages the influence of MA on the instant parameters of each harmonic, which is identified using an SDOF model in which the tissue–contact–sensor (TCS) stack is treated as an SDOF system. In this model, MA induces baseline drift and time-varying system parameters. The SDOF-TF method enables the quantification and removal of MA and noise, allowing for the accurate extraction of the arterial pulse waveform, heart rate (HR), heart rate variability (HRV), respiration rate (RR), and respiration modulation (RM). Using data from the…
Genes, proteins, chemicals, diseases, species, mutations and cell lines named across the full text — each resolved to its canonical identifier and authoritative record.
Click any figure to enlarge with its caption.
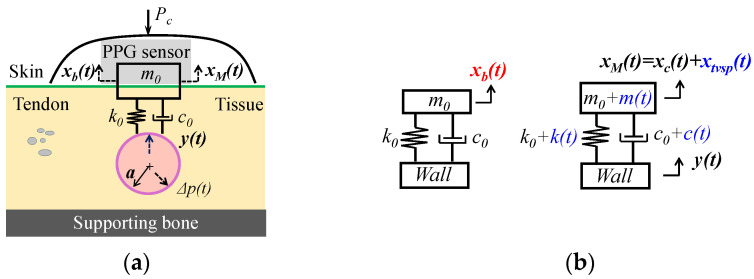 Figure 1
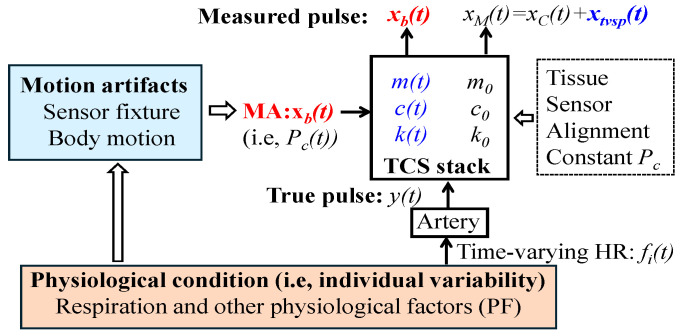 Figure 2
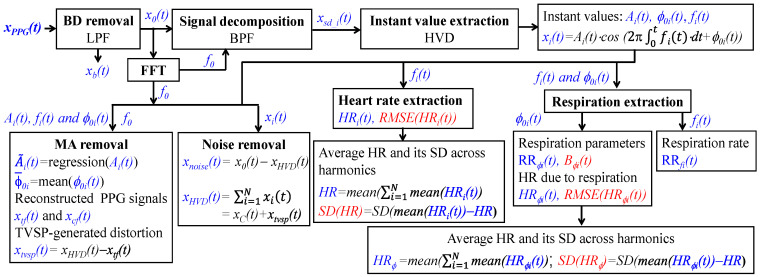 Figure 3
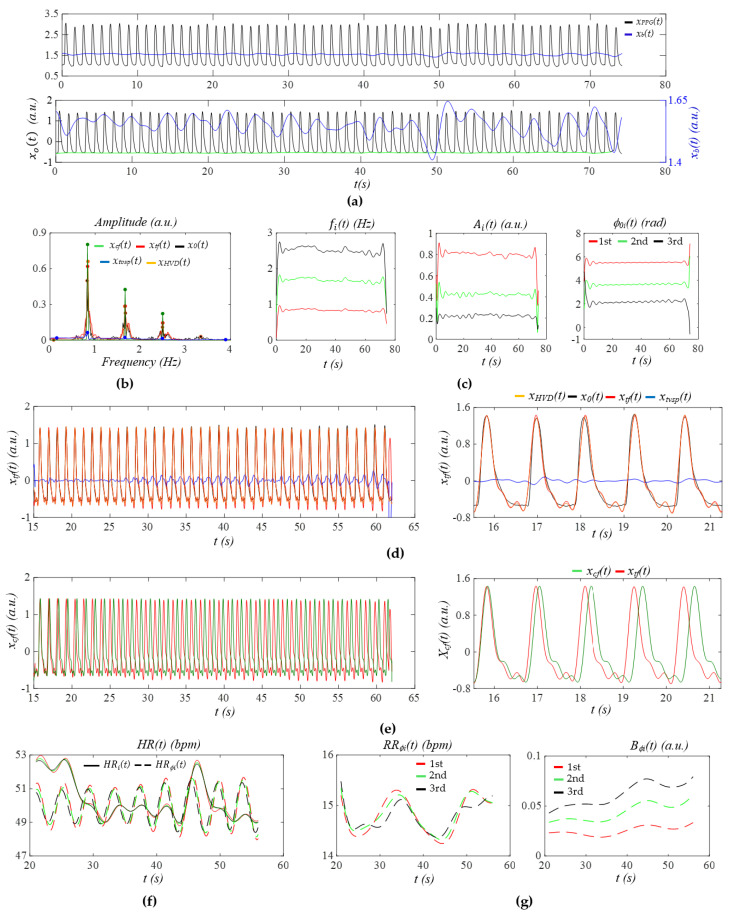 Figure 4
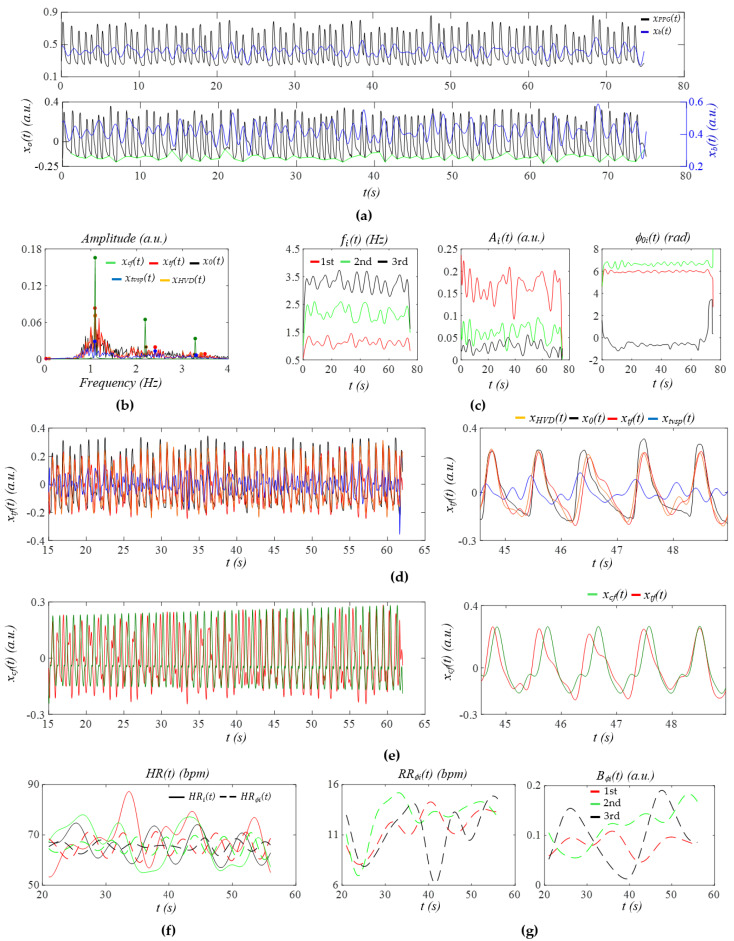 Figure 5
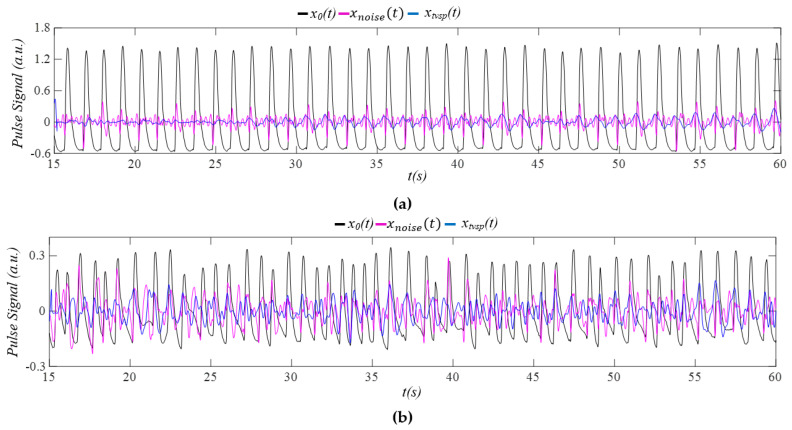 Figure 6
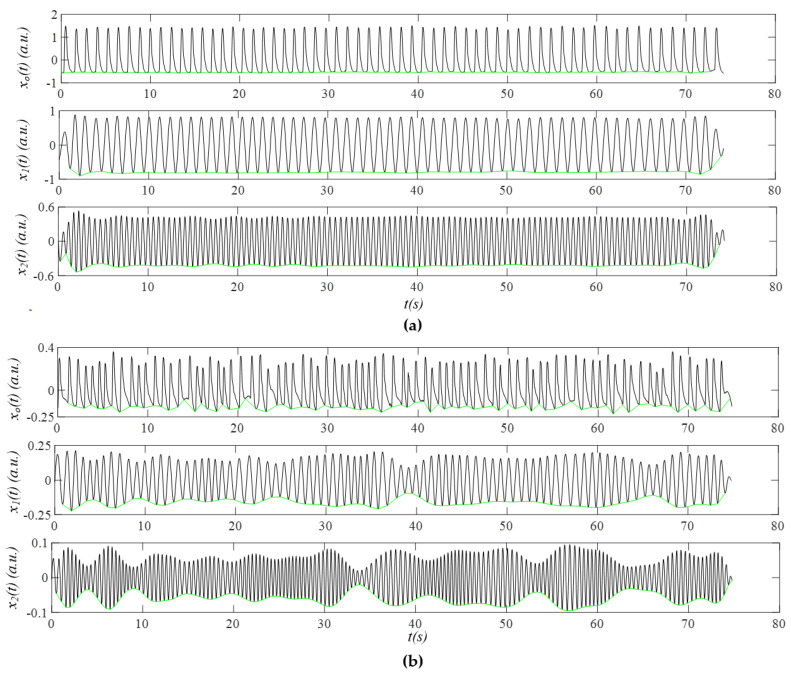 Figure 7
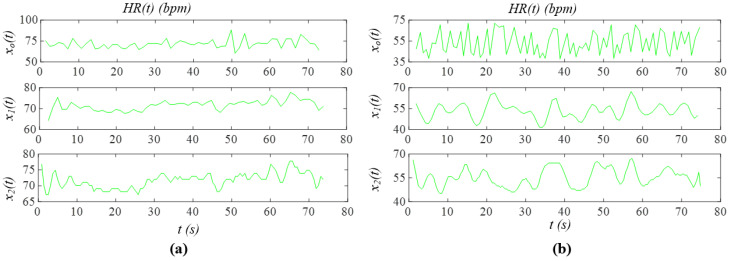 Figure 8
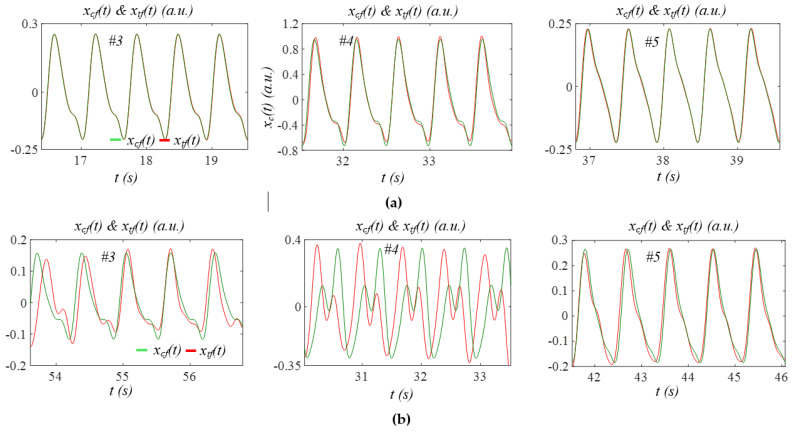 Figure 9
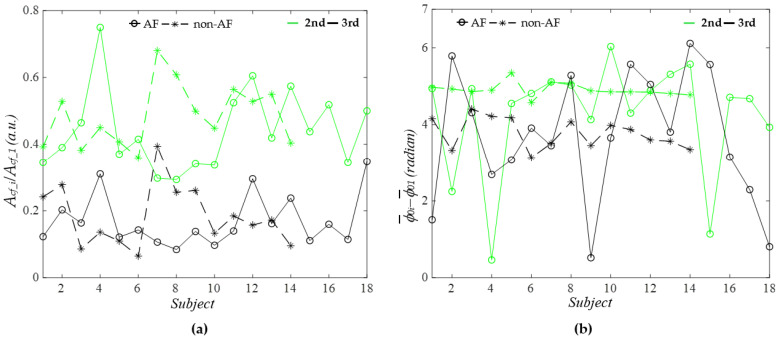 Figure 10
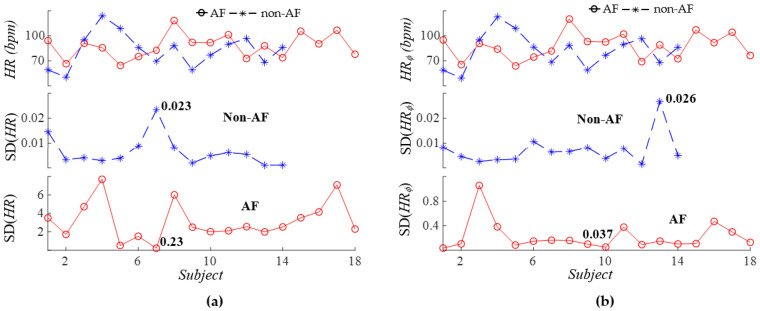 Figure 11
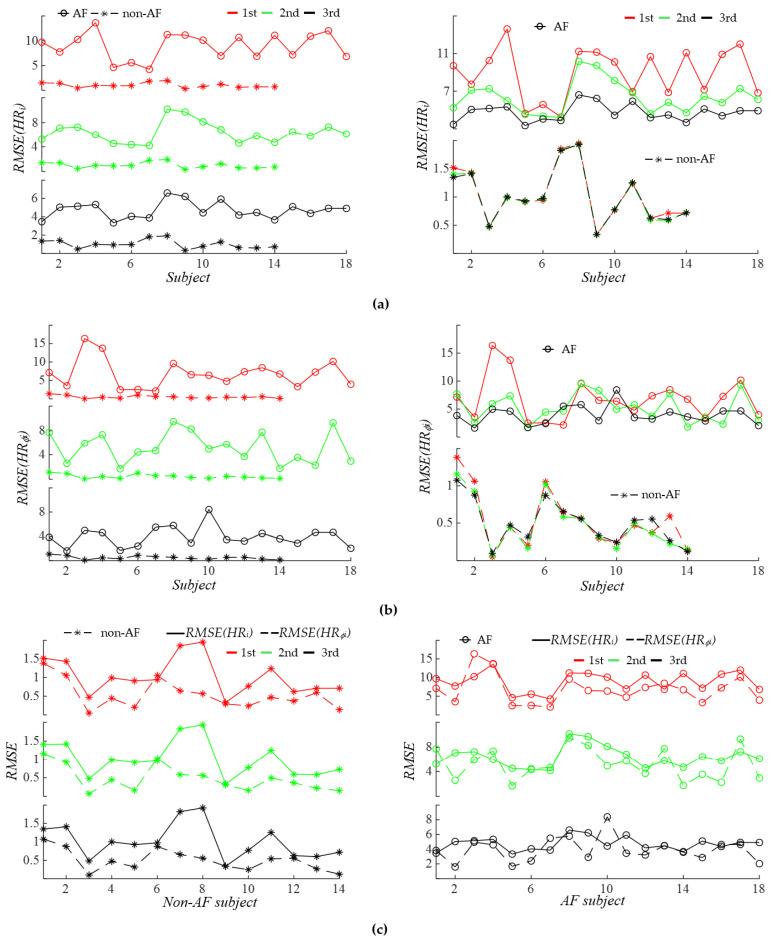 Figure 12
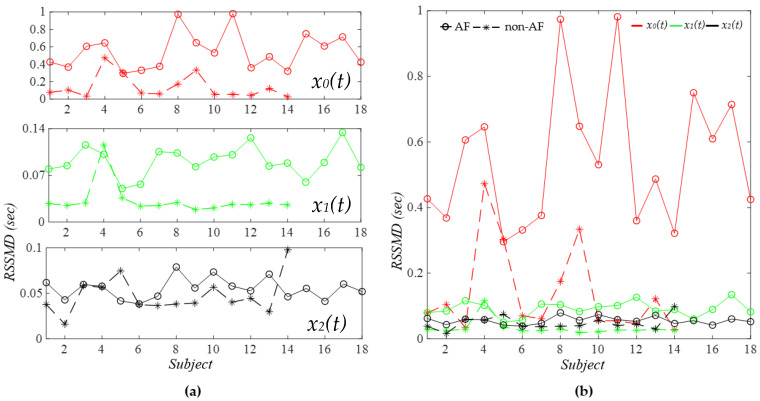 Figure 13
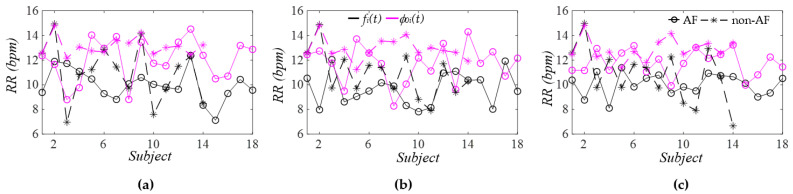 Figure 14
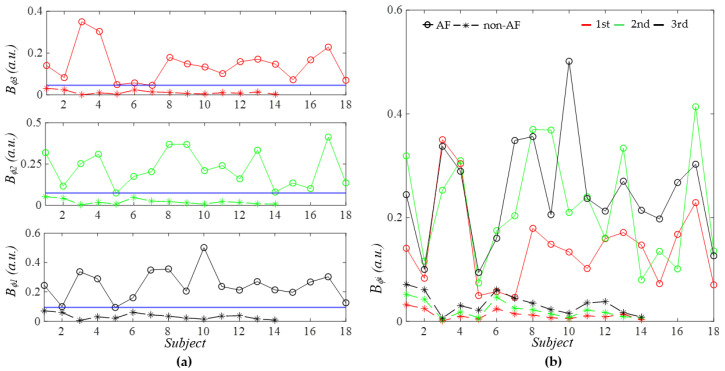 Figure 15
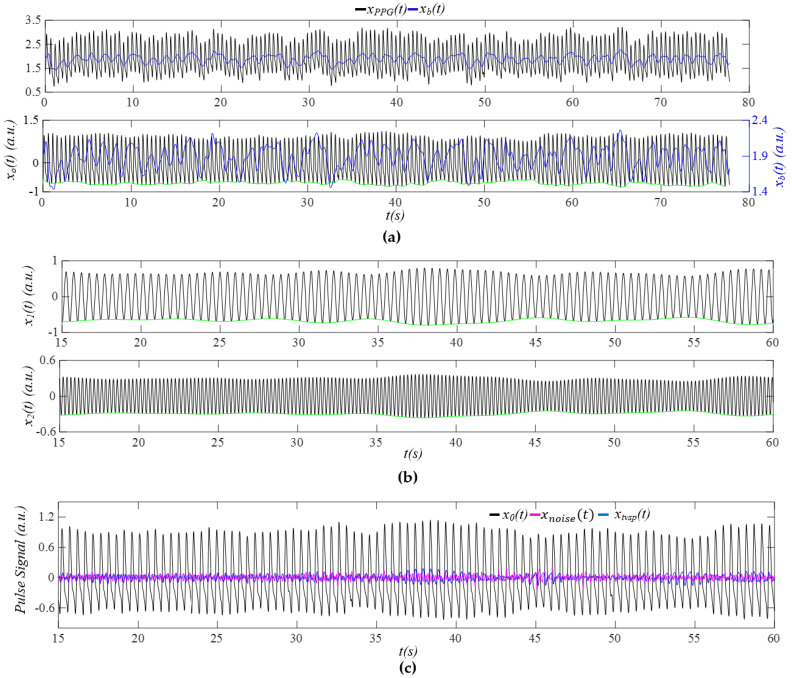 Figure 16
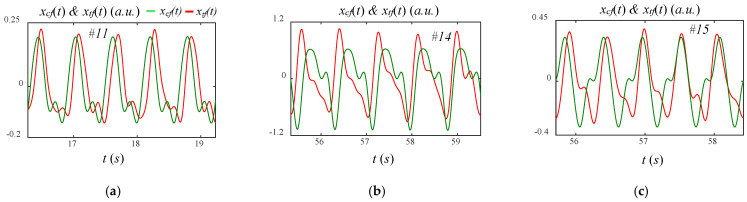 Figure 17
Peer Reviews
No public reviews on file for this paper yet. If you reviewed it on a platform where reviews are public (OpenReview, ICLR, NeurIPS, ICML), you can paste yours below so the community can read it here.
Videos
No videos yet. Explain this paper in a talk, walkthrough, or lecture? Add one.
Taxonomy
TopicsNon-Invasive Vital Sign Monitoring · Atrial Fibrillation Management and Outcomes · ECG Monitoring and Analysis
1. Introduction
Atrial fibrillation (AF) is a common cardiac arrhythmia that poses significant health risks, including stroke and heart failure, making timely and accurate detection crucial for mitigating these risks [1,2,3,4,5]. Compared to the gold-standard electrocardiogram (ECG) for AF detection, photoplethysmography (PPG) has emerged as a viable alternative that allows for the routine monitoring of cardiovascular (CV) health in clinical settings or at home due to its accessibility and ease of use [1,2,3,4,5]. When utilizing PPG sensors for AF detection, measurements can be categorized into two distinct types: wearable PPG sensors at the wrist during movement [1,2] and non-wearable PPG sensors on the finger at rest [6,7,8,9,10,11,12,13]. The shift towards wearable PPG signals for AF detection is driven by the practical benefits of continuous monitoring [1,2]; however, these signals typically exhibit lower fidelity and are more susceptible to high motion artifacts (MAs), resulting in significantly lower detection accuracy compared to at-rest PPG signals [1,2,14,15].
While at-rest PPG signals are much less affected by MAs than their wearable counterparts, they still do not achieve a perfect match with the gold-standard ECG, primarily due to three factors: MA, noise, and individual variability (i.e., physiological condition) [3,4,5,16,17,18]. Improving the precision of at-rest PPG analysis is essential for enabling cost-effective and scalable AF screening in both clinical and home environments. Thus, there is a critical need to develop more effective signal-processing algorithms to achieve a 100% accuracy rate for at-rest PPG signals, reducing false positives and negatives to ensure timely and accurate detection and treatment [2,9,19,20].
Among the datasets for at-rest PPG signals used in AF detection, the MIMIC PERform AF dataset, available on the PhysioNet website [21], has been extensively studied for testing various signal-processing techniques [6,7,8,9,10,11,12,13]. Despite the relatively high quality (i.e., low MA) of these at-rest signals, no signal-processing techniques have yet achieved perfect accuracy for AF detection [6,7,8,9,10,11,12]. Traditional time-domain techniques have been employed to identify irregularities in the PPG signals [6,7]. In addition, time–frequency techniques have been utilized to decompose the PPG signals into different frequency components, allowing for improved noise reduction and feature extraction [9]. Recently, machine learning algorithms have gained prominence due to their ability to learn complex patterns from data [11,12]. Deep learning techniques have also been implemented, which capitalize on their capability to automatically extract relevant features from PPG signals, with reported accuracy rates reaching 98% for this dataset [8]. However, deep learning techniques often function like a black box, lacking interpretability and transparency, which can make it challenging for clinicians to trust their results [22,23,24]. Moreover, these techniques require training on specific datasets, raising concerns about the generalizability of findings across diverse demographic groups, highlighting the need for proper validation to ensure their widespread clinical applicability [22,23,24]. Above all, the persistent, albeit small, margin of error underscores the necessity for further improvement in signal-processing techniques on at-rest PPG signals to attain clinical-grade accuracy [19,20].
This study aims to apply a generalized single-degree-of-freedom (SDOF) time–frequency (SDOF-TF) method [25] to the at-rest PPG signals in the MIMIC PERform AF dataset to examine the effectiveness of this method in removing MA and noise from these pulse signals for AF detection. The SDOF-TF method is built on an SDOF model of MA in a measured pulse signal, where the tissue–contact–sensor (TCS) stack, sandwiched between an artery and the PPG sensor at the skin’s surface, is treated as an SDOF system [26]. MA causes a baseline drift (BD), which refers to the time-varying distance change in the PPG sensor relative to the artery, and, consequently, time-varying system parameters (TVSPs) of the TCS stack [27,28]. While BD manifests as additive noise, which is low-frequency (<0.7 Hz) and can be easily removed, TVSP-generated distortion manifests as multiplicative noise that rides on each harmonic in a PPG signal [25,27,28]. In [25], the working principle of the SDOF-TF method was detailed and applied to analyze three pulse signals measured using a tactile sensor and four PPG signals under varying physiological conditions (note: of the four PPG signals, one is from the AF group and one is from the non-AF group within the MIMIC PERform AF dataset); the effectiveness and generalizability of the method in removing MA and noise from these signals measured using both sensor types were qualitatively demonstrated by the consistency of the derived differences between physiological conditions with the related findings in the literature. In particular, several extracted parameters in [25] revealed significant differences between the AF and the non-AF subjects, but these differences lacked statistical significance.
As compared to the previous study [25], which focused on the SDOF-TF method itself—its working principle, generalizability to different sensor types, and qualitative validation—the original contributions of this study include (1) applying the SDOF-TF method to the entire MIMIC PERform AF dataset, enabling the quantitative validation of its effectiveness in removing MA and noise from at-rest PPG signals; (2) identifying all extracted parameters that show non-overlapping values between the AF and non-AF groups, thereby serving as statistically significant indices for AF detection; and (3) revealing the physiological implications of some of the observed differences between AF and non-AF subjects.
2. Materials and Methods
2.1. An SDOF-TF Method for Time-Frequency Analysis
2.1.1. An SDOF Model of MA in a PPG Signal
The SDOF model of MA in a PPG signal is based on three assumptions: (1) the tissue–contact–sensor (TCS) stack behaves linearly during pulse signal measurement and (2) the effect of the TCS stack in the true pulse signal is negligible, and thus the input pulse signal to the TCS stack is the arterial wall displacement y(t) instead of the pulsatile pressure Δp(t), as shown in Figure 1a.
A PPG sensor contains a light emitter and a photodetector. As shown in Figure 1a, a tape (or a mechanical fixture) is used to fix a PPG sensor with contact pressure P_c_ for establishing the tissue–sensor contact. Due to the deformability of the tissue above the artery, the tissue–contact–sensor (TCS) stack is treated as an SDOF system with spring stiffness k0, damping coefficient c0, and mass m0, to capture its dynamic behavior during pulse measurement. The PPG sensor forms part of m0. Note that P_c_ presets the nominal values of m0, k0, and c0 and is fully accounted for by the three system parameters. The light sent by the light emitter passes through the TCS stack and is partially absorbed by blood in the artery, and the transmitted or reflected light is detected by the photodetector as the measured pulse signal (i.e., PPG signal). Optical transduction in a PPG signal is extremely complex [4]. For simplicity, optical transduction is neglected here, except when considering the effect of MA on a PPG signal, and thus a PPG signal is represented as the displacement at the mass.
Figure 1b shows the SDOF model of MA in a PPG signal. Due to MA, the PPG sensor itself encounters a time-varying displacement x_b_(t) (i.e., BD) at the mass, which further induces time-varying system parameters (TVSPs): m(t), k(t), and c(t) of the TCS stack:
The true pulse signal in an artery serves as the base excitation for the SDOF system and is time-harmonic [28,29]:
where , , and are the amplitude, phase, and angular frequency of , respectively. causes displacement at the mass [25,27,28]:
Due to TVSP in Equation (3), is non-stationary and takes the following form [25]:
where , , and are the instant amplitude, phase, and frequency of , respectively. The PPG signal becomes [25]
where is BD; is the measured pulse signal when free of MA (i.e., free of TVSP); and is the TVSP-generated distortion in Equation (3). When free of MA, based on Equation (3), the measured pulse signal is
Thus, the total distortion caused by MA in a PPG signal is
While x_b_(t) is a low-frequency additive noise (<0.7 Hz), x_tvsp_(t) rides on each harmonic of the true pulse signal, as shown in Equation (3), and thus is multiplicative noise.
The further analysis of x_tvsp_(t) [25] reveals that x_tvsp_(t) (1) dramatically swings the instant amplitude, (2) slightly affects the instant frequency, and (3) almost has no effect on the instant initial phase of each harmonic in x_M_(t). Based on these identified effects, an SDOF-TF method is developed for the removal of MA (i.e., x_b_(t) + x_tvsp_(t)) and noise from a PPG signal and the extraction of arterial pulse waveform (APW), heart rate (HR), and respiration parameters.
2.1.2. An SDOF-TF Method
As shown in Figure 2, the tissue, sensor, alignment, and constant P_c_ (i.e., sensor fixture) involved during pulse measurement cannot be independently quantified. Instead, their collective behavior can be quantified as the nominal parameters m0, c0, and k0 of the SDOF system representing the TCS stack. The physiological condition of an individual (i.e., individual variability) manifests in a PPG signal in two ways. First, physiological condition governs time-varying HR, and thus manifests as time-varying frequency f_i_(t) of the ith harmonic in the true pulse signal y(t). Second, it influences body motion, which, in conjunction with the sensor fixture, gives rise to MA. MA induces BD x_b_(t)—equivalent to a time-varying P_c_(t)—and TVSP-generated distortion x_tvsp_(t). Consequently, x_b_(t) and x_tvsp_(t) collectively quantify the inseparable effect of the physiological condition and sensor fixture on a PPG signal, from the perspective of MA formation in a PPG signal.
From the perspective of the time-varying HR of an arterial pulse signal, physiological condition includes respiration and other physiological factors (PFs) [30]. While the effect of respiration on time-varying HR is commonly assumed to be time-harmonic, the effect of PF is deemed to be non-time-harmonic. The true pulse signal y(t) is a collection of multiple harmonics of HR [30]:
where f0 is the frequency of constant HR, A_i_ and ϕ0i are the amplitude and initial phase of the ith harmonic, respectively, and is related to respiration. Note that A_i_, f0, and ϕ0i are all constant, and the effect of PF on HR is excluded in Equation (9). The frequency of the ith harmonic is altered by respiration as i·f0 + B·cos (2πf_r_t + α0), where B is respiration modulation (RM), indicating the strength of respiratory sinus arrhythmia (RSA) on altering HR [30], and f_r_ and α0 are the respiration rate (RR) and initial phase of respiration, respectively.
Figure 3 illustrates a simplified signal-processing algorithm of the SDOF-TF method. The detailed algorithm can be found in [25]. A PPG signal x_PPG_(t) goes through a low-pass filter (LPF) to remove x_b_(t) and obtain x0(t):
where x_noise_(t) denotes noise associated with the sensor.
Fast Fourier transform (FFT) is conducted on x0(t) to obtain the frequency of the first harmonic of the PPG signal. Then, a bandpass filter (BPF) is used to separate the ith harmonic x_sd_i_(t) from x0(t). Hilbert vibration decomposition (HVD) [28] is used to extract instant amplitude A_i_(t), instant frequency f_i_(t), and instant initial phase ϕ0i(t)of the ith harmonic, whose sum is denoted as x_HVD_(t) and is equal to x_C_(t) +x_tvsp_(t) in Equation (5):
As compared to x_sd_i_(t), sensor noise is greatly alleviated in x_i_(t) [25,28]. The sensor noise is then calculated as
To remove MA (i.e., x_tvsp_(t)), the regression line of A_i_(t): and the mean of ϕ0i(t): are obtained. Then, free of MA and noise, the pulse signal x_tf_(t) with time-varying frequency (or HRV) is reconstructed [25]:
To examine the effect of time-varying frequency (or HRV) on the APW of a PPG signal, the corresponding pulse signal x_cf_(t) with constant frequency (i.e., constant HR) is reconstructed [25]:
Accordingly, x_tvsp_(t) riding on each harmonic in a PPG signal is calculated as
We further extract HR_i_(t) from the instant frequency f_i_(t) of the ith harmonic [25]. Note that HR_i_(t) represents the total HR, which accounts for the effects of both respiration and PF on HR. HRV is calculated using root mean squared error (RMSE). The total HVR is then calculcated as RMSE(HR_i_(t)).
To calculate one value for the total HR of a subject from the three harmonics, the average HR of each harmonic is calculated as mean (HR_i_(t)). The HR of a subject is then calculated as the average of the averaged HR of the three harmonics, and the difference in average HR between the three harmonics is calculated as their standard deviation (SD):
Extraction of the respiration signal is conducted on both f_i_(t) and ϕ0i(t) [25]. While the RR extracted from f_i_(t) is denoted as RR_fi_(t), the RR extracted form ϕ0i(t) is denoted as RR_ϕi_(t). As will be seen in Section 3, RR_fi_(t) underestimates the RR, as compared to RR_ϕi_(t). Thus, the RM is only extracted from ϕ0i(t) and denoted as B_ϕi_(t).
The HR accounting solely for the effect of respiration on HR is also calculated and is denoted as HR_ϕi_(t), and the associated HRV is calculated as RMSE (HR_ϕi_(t)). Similarly to HR and SD (HR) from f_i_(t) in Equation (16), we also calculate one value for the HR, which accounts solely for respiration, of a subject from the three harmonics:
where HR_ϕ_ denotes the average value from the three harmonics and SD (HR_ϕ_) is their standard deviation of the three harmonics.
2.2. PPG Signals of AF and Non-AF Subjects and Their Analysis
To evaluate the effectiveness of the SDOF-TF method in removing MA and noise from a PPG signal measured at rest, we choose to apply it to analyze the at-rest PPG signals in the MIMIC PERform AF Dataset [21], which contains data recorded from 35 critically ill adults during routine clinical care using a bedside monitor. Each subject has 20 min of data sampled at 125 Hz. The PPG signals of all subjects in the dataset are labeled as either AF or non-AF. However, the PPG signals for one subject in the non-AF group and two subjects in the AF group are missing (see Table A1 in Appendix A). Thus, there are 14 subjects in the non-AF group and 18 subjects in the AF group.
The signal-processing algorithm for implementing the SDOF-TF method was developed in MATLAB2025a and follows the procedure described in [25]. Compared with [25], four additional parameters—average HR and its SD across harmonics from the instant frequency and instant initial phases—are extracted from a PPG signal. An 80 s segment with no abrupt change was selected from each PPG signal for analysis (see Table A1 in Appendix A). Only the first three harmonics of the PPG signals were analyzed, since the higher harmonics in the PPG signals of the AF group were extremely small, compared with their lower counterparts. As will be seen in Section 3, multiple extracted parameters can effectively distinguish between the AF and non-AF groups with 100% accuracy; therefore, no further statistical analysis is necessary. All the figures illustrating the analyzed results were generated using the same software (see Table A2 and Table A3 in Appendix A for the numerical values corresponding to these figures).
3. Results
3.1. Examination of MA, Noise, APW, HR, and Respiration Parameters
As the detailed analysis of the first subject in each group has been previously reported in [25], the present work focuses on the intermediate results of the SDOF-TF method from the second subject in each group. This aims to elucidate the effects of MA and noise on the PPG signals under two physiological conditions: non-AF versus AF, and to further enhance the interpretability and transparency of the method.
Figure 4a shows the PPG signal (segment: 945~1025 s) of Subject 2 in the non-AF group. After the removal of x_b_(t), all the pulse cycles are aligned to a similar level. Except the pulse cycles around 50 s, which experience relatively large MA, MA in the remaining pulse cycles is minimal. Figure 4b presents the frequency spectrum of x0(t), x_tf_(t), x_HVD_(t), x_cf_(t), and x_tvsp_(t), revealing small sidebands from HRV and a small x_tvsp_(t). In Figure 4c, the relatively large MA around 50 s causes noticeable changes in f_i_(t) and A_i_(t), but no change in ϕ0i(t). Compared to f_i_(t), ϕ0i(t) exhibits a more consistent time-harmonic behavior, capturing the respiration signal far more effectively.
Figure 4d compares the reconstructed pulse signal with time-varying frequency x_tf_(t) with x_HVD_(t), x0(t), and x_tvsp_(t). The difference between x0(t) and x_HVD_(t) represents noise, which obscures the dicrotic notch. The small difference between x_tf_(t) and x_HVD_(t) indicates small MA (or small x_tvsp_(t)). As shown in Figure 4e, due to low HRV, the difference in APW between x_cf_(t) and x_tf_(t) is very small, except that there is a large phase shift between them, possibly due to the large swing of HR_i_(t), as shown in Figure 4f. Note that in Figure 4f, HR_i_(t) and HR_ϕi_(t) from the three harmonics are almost identical. The difference between HR_i_(t) and HR_ϕi_(t) is believed to arise from the fact that HR_i_(t) reflects the combined effects of respiration and PF on HR, whereas HR_ϕi_(t) captures only the influence of respiration. Furthermore, HR_i_(t) is affected by MA to a larger extent than HR_ϕi_(t) [25]. Additionally, HR_ϕi_(t) exhibits a clear time-harmonic pattern. Figure 4g presents the instant RR RR_ϕi_(t) and instant RM B_ϕi_(t) extracted from ϕ_i_(t). While RR_ϕi_(t) does not vary with harmonic order, B_ϕi_(t) shows an increasing trend with harmonic order.
Figure 5a shows the PPG signal (segment: 955~1035 s) from Subject 2 in the AF group. Compared to Figure 4a, x_b_(t) exhibits pronounced temporal variations, with an amplitude ranging from one-third to one-half of the pulse signal amplitude. As shown in Figure 5b, the large and wide sidebands of x_tf_(t) indicate substantial HRV, and the wide and relatively large sidebands of x_tvsp_(t) reflect large MA, compared to Figure 4b. Similarly to Figure 4c, ϕ_i_(t) in Figure 5c captures the respiration signal more effectively than f_i_(t).
As shown in Figure 5d, the moderate difference between x_tf_(t) and x_HVD_(t) indicates a relatively large x_tvsp_(t). As shown in Figure 5e, the substantial changes in the time-varying frequency (i.e., large HRV) result in pronounced variations in the pulse waveform between cycles. Figure 5f highlights that the remarkable difference between x_cf_(t) and x_tf_(t) underscores the significant role of HRV in preserving the dicrotic notch in the diastolic portion of the pulse waveform. As shown in Figure 5f, HR_i_(t) and HR_ϕi_(t) are comparable in amplitude and their time-varying patterns are remarkably misaligned across the harmonics. Figure 5g reveals that both RR_ϕi_(t) and B_ϕi_(t) do not exhibit any changing trends with harmonic order.
Figure 6 compares noise x_noise_(t) and MA x_tvsp_(t) with x0(t). As shown in Figure 6a, x_noise_(t) exhibits a large spike at the peak of each pulse cycle in the non−AF subject. The magnitude of x_noise_(t) is comparable to that of x_tvsp_(t). Interestingly, both x_noise_(t) and x_tvsp_(t) display time−varying characteristics. In contrast to the AF subject shown in Figure 6b, x_noise_(t) and x_tvsp_(t) are similar in magnitude and both demonstrate random time−varying behavior. These two signals are relatively large, as compared to x0(t).
Figure 7 shows x0(t), the first harmonic x1(t), and the second harmonic x2(t) (see Equation (11)). While x0(t) includes both x_noise_(t) and x_tvsp_(t), x1(t) and x2(t) contain only x_tvsp_(t). The baseline connecting the start and end points of the pulse cycles are used to extract HR from these cycles in the time domain. As shown in Figure 7a, due to small MA and low HRV in the non−AF subject, the baselines for x0(t) and x1(t) remain nearly flat. In contrast, the baseline for x2(t) exhibits discernable variation between pulse cycles, as the smaller amplitude of x2(t) makes it more sensitive to MA and HRV. As shown in Figure 7b, large MA and high HRV in the AF subject produce substantial baseline variation across pulse cycles for all three signals: x0(t), x1(t), and x2(t). Figure 8 shows the extracted HR based on the baselines in Figure 7. As compared to the non-AF subject, the HR extracted from x0(t) in the AF subject exhibits pronounced temporal variation. The HR time-varying pattern derived from both x1(t) and x2(t) varies less in the non-AF subject than in the AF subject.
Figure 9 shows additional extracted APWs from subjects in each group. For non-AF subjects, low HRV results in x_tf_(t) and x_cf_(t) are nearly identical. In AF subjects, high HRV leads to a pronounced difference between x_cf_(t) and x_tf_(t). The observed small difference between x_tf_(t) and x_cf_(t) in Subject 5 in the AF group arises from the fact that this subject exhibits the lowest HRV among all the AF subjects, as will be seen later. Finally, the APW varies dramatically between subjects in each group.
3.2. Comparison of AF Versus Non−AF Groups’ Extracted Parameters
Given that pulse amplitude is highly sensitive to contact pressure, the normalized amplitude and initial phase difference of each harmonic—relative to the first harmonic—were used to compare the two groups. As shown in Figure 10a, the normalized amplitude of the second harmonic is consistently larger than that of the third harmonic, irrespective of AF or non-AF status. No significant difference in the normalized amplitudes of the two harmonics was observed between the AF and non-AF groups, and the amplitudes varied considerably across subjects within each group.
Figure 10b shows the initial phase differences of the two harmonics, which also do not differ between AF and non-AF subjects. For the non-AF group, the initial phase of the second harmonic remains larger than that of the third harmonic. In contrast, for the AF group, the initial phase of the third harmonic exceeds that of the second harmonic in some subjects ( 03 > 02 for Subjects 2, 4, 8, 11, 12, 14, 15). While the initial phase differences in the non-AF group exhibit only slight variation between subjects, they fluctuate substantially among the AF subjects. As shown in Figure 5e and Figure 9b, time-varying HR contributes to preserving the dicrotic notch in the diastolic portion in Subjects 2 and 4, as compared to the APWs of Subjects 3 and 5. To further validate whether time-varying HR contributes to this effect on the dicrotic notch for other PPG signals with 03 > 02, the APWs with time-varying HR and constant HR for Subjects 11, 14, and 15 were plotted (see Figure A2 in Appendix A). It becomes clear that only when 03 significantly exceeds 02 does time-varying HR contribute to preserving the dicrotic notch in the diastolic portion.
Figure 11a compares the HR and standard deviation of HR extracted from f_i_(t) (averaged from the three harmonics, see Equation (16) and Figure 3) between the two groups. Figure 11b compares the HR and standard deviation of HRV extracted from ϕ0i(t) (averaged from the three harmonics, see Equation (17) and Figure 3) between the two groups. Both HR and HR_ϕ_ do not differ between the two groups. Yet, SD (HR) in the AF group (lowest value: 0.23) is well above that in the non-AF group (highest value: 0.023). SD (HR_ϕ_) in the AF group is also large in the AF group (lowest value: 0.037), as compared to the non-AF group (highest value: 0.027).
Figure 12 compares the HRV extracted from f_i_(t) and ϕ0i(t) between the two groups. As shown in Figure 12a, RMSE (HR_i_) represents the toal HRV, accounting for both respiration and PF. Regardless of the harmonics, RMSE (HR_i_) is always larger in the AF group as compared to the non-AF group. While RMSE (HR_i_) remains nearly identical for all the harmonics in the non-AF group, it swings dramatically between the harmonics in the AF group. As shown in Figure 12b, RMSE (HR_ϕi_) represents the HRV accounting solely for respiration. Regardless of the harmonics, RMSE (HR_ϕi_) is always larger in the AF group as compared to the non-AF group. While RMSE (HR_ϕi_) remain very similar between the harmonics in the non-AF group, it swings greatly between the harmonics and does not display any changing trend with harmonic order.
Figure 12c compares RMSE (HR_i_) with RMSE (HR_ϕi_) in each group. From the physiological perspective, RMSE (HR_i_) should always be higher than RMSE (HR_ϕi_), in that the former accounts for both respiration and PF, whereas the latter accounts for only respiration. For some subjects in the AF group, RMSE (HR_ϕi_) is noticeably higher than RMSE (HR_i_), which can attribute to the relatively large effect of MA on f_i_(t). Theoretically, the difference between RMSE (HR_i_) and RMSE (HR_ϕi_) should represent the effect of PF on the HRV. However, given that (1) RMSE (HR_i_) is affected by MA and (2) this difference shown in Figure 12c is not substantial for all the subjects, the effect of MA on RMSE (HR_i_) cannot be neglected, rendering this difference unreliable. Consequently, it remains unclear which factor—respiration or PF—makes more of a contribution to HRV.
Figure 13 compared the HRV calculated in the time domain, in terms of RMSSD (Root Mean Square of Successive Differences), between the two groups based on the results in Figure 7 and Figure 8. As shown in Figure 13a, the calculated RMSSD from x0(t) and x1(t) is overall larger in the AF group as compared to the non-AF group. In particular, if the RMSSD from x1(t) is used for AF detection, only Subject 4 is a false positive. As shown in Figure A1 (see Appendix A), the reason for this subject being falsely positive is simply due to large MA in the PPG signal. As with RMSSD from x2(t), as pointed out earlier, its small amplitude makes it extremely sensitive to MA. As shown in Figure 13b, RMSSD from x0(t) is overall much larger than its counterparts from x1(t) and x2(t), which might stem from x_noise_(t) in x0(t).
Figure 14 compares the respiration rate (RR) extracted from f_i_(t) and ϕ_i_(t) of the three harmonics. Regardless of the harmonic or AF/non-AF status, the RR derived from ϕ_i_(t) is consistently higher than that obtained from f_i_(t). Since ϕ_i_(t) is more robust to MA than f_i_(t), respiration modulation (RM) is extracted exclusively from ϕ_i_(t). Notably, the extracted RR does not differ between harmonics for either the AF or the non-AF group. There is also no difference in RR between the two groups.
As shown in Figure 15, the respiration modulation (RM) of each harmonic is lower in the non-AF group compared to the AF group. Furthermore, RM remains relatively consistent across subjects in the non-AF group, whereas it varies substantially between subjects in the AF group. Interestingly, while RM in the non-AF group overall exhibits an increasing trend with harmonic order, such a trend is diminished in the AF group. Note that Subject 5 in the AF group exhibits the lowest RM, which is consistent with the other corresponding results: the lowest RMSE (HR_i_) and RMSE (HR_ϕi_) in Figure 12 and the small difference between x_tf_(t) and x_cf_(t) in Figure 9.
4. Discussion
The comparison of this method with related time–frequency approaches, as well as with machine learning and deep learning techniques, has been presented in [25] and is not repeated here. Briefly, compared with the other time–frequency approaches in the literature, the SDOF-TF method [25] is built upon the SDOF model of MA, which leads to the following findings regarding the effects of TVSP on instant parameters: (1) TVSP greatly swings the instant amplitude of each harmonic; (2) TVSP slightly affects the instant frequency of each harmonic; (3) TVSP has almost no effect on the instant initial phase of each harmonic; (4) the instant frequency of each harmonic carries both the respiration signal and PF; and (5) the instant initial phase of each harmonic carries only the respiration signal. Based on these findings, the SDOF-TF method was developed to extract the corresponding parameters for a pulse signal. Among all the studies that have evaluated signal-processing methods for AF detection using the same dataset, the proposed SDOF-TF method is, to the best of the authors’ knowledge, the first to achieve perfect AF detection accuracy. This section thus concentrates on the implications of the analyzed results and the limitations in the present study.
4.1. Implications of the Analyzed Results
4.1.1. Entangled MA, Noise, and HRV
The analysis in Section 3 reveals entangled relationships among MA, HRV, and noise. As shown in Figure 2, physiological condition appears both in MA and in the true pulse signal. In the true pulse signal, it manifests solely as HRV (i.e., time-varying frequency), whereas in MA (i.e., x_tvsp_(t)), it is complicated by the contributions of sensor fixture and the TCS stack. Nevertheless, as demonstrated in Figure 6 and Figure A1, the temporal variation in x_tvsp_(t) is dominated by physiological condition. Similarly, the noise in a PPG signal x_noise_(t) is correlated with the PPG signal itself and x_tvsp_(t). For the non-AF subject, the temporal variation in x_noise_(t) follows that of x_tvsp_(t), whereas for the AF subject, both x_noise_(t) and x_tvsp_(t) exhibit random time-varying behavior.
4.1.2. APW with Time-Varying HR Versus APW with Constant HR
As shown in Figure 4e, Figure 5e and Figure 9, and A2, large time-varying HR causes significant variation in APW between pulse cycles in the AF subjects, whereas small time-varying HR in the non-AF subjects translates to slight variation in APW between pulse cycles. To reveal the role of time-varying HR in APW, we reconstructed the APW with constant HR for both groups. As shown in Figure 5e and Figure 9b, and A2, large time-varying HR can greatly affect APW, as compared to its counterpart with constant HR.
Since the visual examination of the APW between AF and non-AF subjects does not reveal any distinguishing features, we further compare their normalized amplitudes and initial phases of the second and third harmonics, relative to the first harmonic. As illustrated in Figure 10, neither the amplitudes nor the initial phases of the harmonics effectively separate AF from non-AF subjects. Notably, in Subjects 2 and 4 of the AF group, the initial phase of the third harmonic exceeds that of the second harmonic (i.e., 03 > 02), which may explain the appearance of a notch in the systolic portion of the pulse cycle in the APW with constant HR. To further verify whether 03 > 02 underlies the appearance of the dicrotic notch in the systolic portion, Subjects 11, 14, and 15 with 03 > 02 in Figure 10b were analyzed. Their APWs with time-varying HR and constant HR show that only when 03 significantly exceeds 02 does time-varying HR contribute to preserving the dicrotic notch in the diastolic portion. These results suggest that time-varying HR contributes to maintaining the pulse waveform near its normal shape when the initial phase of the third harmonic is substantially higher than that of the second harmonic in an AF subject.
4.1.3. HR and HRV Derived from Instant Frequency and Instant Initial Phase
As shown in Equation (9), the instant frequency f_i_(t) of a harmonic accounts for both respiration and PF. Accordingly, the HR derived from f_i_(t) represents the total HR. In contrast, the HR derived from the instant initial phase ϕ_i_(t) excludes the contribution of PF to the HR. Yet, based on the SDOF model of MA [25], MA has almost no effect on ϕ_i_(t) but does influence f_i_(t) to some extent.
As shown in Figure 11a, the average HR HR derived from f_i_(t) of the three harmonics does not exhibit any clear difference between AF and non-AF subjects. In contrast, the standard deviation of HR SD (HR) across the harmonics effectively separates AF from non-AF subjects. As illustrated in Figure 4 and Figure 5, the effect of MA on f_i_(t) is similar across the harmonics. As such, the large SD (HR) observed in the AF group is believed to reflect the elevated HRV characteristic of AF. As shown in Figure 11b, the average HR HR_ϕ_ derived from ϕ_i_(t) shows no noticeable difference between the two groups. However, the standard deviation of HR SD (HR_ϕ_) provides clear separation between AF and non-AF subjects. This large SD (HR_ϕ_) in the AF group is believed to arise from substantial variation in respiration modulation (RM) across the harmonics, as evidenced in Figure 15.
As shown in Figure 13, the HRV RSSMD extracted in the time domain from x0(t) fails to effectively distinguish AF from non-AF subjects, highlighting the necessity of removing MA and noise. Even in the absence of noise, the HRV extracted from x1(t) misdiagnosed one non-AF subject due to large MA in the signal. These findings stress that the effective removal of MA and noise is critical for accurate AF detection using time-domain HRV.
4.1.4. Identified Indices for AF Detection and Observed Physiological Implications
In addition to SD (HR) and SD (HR_ϕ_), as shown in Figure 12, both the total HRV RMSE (HR_i_) derived from f_i_(t) and the HRV RMSE (HR_ϕi_) derived from ϕ_i_(t) demonstrate clear separation between AF and AF subjects for each harmonic. Furthermore, as illustrated in Figure 15, RM mean (B_ϕi_(t)) derived from ϕ_i_(t) also effectively distinguishes AF from non-AF subjects.
In summary, three categories of parameters extracted from an at-rest PPG signal can be used for AF detection:
- (1)SD (HR) and SD (HR_ϕ_);
- (2)RMSE (HR_i_) and RMSE (HR_ϕi_) of each harmonic;
- (3)mean (B_ϕi_(t)) of each harmonic.
The mean, standard deviation, median, and range of these indices are summarized in Table A4 in Appendix A, showing non-overlapping values between the AF and non-AF groups, whereas the other extracted parameters exhibit overlapping values between the two groups. These parameters serve as effective indices for AF detection, as each captures aspects of HRV within a PPG signal that is largely free of MA and noise.
Furthermore, three physiological implications emerge from this study:
- (1)AF increases RM for each harmonic;
- (2)AF disrupts the increasing trend of RM with harmonic order;
- (3)Elevated HRV contributes to maintaining the pulse waveform near its normal shape, when AF causes the initial phase of the third harmonic to significantly exceed that of the second harmonic.
Finally, it is worth noting that the increase in RM in AF does not necessarily indicate that respiration plays a more dominant role in determining HRV compared with PF.
4.2. Study Limitations
This study has six limitations. First, the complexity of optical transduction in a PPG sensor is substantially simplified. As demonstrated by the analyzed results, this simplification does not obscure the expected differences in HRV between AF and non-AF subjects. Second, the SDOF-TF method is applicable only to at-rest PPG signals and is unsuitable for wearable PPG signals (i.e., PPG signals recorded during activities). As described in [25], the frequency of MA during activities falls into the frequency range of the pulse signal itself and may vary between pulse cycles. Based on the SDOF model of MA, as seen in Equation (3), such MA will generate multiple signals at different frequencies and thus contaminate those harmonics whose frequencies are close to theirs [25]. Furthermore, activities can easily cause intermittent tissue–sensor contact, create nonlinearity in the TCS stack (manifested as abrupt changes in the pulse waveform), and severely distort pulse cycles.
Third, the nonlinearity of the TCS stack is neglected in the analysis. As long as there is no abrupt change in the pulse waveform of a PPG signal, tissue–sensor contact remains consistent, and the assumption of linearity in the TCS stack is practical. As noted in Section 2.2, segments of the PPG signals were selected to avoid abrupt changes. The results presented here indicate that this assumption does not affect the identification of indices for AF detection. It is worth noting that the analysis of PPG signals with abrupt changes may increase the risk of false-positive detections. False-negative detections are unlikely unless the PPG sensor malfunctions.
Fourth, no comparison of the SDOF-TF method with other time–frequency methods reported in the literature was conducted. Since the SDOF-TF method achieves 100% detection accuracy, such a comparison was deemed unnecessary. Fifth, the sample size of the dataset is small. In future work, the identified indices for AF detection and the observed physiological implications will need to be further validated using datasets with larger sample sizes.
Lastly, the effect of the system parameters m0, k0, and c0 of the TCS stack on a PPG signal is not explored. Based on its working principle [25], the SDOF-TF method is applicable to various sensor types: tactile sensors, accelerometers, PPG sensors, and even an ultrasound probe for measuring radial arterial wall displacement [31]. As illustrated in Figure 2, the nominal values of m0, k0, and c0 represent the collective behavior of the sensor, contact pressure, and the individual (i.e., tissue). Clearly, TVSP—m(t), k(t), and c(t)—of the TCS stack is related not only to baseline drift (BD) but also to m0, k0, and c0. At the same time, BD is also related to m0, k0, and c0 as well as the individual (i.e., physiological condition). All these system parameters of the TCS stack vary with sensor type, individual, and contact pressure. For instance, high contact pressure translates to low BD and, consequently, low TVSP. Th effect of contact pressure on a measured pulse signal is multifaceted, and a detailed discussion can be found in the literature [25,26,27,28,31]; it is beyond the scope of this study. Given that there are six unknowns but only one measured pulse signal, there is currently no method for identifying their exact values. However, as demonstrated in this study, not knowing the values of these parameters does not affect the removal of the MA and noise of a PPG signal for AF detection.
5. Conclusions
In this study, the SDOF-TF method was applied to at-rest PPG signals from the MIMIC PERform AF dataset to evaluate its effectiveness in removing MA and noise and detecting AF. The arterial pulse waveform (APW)—characterized by normalized amplitudes and relative initial phase differences with respect to the first harmonic—was found to be ineffective in distinguishing AF from non-AF subjects. In contrast, three categories of time–frequency parameters enabled AF detection with 100% accuracy: (1) respiration modulation (RM), (2) total HRV derived from instant frequency and HRV attributable solely to respiration derived from instant initial phase, and (3) the standard deviation of total HR and HR accounting solely for respiration across harmonics.
Compared with non-AF subjects, RM was increased in AF subjects. RM exhibited an increasing trend with harmonic order in the non-AF group, whereas this trend was diminished in the AF group. Elevated HRV was also found to contribute to maintaining the pulse waveform near its normal shape (i.e., the dicrotic notch in the diastolic portion) in those AF subjects where the initial phase of the third harmonic substantially exceeds that of the second harmonic.
The reference list from the paper itself. Each links out to its DOI / PubMed record.
- 1Aschbacher K. Yilmaz D. Kerem Y. Crawford S. Benaron D. Liu J. Eaton M. Tison G.H. Olgin J.E. Li Y. Atrial fibrillation detection from raw photoplethysmography waveforms: A deep learning application Heart Rhythm O 2202013910.1016/j.hroo.2020.02.00234113853 PMC 8183963 · doi ↗ · pubmed ↗
- 2Bashar S.K. Han D. Hajeb-Mohammadalipour S. Ding E. Whitcomb C. Mc Manus D.D. Chon K.H. Atrial Fibrillation Detection from Wrist Photoplethysmography Signals Using Smartwatches Sci. Rep.201991505410.1038/s 41598-019-49092-231636284 PMC 6803677 · doi ↗ · pubmed ↗
- 3Yin Z. Liu C. Xie C. Nie Z. Wei J. Zhang W. Liang H. Identification of Atrial Fibrillation Using Heart Rate Variability: A Meta-Analysis Front. Cardiovasc. Med.202512158168310.3389/fcvm.2025.158168340612371 PMC 12222138 · doi ↗ · pubmed ↗
- 4Park J. Seok H.S. Kim S.S. Shin H. Photoplethysmogram Analysis and Applications: An Integrative Review Front. Physiol.20221280845110.3389/fphys.2021.80845135300400 PMC 8920970 · doi ↗ · pubmed ↗
- 5Pereira T. Tran N. Gadhoumi K. Pelter M.M. Do D.H. Lee R.J. Colorado R. Meisel K. Hu X. Photoplethysmography-Based Atrial Fibrillation Detection: A Reviewnpj Digit. Med.20203310.1038/s 41746-019-0207-931934647 PMC 6954115 · doi ↗ · pubmed ↗
- 6Lee Y. Lee S. Kim S.K. Yon D.K. Nam Y. Lee J. Cooperative PPG/ECG Wearable System for Atrial Fibrillation Diagnosis IEEE Sen. J.2025257331734410.1109/JSEN.2025.3526245 · doi ↗
- 7Charlton P.H. Kotzen K. Mejía-Mejía E. Aston P.J. Budidha K. Mant J. Pettit C. Behar J.A. Kyriacou P.A. Detecting Beats in the Photoplethysmogram: Benchmarking Open-Source Algorithms Physiol. Meas.20224308500710.1088/1361-6579/ac 826d PMC 939390535853440 · doi ↗ · pubmed ↗
- 8Pedrosa-Rodriguez A. Camara C. Peris-Lopez P. Leveraging Io T Devices for Atrial Fibrillation Detection: A Comprehensive Study of AI Techniques (99%)Appl. Sci.202414894510.3390/app 14198945 · doi ↗