Morphology and Comparative Transcriptome Analysis of Resistant and Susceptible Bitter Gourd (Momordica charantia L.) Reveals the Molecular Response Related to Powdery Mildew Resistance
Lei Xia, Kai Wang, Feng Guan, Bo Shi, Xuetong Yang, Yuanyuan Xie, Xinjian Wan, Jingyun Zhang

TL;DR
This study identifies genes and pathways involved in powdery mildew resistance in bitter gourd using transcriptome analysis and morphology.
Contribution
The study reveals specific genes and pathways linked to powdery mildew resistance in bitter gourd through comparative transcriptome analysis.
Findings
Resistant and susceptible bitter gourd cultivars showed distinct gene expression patterns after powdery mildew infection.
DEGs were enriched in plant-pathogen interaction and hormone signaling pathways.
MLO gene Moc10g30350.1 is potentially involved in powdery mildew resistance.
Abstract
Powdery mildew (PM) is a major disease affecting bitter gourd cultivation, and resolving the molecular regulatory mechanisms underlying PM resistance is important for bitter gourd molecular breeding for resistance. In this study, morphological and molecular methods were used to identify the PM pathogen in bitter gourd, and comparative transcriptome analysis was performed on leaves of the resistant cultivar R and the susceptible cultivar S after PM infection. The morphological and molecular identification results showed that the PM pathogen in bitter gourd was Podosphaera xanthii. Scanning electron microscopy results revealed that the P. xanthii exhibited distinct growth patterns in the R and S after P. xanthii infection. Compared to the S, the R exhibited 3966, 2729, 5891, and 3878 differentially expressed genes (DEGs) at 0, 2, 3, and 4 days after P. xanthii infection, respectively.…
Genes, proteins, chemicals, diseases, species, mutations and cell lines named across the full text — each resolved to its canonical identifier and authoritative record.
Click any figure to enlarge with its caption.
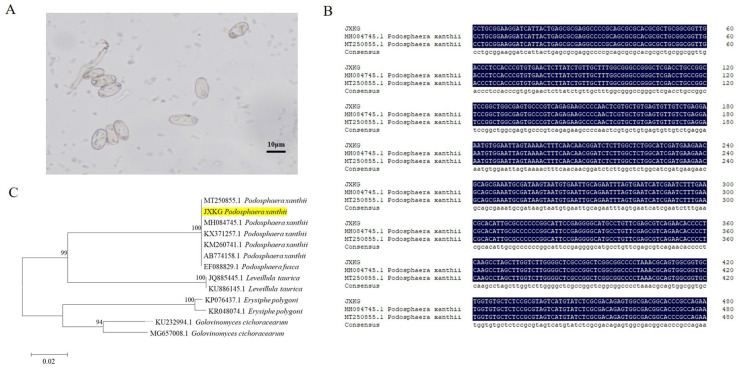 Figure 1
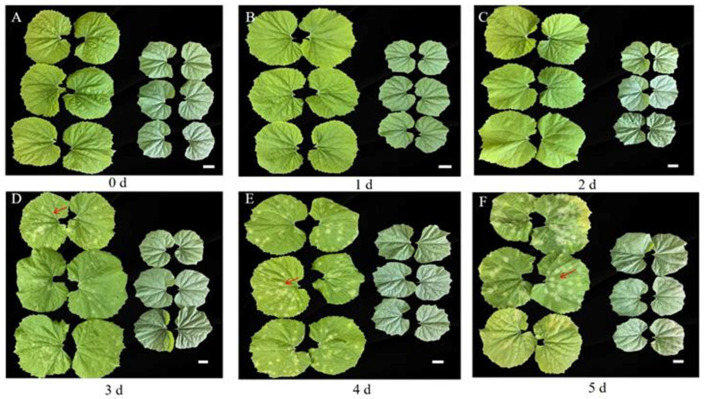 Figure 2
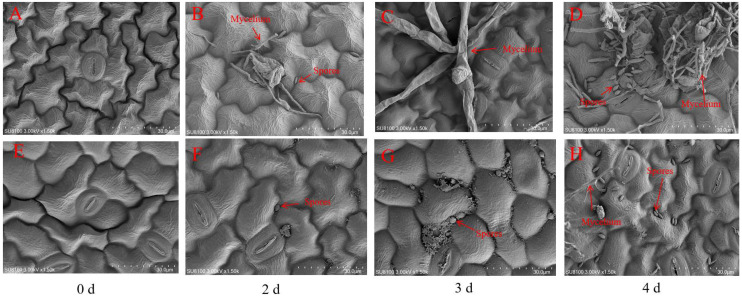 Figure 3
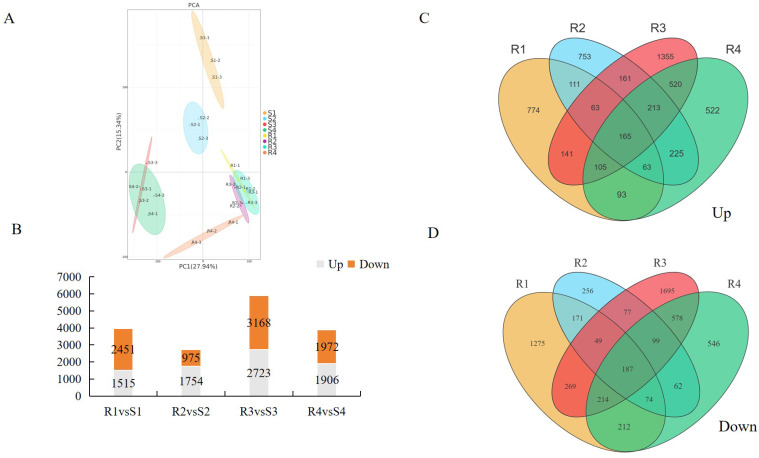 Figure 4
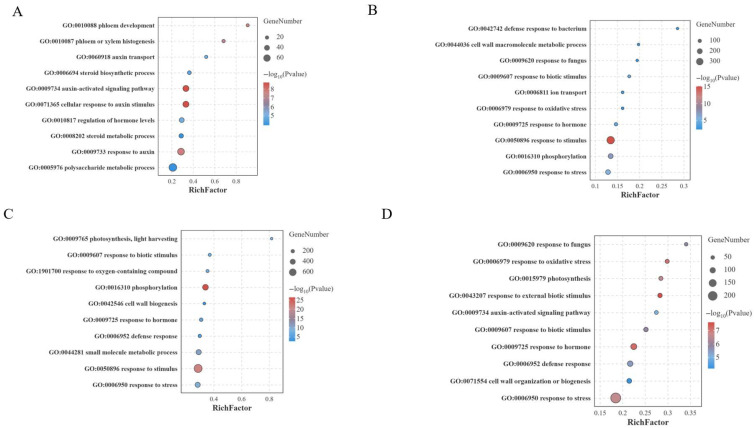 Figure 5
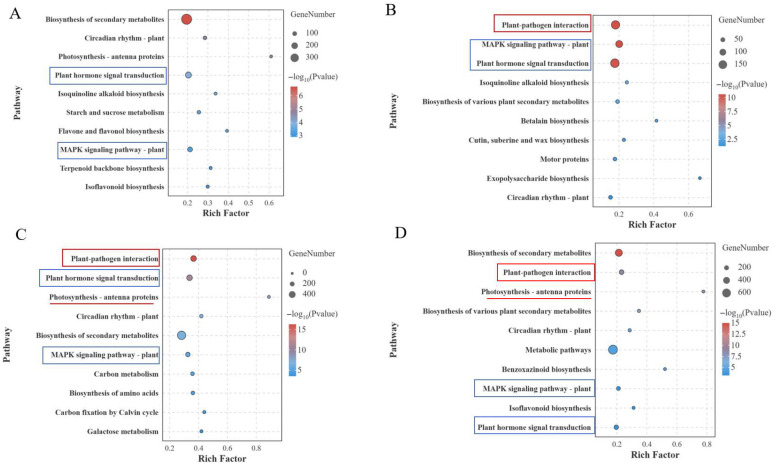 Figure 6
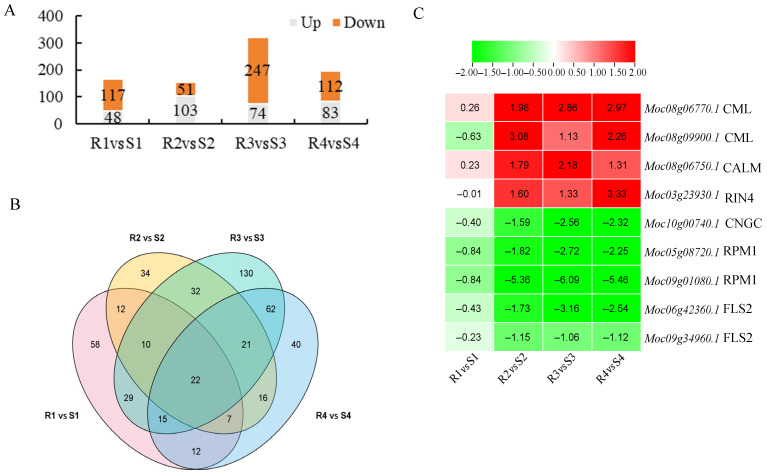 Figure 7
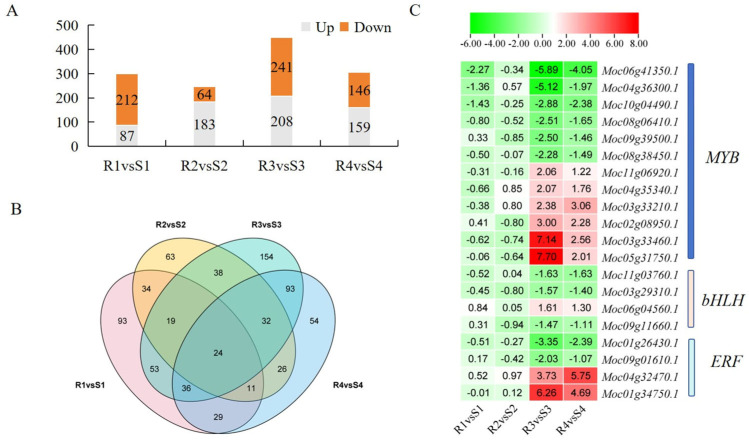 Figure 8
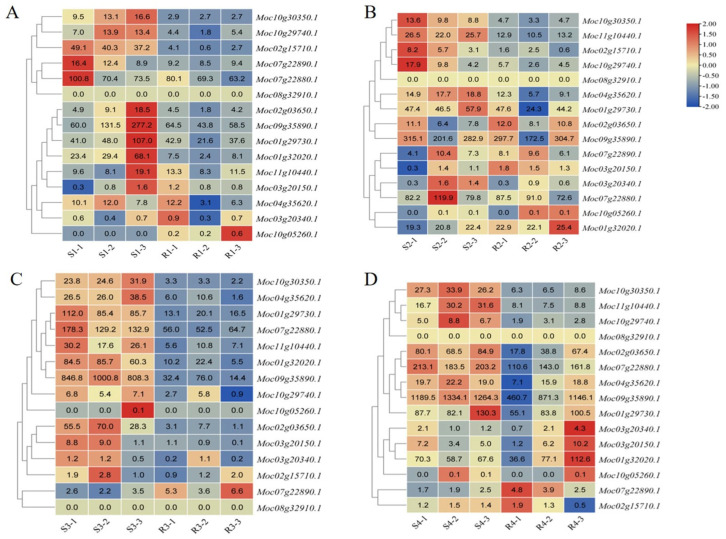 Figure 9
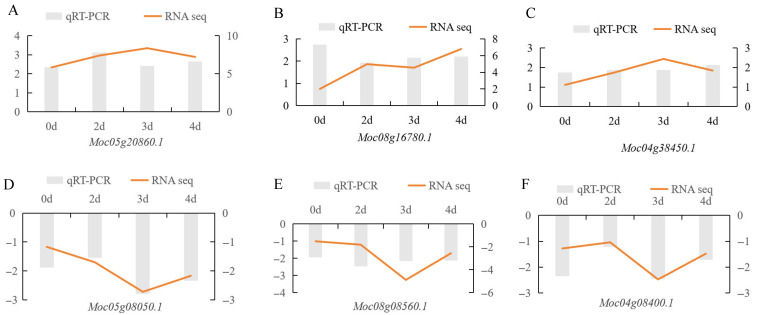 Figure 10
- —Basic Research Project of Jiangxi Academy of Agricultural Sciences
- —China Agriculture Research System of MOF and MARA
Peer Reviews
No public reviews on file for this paper yet. If you reviewed it on a platform where reviews are public (OpenReview, ICLR, NeurIPS, ICML), you can paste yours below so the community can read it here.
Videos
No videos yet. Explain this paper in a talk, walkthrough, or lecture? Add one.
Taxonomy
TopicsAdvances in Cucurbitaceae Research · Powdery Mildew Fungal Diseases · Plant Pathogens and Resistance
1. Introduction
Powdery mildew (PM) is a common fungal disease, frequently occurring in crops such as rice [1], wheat [2], peppers [3], grapes [4], and melons [5], which is important for crop yield and quality [6]. PM typically begins on lower, older leaves, which causes the appearance of small, circular, white, powdery fungal spots on the leaf surface [7]. These spots could affect photosynthesis in plant leaves, reducing the crop yield and quality. Early microscopic studies revealed that the leaf spots caused by PM were fungal colonies, which were composed of fungal mycelium and conidiophores [8]. PM is one of the common diseases in cucurbit plants, which limits the high-quality production of cucurbit crops [9]. It is shown that PM in cucurbit crops is primarily caused by the biotrophic fungi Podosphaera xanthii and Golovinomyces cichoraceum [10]. Among these, Pdosphaera xanthii was found to be predominant in tropical and subtropical regions, while G. cichoracearum dominated in temperate zones [11]. Due to climatic and geographical variations, P. xanthii has evolved multiple races, such as races 1–3 and S in the USA [12]. Owing to the pathogen’s high genetic variability and adaptability, variety resistance could lose. Therefore, identifying PM physiological races and understanding the molecular mechanisms of host resistance could be important for PM resistance breeding.
There are two immune systems in plants against PM infection: pathogen-associated molecular pattern-induced immunity (PTI) and effector-induced immunity (ETI) [13]. As the first line of defense, PTI could be initiated by pattern recognition receptors (PRRs) on the plant surface and within cells, including FLS2 [14] and EFR [15]. It has been revealed that PTI could regulate PM resistance by activating the MAPK cascade, inducing Ca^2+^ influx, and triggering RBOHD-mediated ROS bursts [16,17]. Among these, transcription factors such as bHLH [18], MYB [19], and WRKY [20] could participate in the PTI process, and consequently regulate the expression of PM resistance genes in plants. For example, in grapes, VqWRKY56 has been shown to regulate resistance to PM, and overexpression of VqWRKY56 could enhance PM resistance through ROS accumulation [21]. Furthermore, it has been found in multiple species that MLO genes are widely involved in plant growth, development, and stress responses: particularly PM resistance [22]. Silencing or knocking out specific MLO genes could confer PM resistance in plants. For example, knocking out four genes (Gmmlo02, Gmmlo19, Gmmlo20, and Gmmlo23) could significantly enhance soybean resistance to PM [23].
Bitter gourd (Momordica charantia L.) belongs to the Cucurbitaceae, which is a vegetable crop with significant medicinal value, such as anti-diabetic, anti-obesity, antioxidant, and blood lipid-lowering properties [24,25,26]. Bitter gourd is mainly cultivated in tropical and subtropical regions, where high humidity and temperature often cause PM [27]. The occurrence of PM resulted in leaf disease, affecting photosynthesis and reducing the yield of bitter gourd. In bitter gourd cultivation, chemical control was the main approach to managing PM, but it led to increased production costs and environmental pollution. Developing resistant bitter gourd varieties through molecular selective breeding is one important strategy for controlling PM occurrence. Uncovering the molecular mechanisms’ underlying resistance to PM and identifying key genes involved in the response to PM could be important for molecular breeding of PM resistance in bitter gourd.
With the rapid advancement of next-generation sequencing (NGS) technology, transcriptomics has been widely applied in studying the defense genes and molecular regulatory mechanisms involved in the response to plant pathogens [28]. For example, through the transcriptome analysis, Zhang et al. found pathways including starch and sucrose metabolism, photosynthesis, and fatty acid metabolism, which could be involved in the PM resistance process of ‘BlackJack’ [29]. Liu et al. conducted transcriptome analysis, and found that the phenylpropanoid biosynthesis and flavonoid biosynthesis pathways were involved in the PM resistance from inbred line ‘63187’ [30]. Ba et al. identified that allantoin and jasmonic acid could mediate the resistance response to PM in melon [31].
In this study, morphological and molecular biological identification of PM pathogens in bitter gourd leaves were conducted. The differences in leaf morphology between resistant materials, R, and susceptible materials, S, at different periods after PM infection were investigated by using scanning electron microscopy. Moreover, transcriptome analysis was conducted to identify differentially expressed genes (DEGs) and key pathways involved in the PM response. These findings could contribute to understanding the molecular mechanisms underlying bitter gourd resistance to PM, which would provide a theoretical basis for developing PM-resistant cultivars in bitter gourd.
2. Materials and Methods
2.1. Identification and Phylogenetic Analysis of PM Pathogen
The leaves of bitter gourds that were naturally infected with PM were collected. Following the method of Duan et al. [32], the PM pathogen was purified. A single white spot was selected and placed in 0.5 mL of 0.3% KOH solution. The mixture was spotted onto a microscope slide and observed under an optical microscope (Olympus, Tokyo, Japan) to investigate the morphology of the PM pathogen.
For molecular identification of the PM pathogen, ITS primers (Table S1) were used to PCR amplify the ITS sequence from the bitter gourd PM pathogen. The PCR program was 94 °C for 5 min, followed by 35 cycles of 94 °C for 30 s, 55 °C for 30 s, and 72 °C for 45 s, an amplification of 72 °C for 10 min, and final storage at 4 °C. The PCR reaction volume was 20 μL, comprising 2 μL DNA template, 1 μL F primer, 1 μL R primer, 10 μL PrimeSTAR^®^ Max DNA Polymerase high-fidelity DNA polymerase, and 6 μL ddH_2_O. Moreover, sequences were downloaded from the NCBI database for P. xanthii, G. cichoracearum, Erysiphe polygoni, and Leveillula taurica to perform phylogenetic analysis. Multiple sequence alignment was performed by DNAMAN (Lynnon Corporation, Vaudreuil-Dorion, QC, Canada), and a phylogenetic tree was constructed using MAGE v11 software [33], based on the neighbor–neighbor method.
2.2. Plant Materials and Treatment
The PM-resistant variety, R, and susceptible variety, S, of bitter gourd were preserved in the Vegetables and Flowers Research Institute of the Jiangxi Academy of Agricultural Sciences. After germination, seeds were sown in 32-cell trays, and soil was prepared with a mixture of peat, perlite, and fertilizer at a ratio of 6:3:1. Subsequently, they were placed in a plant-growth room, where the environment was set to 26 °C for 14 h light and 20 °C for 10 h dark. When seedlings reached the two-leaf stage, 1 × 10^6^/mL spore suspension was prepared and sprayed onto bitter gourd leaves using a spray bottle. Leaf samples were collected at 0 d, 2 d, 3 d, and 4 d after PM inoculation, rapidly frozen in liquid nitrogen, and stored at −80 °C. Three biological replicates were taken at each period.
2.3. Scanning Electron Microscope
Leaf samples were collected at 0 d, 2 d, 3 d, and 4 d after PM inoculation, cut into 5 mm pieces, and placed in the electron microscope fixative (Glutaraldehyde, 2.5% (EM Grade)). Samples were then fixed at 4 °C for at least 24 h. The samples were then washed three times with 0.1 M phosphate buffer (pH = 7.0), followed by immersion in tert-butanol mixtures containing 50%, 70%, 80%, and 90% ethanol for 1 h each. Finally, samples underwent freeze-drying and gold sputtering. Finally, PM fungi on the leaves of each material were microscopically observed using a scanning electron microscope SU8100 (HITACHI, Tokyo, Japan).
2.4. RNA-Seq Analysis
Total RNA was extracted using the Trizol from the leaves of PM-resistant variety R and susceptible variety S after PM inoculation with 3 replications. The concentration and integrity of RNA was accurately detected by NanoDrop 2000 spectrophotometer (Thermo Fisher Scientific, Waltham, MA, USA) and Agilent 2100 Bioanalyzer (Agilent Technologies, Santa Clara, CA, USA). All RNA samples exhibited RIN values ≥ 6, which could meet sequencing requirements. The mRNA of each library was sequenced on the MGI sequencing platform, located at Wuhan Benagen Tech Solution Co., Ltd. (Wuhan, China; http://www.benagen.com). The raw data were quality-controlled by Fastqc [34]. The reference genome was downloaded from bitter gourd (OHB3-1 v2) from the Cucurbit Genome Database version 2 (http://cucurbitgenomics.org/v2/, accessed on 7 January 2026). The clean data were aligned to the reference genome by Hisat2 v2.2.1 [35]. The expressions of individual genes were counted by the featureCounts [36]. Expression values were normalized by converting them to fragments per million (FPKM). Leaf samples from susceptible bitter gourd S plants at 0 days, 2 days, 3 days, and 4 days after P. xanthii infection were used as controls. DESeq2 v1.34.0 [37] was used to find the differentially expressed genes (DEGs). DEGs identification employs FDR correction via the Benjamini–Hochberg method, filtering results based on FDR < 0.05 and |log_2_FC| ≥ 1 to strictly control false positives.
2.5. Analysis of the MLO Gene
To obtain the MLO gene from bitter gourd, the hidden Markov model (HMM) for the MLO protein domain (PF03094) was downloaded from the Pfam database. The bitter gourd (OHB3-1 v2) protein sequences were downloaded from the Cucurbit Genome Database version 2 (http://cucurbitgenomics.org/v2/, accessed on 7 January 2026). The HMMER3.0 search tool from Tbtools [38] was used to identify MLO genes in bitter gourd. The candidate Mlo protein domains were further checked by the NCBI conserved structural domain database (NCBI-CDD, https://www.ncbi.nlm.nih.gov/cdd/). Based on the above transcriptome data analysis results, the expression levels of MLO genes at different periods in time were plotted by TBtools software [38].
2.6. qRT-PCR Analysis
The primers for qRT-PCR (Table S1) were used by the Primer-BLAST program in NCBI. Moc02g21040.1 (Actin) was selected as the reference gene. qRT-PCR was performed in a 96-well plate, using a BIO-RAD CFX96 Touch Real-Time PCR Detection System (Applied Biosystems, San Francisco, CA, USA) with SYBR Green PCR Master Mix. The qRT-PCR amplification was 94 °C for 10 min, followed by 40 cycles of 94 °C for 5 s and 65 °C for 30 s. The gene expression level was calculated by 2^−ΔΔCt^ [39] with three biological and three technical replicates.
2.7. Statistical Analysis
The result for each sample is shown as mean ± standard deviation (SD) from three replicates, which was analyzed by Excel. A two-tailed Student’s t-test was used to analyze the significance of differences. p value < 0.05 (*) and p value < 0.01 (**) were regarded as significant.
3. Results
3.1. Identification of PM Pathogen in Bitter Gourd Leaves
To investigate the type of PM pathogen in bitter gourd, morphological observations and molecular identification of the PM pathogen were conducted. The microscopic observation results revealed that the conidia of the bitter gourd PM pathogen were all ellipsoidal, colorless, unicellular, and well-developed hyphae (Figure 1A), which could be identified as PM fungus of cucurbits. ITS sequence analysis revealed that the PM pathogen sequence from bitter gourd was identical to P. xanthii sequences from pumpkin (MT250855.1) and squash (MH084745.1) (Figure 1B), which were P. xanthii. Phylogenetic analysis results showed that the PM pathogen sequence from bitter gourd clustered with P. xanthii sequences from pumpkin (Figure 1C), which proved that the PM pathogen in bitter gourd was P. xanthii.
3.2. Phenotypic Changes and Microscopic Observation in Bitter Gourd Leaves After P. xanthii Infection
To understand the dynamic changes in P. xanthii infection of bitter gourd leaves, the phenotypes of bitter gourd R and S materials were observed and compared at different periods after P. xanthii infection. The results showed that there was no significant phenotypic difference between R and S material plants at 0–2 days after infection (Figure 2A–C). On the third day, S material leaves exhibited small white spot sand and PM infection symptoms, while R material leaves remained without white spots (Figure 2D). At 4–5 days, PM symptoms progressively worsened on S material leaves, and the white spots on leaves increased (Figure 2E,F). However, the R material still showed no obvious disease symptoms at 4–5 days. Therefore, it is concluded that the R material exhibits obvious resistance to PM.
Additionally, scanning electron microscopy (SEM) observations were conducted on R and S leaves at 0 d, 2 d, 3 d, and 4 d after P. xanthii infection. The results showed that at 0 d, R and S leaf cells appeared smooth with clearly visible stomata and no hyphal growth (Figure 3A,E). As the infection time progressed, S leaves exhibited minor hyphal growth on the second day (Figure 3B), while only 1–2 spores were observed in R leaves (Figure 3F). On the third day, abundant hyphae were observed in the S material (Figure 3C), while only a few spores were noted in the R material (Figure 3G). On the fourth day, when PM erupted in the S material, a large number of spores and mycelium were clearly visible (Figure 3D). However, only a few spores and minimal mycelium were observed in the R material (Figure 3H). Therefore, it is considered that R should exhibit marked resistance to PM.
3.3. Transcriptomic Data Analysis of Bitter Gourd Leaves After P. xanthii Infection
To reveal the molecular mechanisms underlying the differing resistance to PM between R and S, RNA-seq technology was employed to investigate the gene expression profiles at 0 d, 2 d, 3 d, and 4 d after P. xanthii infection. Each sample was subjected to three biological replicates, and a total of 24 cDNA libraries were generated (Table 1). Each library obtained an average of 6.28 Gb of clean reads, and the Q30% exceeded 97.80% (Table 1). Approximately 89.43% to 97.43% of clean reads mapped to the bitter gourd reference genome, where 80.98% to 93.32% mapped uniquely and 1.97% to 10.58% mapped to multiple locations (Table 1). The principal component analysis (PCA) results revealed high replication among samples within R and S (Figure 4A).
To analyze the molecular and biological functions of DEGs, GO and KEGG enrichment analyses, the analysis of differential expression genes (DEGs) was performed using log_2_|FoldChange| ≥ 1 and p value < 0.05 as parameters between different samples (Tables S2–S5). The results for DEGs at different periods showed that compared to the S material, R contained 3966 DEGs (1515 upregulated genes and 2451 downregulated genes) (Table S2), 2729 DEGs (1754 upregulated and 975 downregulated) (Table S3), 5891 DEGs (2723 upregulated and 3168 downregulated) (Table S4), and 3878 DEGs (1906 upregulated and 1972 downregulated) (Table S5), respectively (Figure 4B). Among these, the highest number of DEGs occurred on the third day, which was the powdery mildew attack stage in the S material. Cluster analysis of DEGs revealed that in the four stages, 165 genes were significantly upregulated in the R material (Figure 4C), while 187 genes were significantly downregulated in the R material (Figure 4D).
3.4. GO and KEGG Enrichment Analysis of DEGs
To analyze the molecular and biological functions of DEGs, GO and KEGG enrichment analyses were performed. GO analysis revealed that at 0 days, DEGs were primarily enriched in auxin-related pathways (auxin-activated signaling pathway (GO:0009734), auxin transport (GO:0060918), and response to auxin (GO:0009733)) and steroid metabolism processes (GO:0008202) (Figure 5A). During the period of P. xanthii infection, the DEGs were predominantly enriched in multiple stress-related GO pathways, including response to stimulus (GO:0050896), response to stress (GO:0006950), response to biotic stimulus (GO:0009607), defense response (GO:0006952), and cell wall biosynthesis (GO:0042546) (Figure 5B–D). As PM spread incessantly in susceptible material S, photosynthesis in leaves was also affected. On the third and fourth days, DEGs were enriched in GO pathways related to plant photosynthesis, such as photosynthesis, light harvesting (GO:0009765), and photosynthesis (GO:0015979) (Figure 5C,D).
The KEGG enrichment results showed that DEGs were enriched in two pathways at four periods, including plant hormone signaling transduction pathways and the MAPK signaling pathway plant (Figure 6). In plant hormone signaling transduction pathways, JA-related genes (Moc01g33300.1 and Moctig17757g030.1) were upregulated, and auxin-related genes (Moc06g25830.1 and Moc03g03590.1) were downregulated in R as powdery mildew inoculation period increased (Figure S1), which implied that plant hormones might be involved in regulating plant disease resistance. Furthermore, the results were validated by qRT-PCR (Figure S1). As the inoculation of PM progressed, DEGs were significantly enriched in plant–pathogen interaction pathways on the second, third, and fourth days (Figure 6B–D). As the P. xanthii spread on the S material, the DEGs also showed partial enrichment in photosynthesis–antenna proteins–plants at third and fourth days (Figure 6C,D). Collectively, these findings reveal distinct genetic and pathway differences in the resistant and susceptible material after P. xanthii infection.
Plant–pathogen interactions are associated with plant defense mechanisms. In this study, significant divergence was observed between R and S materials in the plant–pathogen interaction pathway after P. xanthii infection. The 190, 159, 309, and 179 DEGs were identified in the plant–pathogen interaction pathway at 0 d, 2 d, 3 d, and 4 d, respectively (Figure 7). Cluster analysis results showed that 14 DEGs were present on the second, third, and fourth days after P. xanthii infection (Figure 7B). Among these, calcium-binding proteins (CML, Moc08g06770.1 and Moc08g09900.1) and calmodulin (CaM, Moc08g06750.1) exhibited significant upregulation in R leaves. Conversely, serine/threonine protein kinase (FLS2, Moc06g42360.1, and Moc09g34906.1), plant immune receptor protein (RPM1, Moc05g08720.1 and Moc09g01080.1), and cyclic nucleotide-gated channels (CNGCs, Moc10g00740.1) exhibited significant downregulation in R leaves (Figure 7C). These findings implied that the defense response of R material against P. xanthii could be guided by CaM/CML-mediated signal transduction. Interestingly, we found that at 0 days, compared to S material, R material exhibited a downregulated expression of genes associated with FLS2, while genes related to CML were upregulated (Figure S2). These results proved that R and S materials themselves exhibit significant differences in the expression of disease resistance genes in the plant–pathogen interaction pathway, which lead to differences in plant PM resistance.
3.5. TF Analysis Involved in Regulation of PM Resistance
Transcription factors (TFs) have an important role in regulating plant disease resistance. In this study, 299, 247, 449, and 305 differentially expressed TFs were identified at 0 d, 2 d, 3 d, and 4 d, respectively (Figure 8A). Among them, the highest number of differentially expressed TFs occurred on the third day after P. xanthii infection, including 208 upregulated TFs and 241 downregulated TFs. Cluster analysis of differentially expressed TFs revealed that 24 TFs were present in all four periods (Figure 8B), including B3 (1), bHLH (2), bZIP (2), C2H2 (1), C3H (4), HD-ZIP (1), HSF (2), MADS (2), MYB (2), RAV (1), SBP (2), SBP (1), Trihelix (2), and WRKY (1). As PM disease progressed in the S material, the number of differentially expressed TFs gradually increased. On the third and fourth days, 93 uniquely present differentially expressed TFs were identified. Analysis of these 93 TFs revealed that they primarily belonged to three categories—MYB, bHLH, and ERF TFs (Figure 8C)—which might be involved in the PM resistance process of R material.
3.6. MLO Genes Related to PM Resistance
MLO genes play a crucial role in plant resistance to PM. In this study, a total of 15 MLO genes were identified in bitter gourd (Figure 9). At the 0 d stage, compared to the S material, MLO genes were generally downregulated in the R material, including significantly down-expressed genes such as Moc10g30350.1, Moc02g15710.1, and Moc01g32020.1 (Figure 9A). As P. xanthii infection progressed in leaves, transcription levels of MLO genes in the R material showed significant reduction. On the third day, most MLO genes in the R material showed significantly downregulated expression compared to the S material, including Moc10g30350.1, Moc02g03650.1, Moc04g35620.1, Moc01g29730.1, Moc03g20150.1, Moc01g32020.1, and Moc09g35890.1 (Figure 9C). Furthermore, it was found that during the PM outbreak period (third and fourth days) in the S material, Moc10g30350.1 exhibited significantly lower expression in R material (Figure 9C,D), which might be involved in regulating PM resistance in the R material.
3.7. qRT-PCR Validation
To validate the accuracy of RNA-seq data, six DEGs (Moc05g20860.1, Moc08g16780.1, Moc04g38450.1, Moc05g08050.1, Moc08g08560.1, and Moc04g08400.1) were selected for qRT-PCR analysis (Figure 10). Results showed that three genes (Moc05g20860.1, Moc08g16780.1, and Moc04g38450.1) that were significantly upregulated in the R material by RNA-seq were also significantly upregulated in qRT-PCR (Figure 10A–C). Similarly, three genes (Moc05g08050.1, Moc08g08560.1, and Moc04g08400.1) that were significantly downregulated in the R material by RNA-seq were significantly downregulated in qRT-PCR (Figure 10D–F). The expression trends of these DEGs in qRT-PCR were consistent with RNA-seq results, which fully demonstrated the repeatability of the RNA-seq data.
4. Discussion
PM is a devastating fungal disease, which is a major factor affecting yields in cucurbit crops such as bitter gourd [27], cucumber [40], watermelon [41], and pumpkin [42]. PM infection could also reduce photosynthetic efficiency, induce leaf chlorosis and necrosis, disrupt metabolite synthesis, and, finally, affect fruit’s appearance and nutritional content [43]. As a member of the cucurbit crops, bitter gourd is mainly cultivated in tropical and subtropical regions, where it is frequently affected by PM. It is important to investigate the resistance mechanisms against PM in bitter gourd for disease-resistance breeding. In this study, physiological races of PM pathogen affecting bitter gourd were identified through morphological and molecular characterization, and phenotypic changes and RNA-seq analysis were conducted in two bitter gourd cultivars, which could provide a foundation for resistance breeding in bitter gourd.
From a taxonomic perspective, PM pathogen covered 18 genera and 873 species, including Podosphaera, Erysiphe, and Golovinomyces [8]. Due to evolutionary adaptation, pathogenic gene mutations, and horizontal gene transfer, unique physiological races could emerge in different geographical regions [12]. As a result of differences in PM pathogen physiological races, hosts exhibit distinct resistance levels to different PM physiological races [44]. The accurate identification of PM pathogens and their physiological strains would be critical for the effective management of PM. In this study, a comprehensive approach combining microscopic observation and molecular identification was employed to characterize the PM pathogen infecting bitter gourd. Morphological analysis under light microscopy revealed typical PM characteristics: transparent, oval conidia with septate, and branched hyphae. Molecular identification results showed that the PM pathogen in bitter gourd shared 100% homology with reference sequences (MT250855.1 and MH084745.1), which was classified into the P. xanthii clade. These findings confirmed that P. xanthii was the pathogen responsible for PM disease in bitter gourd.
The response process of plants to P. xanthii infection is highly complex and regulated by multiple factors [45]. In this study, two bitter gourd materials (susceptible material S and resistant material R) were used. Phenotypic analysis at different periods after P. xanthii infection revealed no obvious disease symptoms in either material during 0–2 d. Therefore, RNA-seq was performed at four periods (0 d, 2 d, 3 d, and 4 d) to evaluate their responses to PM. Transcriptome results revealed that the number of DEGs significantly increased on the third day compared to the second day with the P. xanthii infection, which might be attributed to the emergence of obvious PM symptoms in the susceptible material S on the third day. GO enrichment analysis revealed that DEGs on the second, third, and fourth days after P. xanthii infection were significantly enriched in pathways including response to stimulus, response to stress, response to biotic stimulus, defense response, and cell wall biogenesis. These GO pathways were consistent with the previous findings in melon [27] and cucumber [46] after PM inoculation. KEGG enrichment analysis revealed that plant–pathogen interaction pathways were significantly enriched after P. xanthii infection. As powdery mildew spots increased in susceptible material S, photosynthesis-related pathways were significantly inhibited, and photosynthesis-related gene expression was significantly downregulated. As key components of plant–pathogen interaction pathways, CaM and CML could participate in plant growth and development as well as various stress responses, including the regulation of plant disease resistance [17]. In this study, the DEGs of CaM and CML were found to be numerous during the PM onset period in susceptible material S. Notably, both the CaM and CML genes were significantly upregulated in resistant material, which indicated that the calcium signaling pathway could act as a positive regulator of PM disease resistance. The SEM analysis of the R at 3–4 days revealed inhibited fungal hyphal elongation. During this period, transcriptomic enrichment in cell wall biogenesis, response to fungus, the MAPK signaling pathway, and plant–pathogen interactions directly suppressed fungal growth by strengthening the cell wall barrier, synthesizing antimicrobial substances, and regulating defense gene expression.
A number of studies have demonstrated that TFs could participate in the regulation of plant responses to various pathogenic microorganisms by activating different signaling pathways [47]. Among them, TFs such as WRKY [48], NAC [49], ERF [50], and bHLH [18] have been reported in multiple crop disease resistance studies. In this study, expression analysis revealed significant expression differences in MYB, bHLH, and ERF TFs between the R and S materials after P. xanthii infection. Among them, one bHLH transcription factor (Moc06g04560.1) showed significant upregulation in the R resistant material, which might be involved in regulating PM resistance in plants. For example, overexpression of the CmbHLH87 gene in pumpkin significantly enhanced PM resistance [18]. Concurrently, ERF could participate in regulating plant disease responses through the MAPK signaling pathway plants, and overexpression of ERF gene could enhance plants’ disease resistance. In this study, two ERF transcription factors (Moc04g32470.1 and Moc01g34750.1) were significantly upregulated in R materials after P. xanthii infection, which might be related to the regulation of PM resistance in plants.
As one of the conserved gene families in plants, MLO plays a crucial role in plant development and disease resistance [23]. Silencing or knocking out specific MLO genes could confer PM resistance in various crops, including barley [51], wheat [22], and grapes [52]. For example, knocking out the CsMLO1/8/11 genes from the CsMLO family in cucumber could result in 100% resistance to PM [53]. In this study, a total of 15 MLO genes were identified, which was consistent with the previous results [54]. RNA-seq analysis revealed that MLO genes were predominantly downregulated in the resistant material R. On the third day, multiple MLO genes were significantly downregulated in the resistant material R, including Moc10g30350.1, Moc02g03650.1, Moc04g35620.1, Moc01g29730.1, Moc03g20150.1, Moc01g32020.1, and Moc09g35890.1, which was similar to the melon research [55]. Furthermore, it was found that Moc10g30350.1 was significantly downregulated in the R material on both the third and fourth days, which might be related to regulating bitter gourd PM resistance. Homology analysis revealed that Moc10g30350.1 had a high sequence similarity to Csa6G509690.1 and MELO3C007979.1 in cucurbit MLO genes (Figure S3). Previous research showed that downregulation of the homologous gene Csa6G509690.1 could enhance PM resistance in plants [56]. This result suggested that the Moc10g30350.1 gene could potentially regulate PM resistance in plants. Therefore, further investigation of Moc10g30350.1 in bitter gourd is necessary to clarify its functional role in regulating the PM resistance response.
5. Conclusions
In this study, morphological and molecular analyses identified the PM pathogen in bitter gourd as the physiological race Podosphaera xanthii. Scanning electron microscopy of leaves at different periods after inoculation revealed growth differences in the P. xanthii among various disease-resistant materials. RNA sequencing technology revealed multiple regulatory pathways governing plant resistance to PM disease. Analysis of transcription factor expression at different periods suggested that a bHLH transcription factor (Moc06g04560.1) might participate in PM defense. Additionally, analysis of MLO gene expression at different periods indicated that an MLO gene (Moc10g30350.1) may also be involved in PM defense. These findings not only provide a foundation for future bitter melon disease resistance research but also offer new insights for breeding PM-resistant bitter gourd varieties.
The reference list from the paper itself. Each links out to its DOI / PubMed record.
- 1Cheng Y. Yao J. Zhang H. Huang L. Kang Z. Cytological and molecular analysis of nonhost resistance in rice to wheat powdery mildew and leaf rust pathogens Protoplasma 20152521167117910.1007/s 00709-014-0750-925547964 · doi ↗ · pubmed ↗
- 2Wang B. Meng T. Xiao B. Yu T. Yue T. Jin Y. Ma P. Fighting wheat powdery mildew: From genes to fields Theor. Appl. Genet.202313619610.1007/s 00122-023-04445-437606731 · doi ↗ · pubmed ↗
- 3Guigón López C. Muñoz Castellanos L.N. Flores Ortiz N.A. González González J.A. Control of powdery mildew (Leveillula taurica) using trichoderma asperellum and metarhizium anisopliae in different pepper types Bio Control 201964778910.1007/s 10526-018-09916-y · doi ↗
- 4Gadoury D.M. Cadle-Davidson L. Wilcox W.F. Dry I.A.N.B. Seem R.C. Milgroom M.G. Grapevine powdery mildew (Erysiphe necator): A fascinating system for the study of the biology, ecology and epidemiology of an obligate biotroph Mol. Plant Pathol.20121311610.1111/j.1364-3703.2011.00728.x 21726395 PMC 6638670 · doi ↗ · pubmed ↗
- 5Tian M. Yu R. Yang W. Guo S. Liu S. Du H. Liang J. Zhang X. Effect of powdery mildew on the photosynthetic parameters and leaf microstructure of melon Agriculture 20241488610.3390/agriculture 14060886 · doi ↗
- 6Yuan L. Zhang J. Shi Y. Nie C. Wei L. Wang J. Damage mapping of powdery mildew in winter wheat with high-resolution satellite image Remote Sens.201463611362310.3390/rs 6053611 · doi ↗
- 7ALDRIGHETTIA. PERTOTI. Epidemiology and control of strawberry powdery mildew: A review Phytopathol. Mediterr.20236242745310.36253/phyto-14576 · doi ↗
- 8Takamatsu S. Origin and evolution of the powdery mildews (Ascomycota, Erysiphales)Mycoscience 201354758610.1016/j.myc.2012.08.004 · doi ↗