Circular Dichroism via Extrinsic Chirality in Achiral Plasmonic Nanohole Arrays
Francesco Floris, Margherita Angelini, Konstantins Jefimovs, Dimitrios Kazazis, Franco Marabelli

TL;DR
A cost-effective and ultrasensitive biosensing platform is developed using achiral nanohole arrays that generate chiral responses through symmetry breaking under oblique light.
Contribution
A novel chiroptical platform using achiral plasmonic nanohole arrays with extrinsic chirality for enantiomer discrimination.
Findings
Extrinsic chirality is induced in achiral nanohole arrays via symmetry breaking under oblique illumination.
Displacement Talbot Lithography enables scalable and low-cost fabrication of large-area plasmonic structures.
Enhanced chiroptical response is achieved for sensitive detection of chiral biomolecules.
Abstract
What are the main findings? Ultrasensitive and Cost-Effective Chiroptical Platform using an achiral plasmonic nanohole array.Extrinsic Chirality induced by symmetry breaking under oblique light incidence.Scalable Fabrication using Displacement Talbot Lithography for large-area and low-cost manufacturing. Ultrasensitive and Cost-Effective Chiroptical Platform using an achiral plasmonic nanohole array. Extrinsic Chirality induced by symmetry breaking under oblique light incidence. Scalable Fabrication using Displacement Talbot Lithography for large-area and low-cost manufacturing. What are the implications of the main findings? Chiral Response suitable for sustaining light–biomolecule interaction for enhanced sensing.Promising Enantiomer Discrimination for sensitive detection in biosensing.First mapping of S3 for metallic structures showing interesting antisymmetric properties.…
Click any figure to enlarge with its caption.
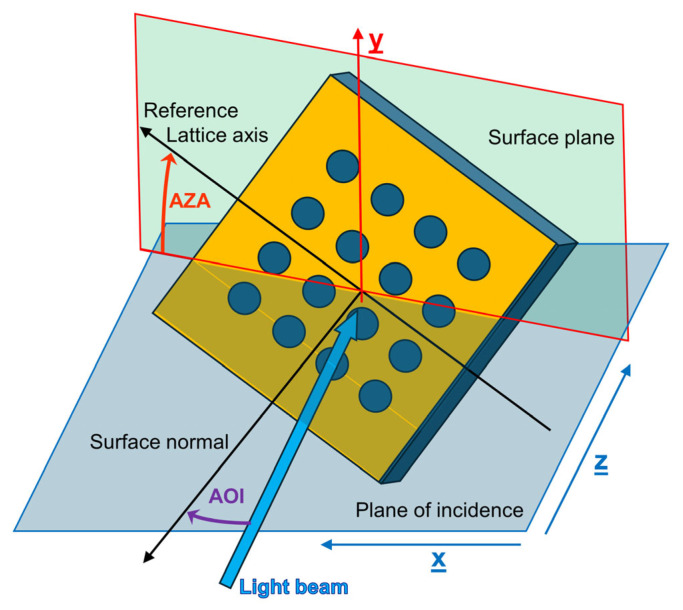 Figure 1
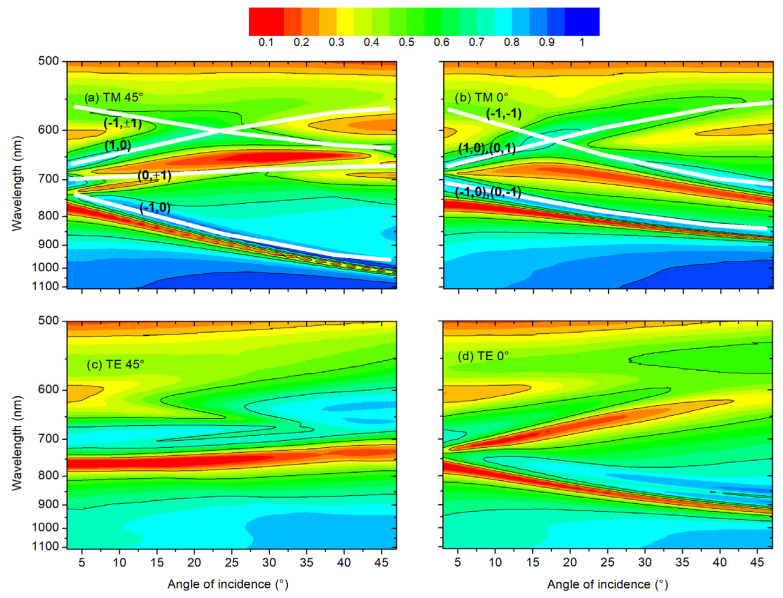 Figure 2
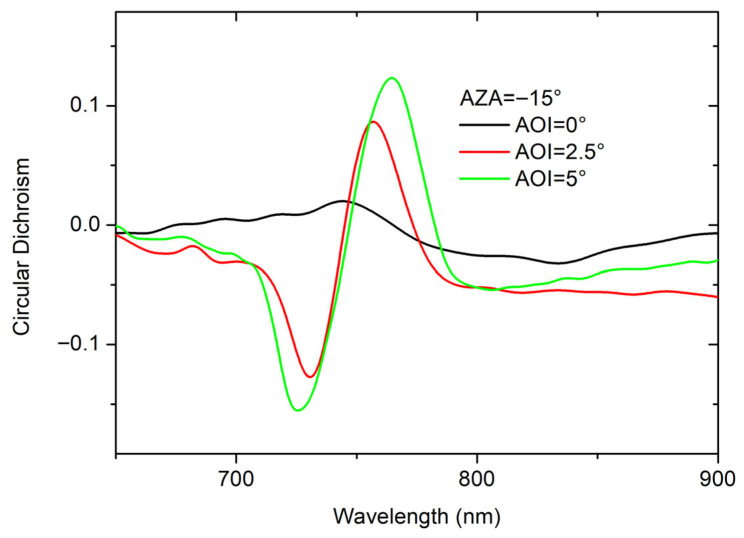 Figure 3
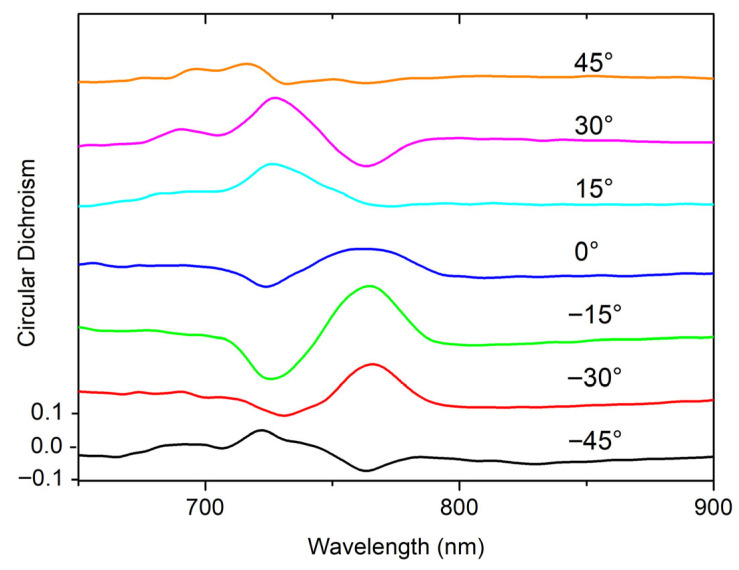 Figure 4
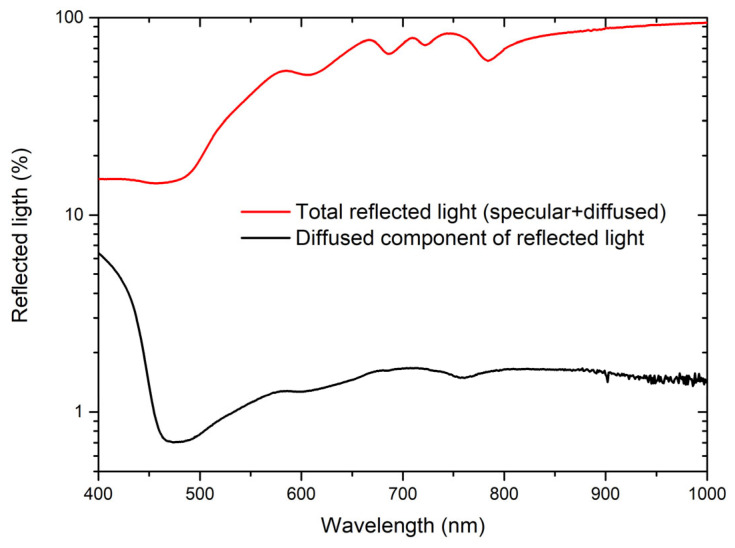 Figure 5
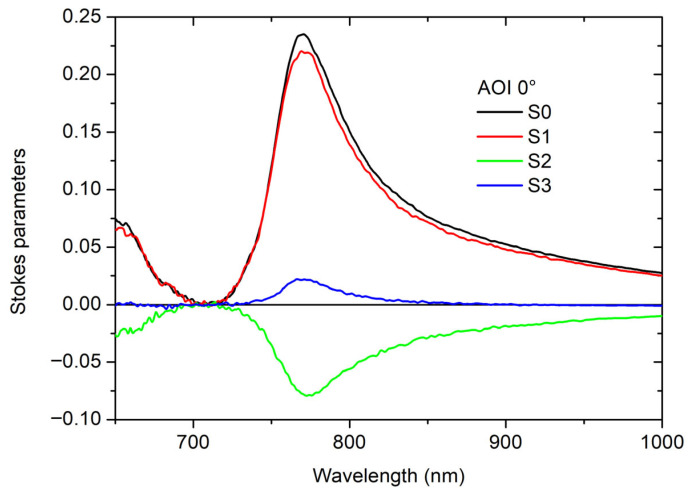 Figure 6
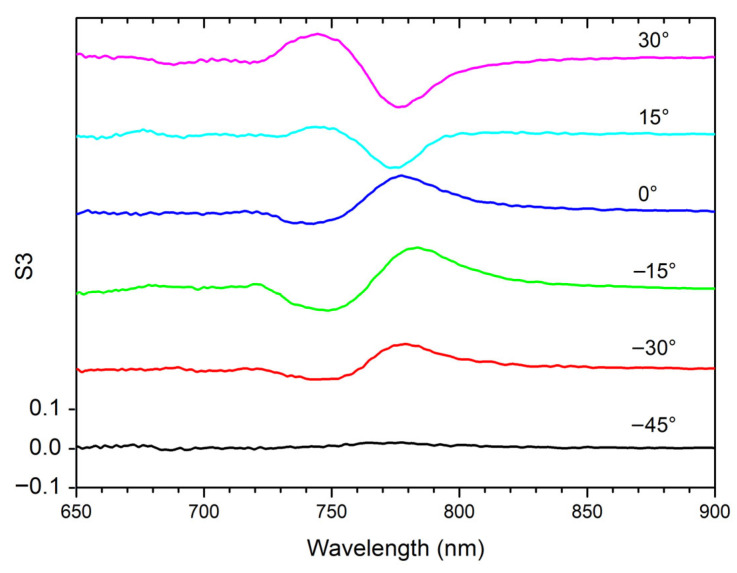 Figure 7
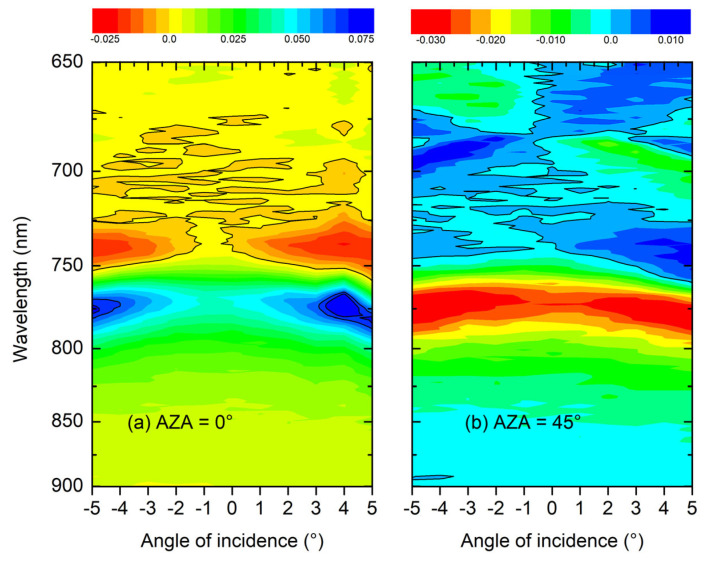 Figure 8
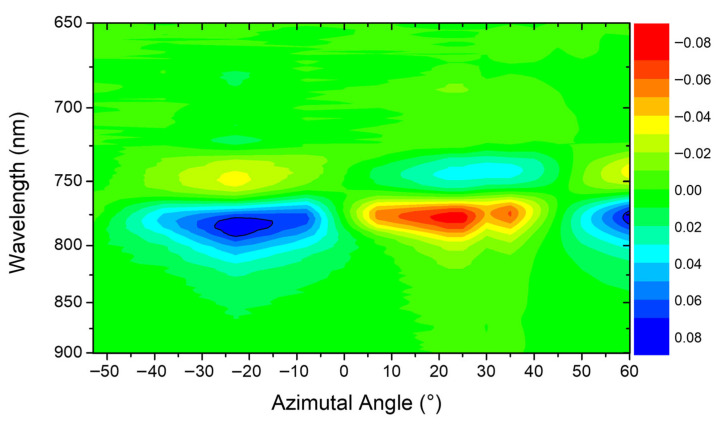 Figure 9
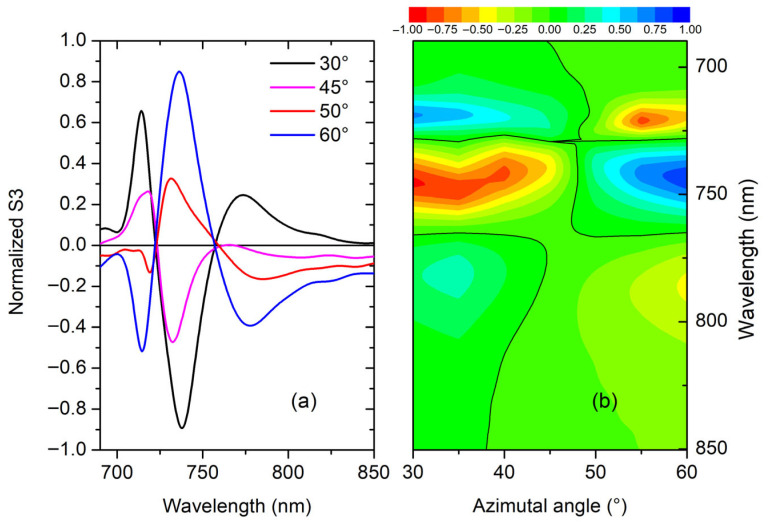 Figure 10
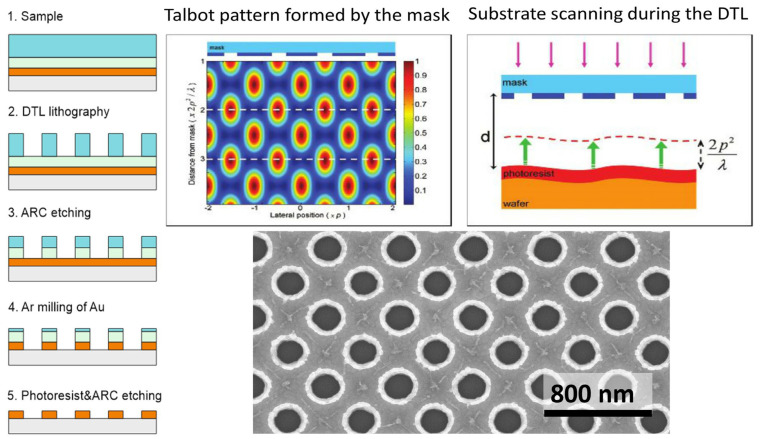 Figure 11
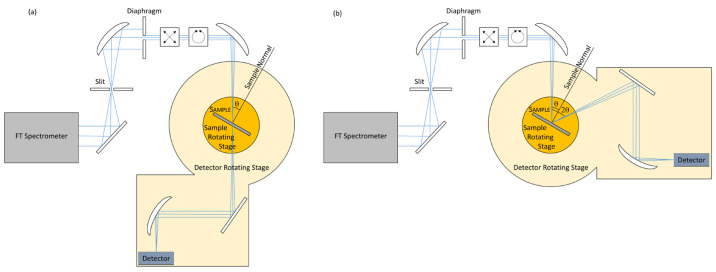 Figure 12
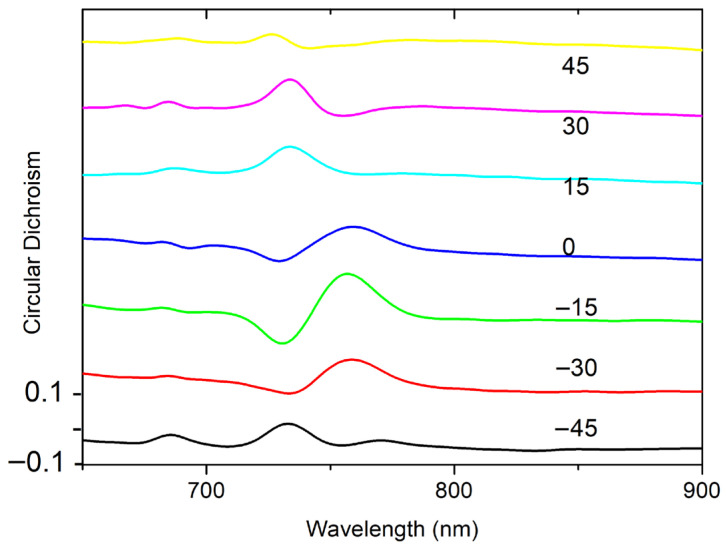 Figure 13
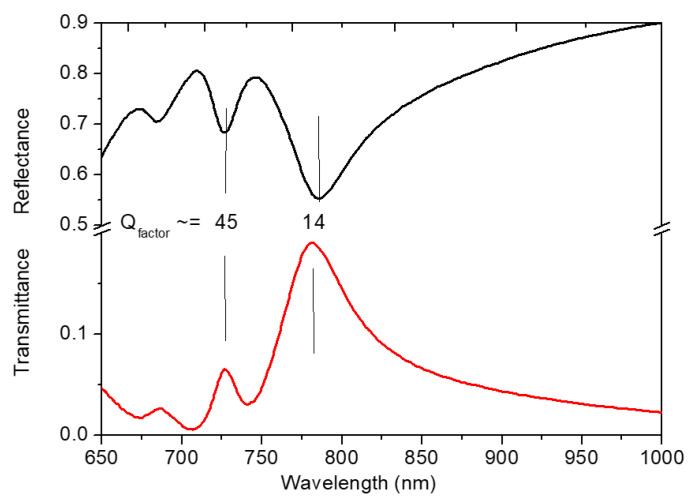 Figure 14
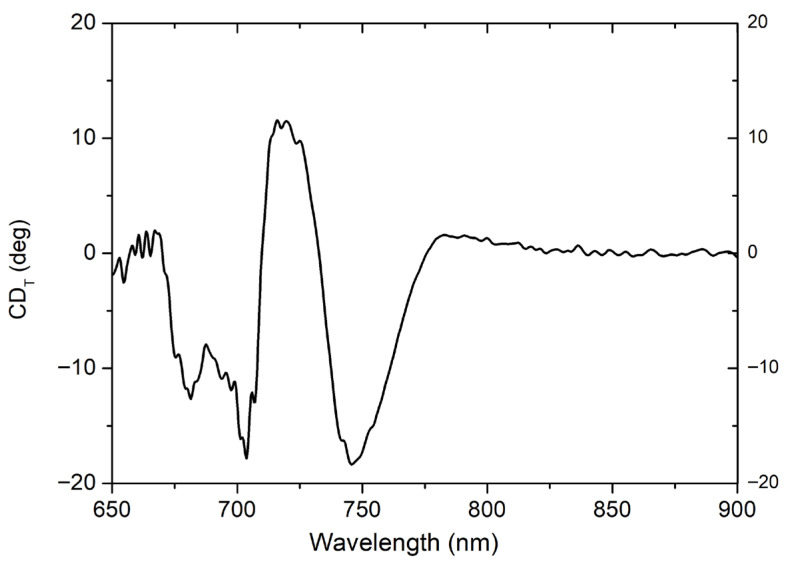 Figure 15
- —EU’s H2020 framework program for research and innovation
- —SNF R’Equip
- —Department of Physics of the University of Pavia
Peer Reviews
No public reviews on file for this paper yet. If you reviewed it on a platform where reviews are public (OpenReview, ICLR, NeurIPS, ICML), you can paste yours below so the community can read it here.
Videos
No videos yet. Explain this paper in a talk, walkthrough, or lecture? Add one.
Taxonomy
TopicsMetamaterials and Metasurfaces Applications · Plasmonic and Surface Plasmon Research · Photonic Crystals and Applications
1. Introduction
Chirality is a fundamental property describing molecules that are non-superimposable on their mirror image, i.e., enantiomers. The ability to detect and distinguish between enantiomers is of paramount importance in fields such as pharmacology and biochemistry [1,2]. The standard method for characterizing molecular chirality is circular dichroism spectroscopy, which measures the differential absorption of right and left circularly polarized light, i.e., Circular Dichroic (CD) signal.
However, conventional CD is inherently limited by low sensitivity when probing minute sample volumes or low concentrations of biomolecules—a drawback that hinders high-throughput applications and early-stage diagnostics [2]. To overcome this limitation, research has focused on amplifying the chiral signal through the interaction between the molecules and metallic plasmonic nanostructures [3]. The excitation of localized surface plasmon resonances (LSPRs) in metallic nanostructures can generate highly intensified electromagnetic fields and near-field gradients, significantly enhancing the CD signal [4].
Most approaches for CD enhancement rely on fabricating intrinsically chiral nanostructures, characterized by an asymmetric 3D geometric shape. While these structures (such as helices, spirals, or asymmetrically arranged metastructures) have shown remarkable enhancement factors, their fabrication is often complex, costly, and not scalable, typically requiring advanced techniques like Electron Beam Lithography (EBL) or multi-step self-assembly [5]. This complexity limits their widespread adoption for cost-effective sensing platforms.
A robust alternative is offered by the concept of extrinsic chirality. A geometrically achiral structure (one that possesses a mirror-symmetry plane) can exhibit chiroptical activity (and thus CD) when illuminated in a manner that breaks the overall symmetry. This occurs, for example, under oblique illumination (non-normal incidence) on planar metastructures, where the entire system (structure + light propagation direction) becomes chiral [6,7,8]. Extrinsic chirality offers the advantage of utilizing simpler, mass-producible nanostructure geometries.
In this work, we present a promising alternative for cost-effective sensing platform based on extrinsic chirality in achiral square nanohole arrays (NHAs) of circular plasmonic nanoholes able to support the propagation of Surface Plasmon Polaritons (SPPs) [9]. SPP resonance is highly sensitive to refractive index changes and enables unique light confinement capabilities, which are essential for maximizing the light–biomolecule interaction in high-throughput sensing applications.
Crucially, the fabrication of these arrays is achieved via Displacement Talbot Lithography (DTL) [10], which is a large-area, parallel, and low-cost patterning technique that offers superior scalability and speed compared to EBL or Focused Ion Beam (FIB) methods.
We demonstrate that by breaking the system symmetry through oblique illumination, it is possible to engineer enhanced chiroptical response within the nanoholes, which act as optical traps and sensing chambers for biomolecules. Through the optimization of the array periodicity and hole diameter, a resonant coupling between the SPP resonance and the extrinsic chirality can be achieved. Our results establish DTL-fabricated achiral NHAs as a potential innovative platform for the detection and discrimination of enantiomers in biosensing applications [11], providing a scalable alternative to complex intrinsic chiral nanostructures.
2. Materials and Methods
2.1. Displacement Talbot Lithography
DTL is a high-resolution photolithography technique that combines the benefits of compact, mask-based Talbot lithography with the high depth of focus of interference lithography, enabling robust nano-patterning on a wafer scale. DTL specifically addresses the stringent flatness requirements typical of proximity lithography by continuously changing the distance between the mask and the wafer during exposure, as demonstrated by Solak et al. [12]. Such a process averages the intensity along the Talbot pattern propagation, rendering the resulting pattern independent of the specific mask-to-wafer distance. This ensures a uniform dose across the substrate, significantly enhancing the technique’s robustness and scalability for large-area production [13].
Considering this, we employed an achiral NHA like that formerly studied by Angelini et al. [14]. Our aim, extending the analysis conducted by Pellacani et al. [15], was to subject circular holes arranged in a square array, i.e., the highest symmetric scatterer shape and array disposition combination, to oblique incidence conditions, specifically targeting the verification of any resultant CD signal arising from extrinsic chirality. In our case, we aimed at patterning the square NHA within a gold film with a thickness of 80 nm, a hole diameter of 190 nm, and a target pitch (P_target_) of 450 nm. The aerial image produced by DTL corresponds to a square hole array rotated by 45° with respect to the mask pattern, with the pattern pitch reduced by a factor of relative to the mask pitch (P_mask_). Consequently, we used a mask with P_mask_ = 635 nm, satisfying the relationship .
The fabrication process for this NHA is identical to that described in [15]; for convenience, the details are provided in Appendix A along with a SEM image of the investigated sample.
2.2. Optical Characterization
To study the extrinsic chiral response of the NHA under investigation, angle-resolved reflectance (R) and transmittance (T) were measured for different angles of incidence (AOIs) and several azimuthal angles (AZAs). Their geometrical definitions are shown in Figure 1, together with the main axis and planes.
All the measurements were performed resorting to a Bruker (Billerica, MA, USA) IFS66s Fourier Transform interferometer coupled to a custom-built reflectometer. For convenience and consistency, when evaluating the CD signals, both the R and T signals were collected through a single non-polarizing beam-splitter cube and directed to a Si photodetector as reported by Angelini et al. [16]. This setup allowed for illuminating the sample surface with a focused beam, characterized by a spot size diameter of 200 μm and a divergence angle lower than 1°. To collect the Stokes polarization parameters, the setup was, instead, modified to adhere to the so-called rotating quarter-waveplate method, reported by Schaefer al. [17]. In fact, such a method is particularly advantageous thanks to its accuracy and efficiency, allowing a simple curve fitting algorithm to be used to determine the Stokes parameter, thus avoiding both complexity and limitations of the classical method. The details of the optical setup and its schematics are reported in Appendix B.
Diffuse light measurements were performed using an Agilent Technology (Santa Clara, CA, USA) Cary 6000i spectrophotometer at normal incidence resorting to its built-in Agilent Technology (Santa Clara, CA, USA) Ulbricht integrating sphere tool.
2.3. Optical Analysis
According to the literature, CD was defined as
where A_left_ and A_right_ indicate the absorbance for left- and right-handed circularly polarized light, respectively. Thanks to the quality of the array, the low divergence of the beam and the absence of diffracted beams in the spectral region under investigation, A signals were evaluated as
Furthermore, the accurate determination of Stokes parameters requires precise calibration of the polarimetric system, which is subject to uncertainties stemming from the alignment of components and the actual phase retardation value of the wave plates.
In fact, the misalignment of the Quarter-Wave Plate (QWP) by an angle Δθ relative to the reference frame causes the λ/4 phase retardation to be incorrectly applied to rotated electric field components, which translates into significant crosstalk among the Stokes parameters, mixing polarization components (e.g., causing circular polarization to appear as linear). Additionally, the misalignment Δγ of the linear polarizers (in both the state generator and the state analyzer) further exacerbates the issue, introducing additional systemic error terms and crosstalk into the Stokes parameters, which is essential for correlating the measured intensities to the true Stokes vector.
Finally, a critical source of error is the inherent uncertainty in the actual phase retardation value δ of the QWP, which may deviate from the nominal π/2 radians (a λ/4 shift) due to manufacturing or environmental factors. Thus, a rigorous calibration procedure, as reported by Marcías-Romero and Török [18], was applied to both alignment errors (Δθ, Δγ) and retardation errors (Δδ) to achieve accurate polarization measurements.
3. Results and Discussion
Our initial analysis started from the TE and TM maps for R in the 3–47° AOI range to figure out the plasmonic mode dispersion. Figure 2 illustrates the development of plasmonic modes along the principal lines of symmetry (crystal axes) and the diagonal.
The R spectra in Figure 2 are primarily dominated by the dispersion of SPP modes. However, these samples exhibit strong interaction and hybridization between SPP and Localized Surface Plasmon Resonance (LSPR) modes. This coupling is particularly evident near normal incidence around 700 nm, where the convergence of various plasmonic branches towards normal incidence occurs and, additionally, the lifting of degeneracy in pure SPP modes leads to the formation of a plasmonic bandgap [19].
3.1. Chiroptical Response and Dichroism Effects
Given the characteristics identified in the band structure, attention was focused on the behavior of the system for AOI close to 0°, where the chiroptical effects, specifically CD, are predominantly localized within the spectral region defined by the photonic bandgap. To investigate this, we analyzed the CD response at three key incidence angles: AOI = 0°, AOI = 2.5°, and AOI = 5°. As the AOI increases, the CD signal becomes significantly more structured, as shown in Figure 3.
Meanwhile, the CD signal progressively exhibits a strong dependence on the AZA as shown in Figure 4 for AOI = 5°. The correspondent data for AOI = 2.5° are reported in Appendix C.
While the absolute value of the measured CD is not exceptionally high, it can be maximized by rotating the AZA, reaching absolute values up to 0.2. This strong AZA dependence is a particularly interesting effect that facilitates polarization tunability via simple mechanical rotation and is characteristic of extrinsic chirality induced by the oblique incidence, where the in-plane symmetry is explicitly broken by the experimental geometry.
Crucially, a small, yet detectable, CD signal is observed even at AOI = 0° (i.e., normal incidence) and AZA = 0° or ±45° (i.e., aligned along the lattice symmetry directions). Theoretically, for these conditions, structures possessing in-plane symmetry should exhibit zero CD due to symmetry constraints and, therefore, the observation of this small non-zero signal can be ascribed to a residual misalignment or either a minor fabrication imperfection or sample tilt that breaks the in-plane symmetry.
3.2. Correction for Scattered Light
The observed chiroptical effect does not consider the influence of scattered light, not accounted for in Equation (1). To verify such an effect, arising from lattice diffraction or, in general, from surface roughness, we estimated the amount of diffused light, as illustrated in Figure 5. A steep increase in the diffuse component can be observed, ascribable to diffraction, with respect to the total reflected light for wavelengths smaller than 450 nm, which is consistent with the P_target_ value. In the spectral region of interest between 500 and 1000 nm, a diffused component is measured with values between 1 and 2%, roughly proportional to the total reflectance. Such an effect does not affect the behavior of DC signal while it influences its absolute value, and the subtraction of a background due to diffused light tends to increase the CD values; then, our CD is underestimated.
3.3. Stokes Parameters Analysis
An alternative approach to study the chiral effect implies the determination of the Stokes parameters (SPs) [20], particularly S3 [21], that can be performed with transmittance measurements, implicitly considering also spurious effects arising from depolarization or diffusion.
In this way, the complex dependence on AOI and AZA can be further investigated. The full set of SP spectra measured at AOI = 0° and AZA = 45° values is presented in Figure 6.
The analysis of SPs provides a comprehensive quantification of the polarization state, allowing us to map the transitions between linear, elliptical, and circular polarization components as a function of wavelength, also complementing the CD measurements by revealing the nature of the induced ellipticity and rotation across the bandgap region.
For effective comparison, normalized SPs are typically required to be the normalized S3 directly associated with CD, i.e., CD = S3 as reported in [21,22].
However, we present the not-normalized values (as referenced in Figure 6) because the total intensity (S0) approaches zero within the photonic bandgap and normalizing the parameters (S1/S0, S2/S0, S3/S0), in this regime, would cause the curves to diverge significantly due to noise fluctuations, severely obscuring the underlying physical phenomena and making the visualization of the data less effective; the not-normalized maps, therefore, provide a more robust representation of the polarization state variations in the vicinity of the bandgap.
The S3 spectra, collected at AOI = 5° for different AZA values, are presented in Figure 7.
It can be interesting to compare such S3 spectral behavior with the CD curves (Figure 4), showing a good agreement in terms of evolution with the AZA.
An effective way to summarize chirality as a function of AOI is obtained by plotting the maps of S3 vs. wavelength; see Figure 8.
The point of symmetry, the real zero for AOI, is much better identified, particularly in the case where the AZA is 0°, where the normal incidence, in this specific configuration, is shifted by roughly 1°, and a similar observation holds for AZA = 45°. The dispersion is revisited near the AOI = 0°, which connects back to the observations presented in Figure 2.
In this specific context, we can estimate the values between AOI = 0° and AOI = 5°. A play of symmetries is observed when AZA is 0°; a symmetry is visible for positive and negative AOI while, conversely, for AZA = 45°, at wavelengths lower than 750 nm, an antisymmetric behavior of the signal is observed for positive and negative AOI.
It is worth highlighting that for a more detailed analysis of these symmetry-breaking effects, it would be necessary to perform an accurate photonic band calculation for our specific metal–dielectric structure, as demonstrated for purely dielectric systems by Zagaglia et al. [23]. While their methodology provides a robust framework, the inclusion of metallic components in our structure introduces significant differences, notably the presence of SPPs and the associated losses, which drastically influence the band structure and dispersion features. A dedicated calculation would be crucial to accurately map the resonant modes and precisely define the observed zero points and dispersion trends; while currently out of the scope of this specific work, performing this simulation is planned for a future study.
The discussion becomes even more precise when the results are reconsidered as a function of the variation in the AZA, as proposed in Figure 9.
The results comprise two distinct datasets acquired during separate experimental sessions. The first is a broad-range set, which illustrates the general signal evolution with a 15° resolution. The second is a high-resolution set, which focuses on the symmetry point (30–60°) with a finer 5° resolution. To correct for a slight experimental offset observed in the 15° resolution data relative to the theoretical symmetry angles, we centered the AZA = 0° position at the minimum signal region (the transition between positive and negative values). This combined visualization reveals different S3 maxima and minima occurring between ±15° and ±30°. This extremes values align with the ~±20° peak observed in the map and corresponds to the maximum displacement from symmetry conditions, consistent with the previous literature [23,24].
This AZA acts as a critical parameter controlling the in-plane symmetry of the excitation. It is evident that as one moves away from the primary axes of symmetry (i.e., AZA = 0°, 90° or AZA = ±45°), the underlying structural symmetry is broken in the context of the incident light wavevector. It can also be noted that the map representation allows for better identification of the symmetry line, identifying the AZA as a powerful tuning knob for controlling the handedness and magnitude of the CD in such metastructures.
Lastly, it is fundamental to properly consider the impact of a correct alignment of the array with respect to the polarization state of the incident light. In fact, the small CD measured at AOI = 0°, as discussed in Section 3.1, could be related to tight alignment precision.
Moreover, when considering the chiroptical effect through the normalized S3, represented in Figure 10, the obtained values become close to unity reinforcing the potential application to sensing.
In this respect, the experimental Quality Factor (Q_factor_) serves as a primary parameter for evaluating performance. Based on the T and R line shapes, the Q_factor_ for the two resonances involved in the chiral response at 780 nm and 730 nm are estimated to be 14 and 45, respectively, as shown in Figure A4 in Appendix D. Notably, these values compare favorably with those reported in previous studies [25].
Since the Q_factor_ is intrinsically linked to field enhancement, which is generally estimated to be in the order of 10 for similar NHAs [26], our relatively larger Q_factor_ values suggest the potential for equal or superior enhancement levels.
While high field enhancement is a prerequisite for sensitive chiral molecule detection, performance must be evaluated comprehensively. The literature suggests that chiral sensitivity is governed by two key features: (i) the molecule’s inherent chirality (coupling between electric and magnetic dipoles), and (ii) the chirality of the electromagnetic field, which can be engineered via surface structures [27,28].
Consequently, the chirality induced by the surface itself is a critical metric.
A structure like the one studied here was recently investigated for enantiomer discrimination [29]. Numerical simulations in that study demonstrated that an AOI of 10° and an AZA of 30° break field symmetry, leading to a chiral enhancement factor of approximately 20 and, notably, the spectral behavior of this enhancement closely matches the CD features.
Given the similar geometries of our structures to those in [29] (with differences primarily in fabrication method and hole size), we applied the same criteria to our samples. To facilitate direct comparison, we calculated the Chiral Transmission Dichroism (CD_T_) using the following definition:
The resulting signal obtained in our case is one order of magnitude larger than the comparative study, as can be seen in Figure A5 reported in Appendix D, and we are therefore confident that the sensitivity tests planned soon will provide compelling results for chiral molecule detection.
4. Conclusions
This work establishes the efficacy of achiral NHAs fabricated via DTL as a scalable, cost-effective platform for extrinsic chirality. We demonstrated that symmetry breaking induced by oblique illumination generates a robust chiroptical response, with CD strongly dependent on the AOI and AZA values. The analysis of Stokes parameters, particularly S3, provided a precise quantification of the response, revealing antisymmetric properties, and achieving normalized values close to unity. This angular tunability and high induced efficiency envision DTL-NHAs as a scalable solution for chiroptical properties engineering. In summary, the methodology offers a promising platform for enantiomer discrimination and biosensing applications, and we are confident that sensitivity tests, planned soon, could provide interesting results for chiral molecule detection.
The reference list from the paper itself. Each links out to its DOI / PubMed record.
- 1Dekker M. Chirality in Drug Design and Development Marcel Dekker New York, NY, USA 2004
- 2Nakanishi K. Berova N. Woody R.W. Circular Dichroism: Principles and Applications VCH Publishers New York, NY, USA 2003
- 3Schwartz T. Hutchison J.A. Genet C. Ebbesen T.W. Plasmon-enhanced circular dichroism spectroscopy of a protein Nat. Photonics 20148355359
- 4Nesterov M.L. Yin X. Schäferling M. Giessen H. Weiss T. The Role of Plasmon-Generated Near Fields for Enhanced Circular Dichroism Spectroscopy ACS Photonics 2016357858310.1021/acsphotonics.5b 00637 · doi ↗
- 5Gansel J.K. Thiel M. Rill M.S. Decker M. Bade K. Saile V. von Freymann G. Linden S. Wegener M. Gold helix photonic metamaterial as a broadband circular polarizer Science 20093251513151510.1126/science.117703119696310 · doi ↗ · pubmed ↗
- 6Plum E. Fedotov V.A. Zheludev N.I. Optical Activity in Extrinsically Chiral Metamaterial Appl. Phys. Lett.20089319191110.1063/1.3021082 · doi ↗
- 7Hendry E. Carrol T. de Lima A.F. Sambles J.R. Optical extinction and circular dichroism in self-assembled gold nanoparticle arrays New J. Phys.200810053018
- 8Zhu A.Y. Chen W.T. Zaidi A. Huang Y. Khorasaninejad M. Sanjeev V. Qiu C. Capasso F. Giant optical activity in planar achiral structures Science 2010330333335