Genetic Diversity of Prolamin Loci Related to Grain Quality in Durum Wheat (Triticum durum Desf.) in Kazakhstan
Maral Utebayev, Svetlana Dashkevich, Oksana Kradetskaya, Irina Chilimova, Ruslan Zhylkybaev, Tatyana Zhigula, Tatyana Shelayeva, Gulmira Khassanova, Kulpash Bulatova, Vladimir Tsygankov, Marat Amangeldin, Yuri Shavrukov

TL;DR
This study explores the genetic diversity of prolamin loci in durum wheat from Kazakhstan and how they affect grain and gluten quality.
Contribution
The study identifies novel associations between specific gliadin and glutenin alleles and gluten quality traits in Kazakhstani durum wheat.
Findings
The γ45 gliadin component and Glu-A3a allele are positively linked to improved gluten quality traits.
Distinct prolamin profiles are observed in wheat accessions from different ecological and geographical regions.
Kazakhstani durum wheat genotypes show unique genetic diversity compared to global collections.
Abstract
The technological properties of durum wheat grain are determined by prolamins (gliadins and glutenins). Information on the allelic composition of key loci remains incomplete despite existing global studies examining prolamin variability. This highlighted the need to study these traits in durum wheat in Kazakhstan. The effects of specific gliadin components with high- and low-molecular-weight glutenin fractions on gluten quality are also not fully clarified. This study aimed to characterise allelic diversity at prolamin-coding loci and evaluate associated grain quality traits. Using native and denaturing SDS-electrophoresis, 181 tetraploid wheat accessions from Kazakhstan, an International germplasm collection, and 26 breeding lines were analysed for allelic variation and associations with protein content, gluten content, gluten index, and SDS-sedimentation. The γ45 gliadin component and…
Genes, proteins, chemicals, diseases, species, mutations and cell lines named across the full text — each resolved to its canonical identifier and authoritative record.
Click any figure to enlarge with its caption.
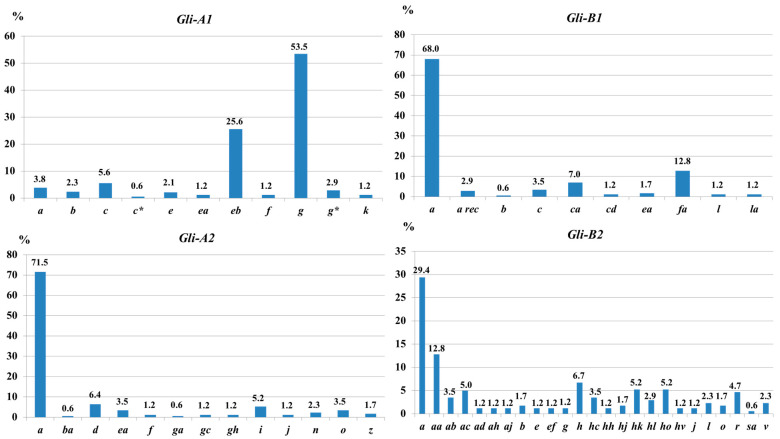 Figure 1
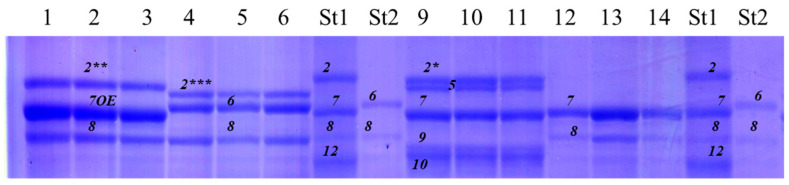 Figure 2
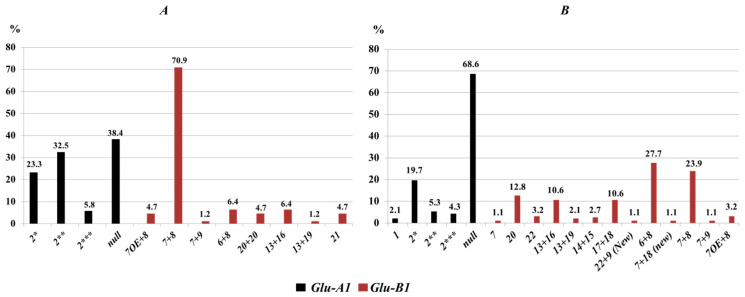 Figure 3
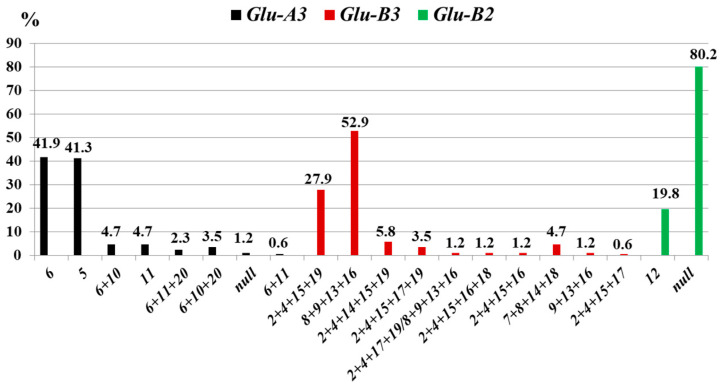 Figure 4
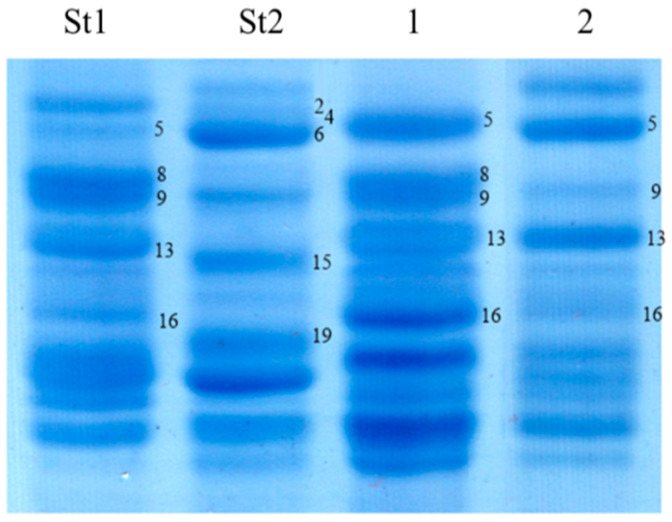 Figure 5
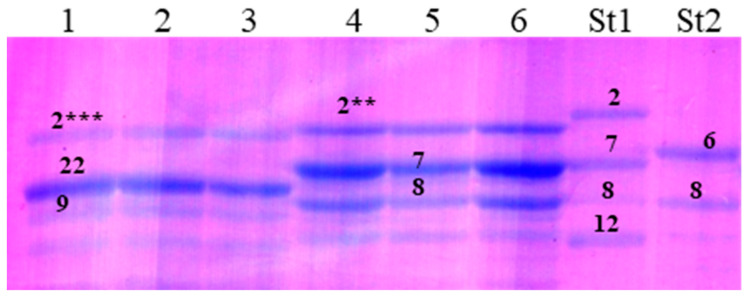 Figure 6
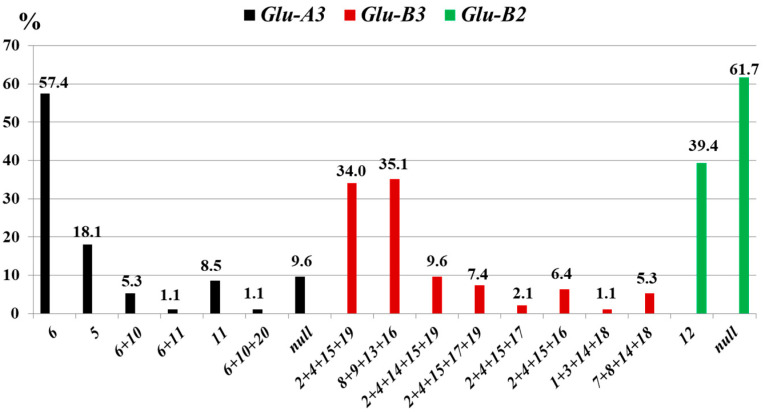 Figure 7
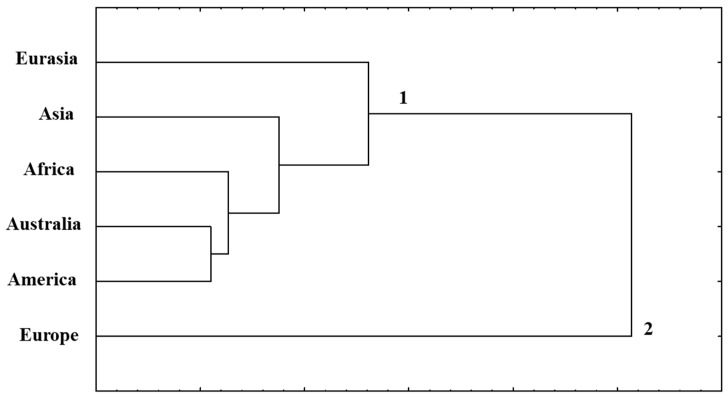 Figure 8
- —Science Committee of the Ministry of Science and Higher Education of the Republic of Kazakhstan
Peer Reviews
No public reviews on file for this paper yet. If you reviewed it on a platform where reviews are public (OpenReview, ICLR, NeurIPS, ICML), you can paste yours below so the community can read it here.
Videos
No videos yet. Explain this paper in a talk, walkthrough, or lecture? Add one.
Taxonomy
TopicsWheat and Barley Genetics and Pathology · Celiac Disease Research and Management · Agricultural Productivity and Crop Improvement
1. Introduction
Durum wheat (Triticum durum Desf.) is one of the most important cereal crops worldwide, accounting for approximately 8% of the global wheat-growing area [1]. Its grain is widely used for pasta, semolina, and various traditional foods, which creates high and stable demand for grain with specific technological properties [2].
Consequently, grain quality remains a key target in durum wheat breeding programs. Grain quality in durum wheat is largely determined by the gluten protein complex, composed of gliadins and glutenins. Gliadins are encoded primarily by the Gli-1 and Gli-2 loci, resulting in extensive allelic variation. Glutenins are classified into high- and low-molecular-weight subunits (HMW-GS and LMW-GS), encoded mainly by the Glu-1 and Glu-3 loci, respectively. Both groups contribute to gluten strength and viscoelastic properties, although their relative effects differ depending on allelic composition and genetic background [3]. Strong associations between specific gliadin components and gluten quality have been demonstrated, particularly at the Gli-B1 and Glu-B3 loci [4,5,6,7,8]. Extensive catalogues of HMW-GS and LMW-GS allelic variants now enable large-scale assessment of prolamin diversity in international durum wheat collections [9,10,11,12]. Previous studies have reported substantial geographic variation in the allelic composition of gliadin- and glutenin-encoding loci in durum wheat; however, available data remain fragmented across countries [13,14,15,16,17,18,19] and are largely absent for Kazakhstan.
Therefore, there is a clear need to conduct research providing a comprehensive account of the diversity of gliadin- and glutenin-encoding loci in durum wheat in Kazakhstan. The aim of the present study was to comprehensively characterise the allelic diversity of gliadin- and glutenin-encoding loci (HMW-GS and LMW-GS) in a representative collection of durum wheat germplasm from Kazakhstan and to identify favourable prolamin alleles and allele combinations that can be exploited in durum wheat breeding programs.
2. Materials and Methods
2.1. Plant Material
A total of 181 durum wheat accessions and 26 breeding lines from Kazakhstan and global breeding programs were analysed. Seeds were provided by the Genetic Resources Laboratory, A.I. Barayev Research and Production Centre of Grain Farming (BRPCGF). Wild species included Triticum turanicum, T. persicum, T. sovieticum, T. dicoccum, and T. aethiopicum Jakubz. In addition, wild accessions from field expeditions, such as white beardless spelt (France), Korasim in the Upper Jordan Valley 1972 (Israel), and Rosh-Pinnar in East Galilee (Israel), were provided by the Australian Grains Genebank, Horsham (Australia). The full list of durum wheat accessions used in this study is present in Supplementary Materials Tables S1 and S2. A subset of 26 durum wheat breeding lines, selected to study associations between prolamin alleles and grain quality, was sown at the research field of BRPCGF, Akmola region, Kazakhstan (51°40′25.3″ N, 71°0′46.8″ E). Each line was grown in a seven-row plot, 25 m in length, 1 m in width, with a 25 m^2^ area. Seeds were sown to a depth of 5–7 cm, with 10–12 cm spacing between rows, and about 280 plants per m^2^. Each genotype had two replicated plots with a fully randomised design. The soil was chestnut chernozem without irrigation.
2.2. Weather Conditions of the Growing Seasons
In 2022–2024 experiments, wheat plants were grown in Northern Kazakhstan in contrasting agro-climatic conditions with variability in temperature and moisture. According to regional agro-meteorological observations, the long-term average precipitation during the wheat growing season (May–August) in Northern Kazakhstan was approximately 180–200 mm, and air temperature 16.5–17.5 °C. In 2022, precipitation in the same period was below the long-term average with a hydrothermal coefficient (HTC) of about 0.4–0.5, indicating a moderate drought. In 2023, the growing season was characterised as a severe drought with HTC values dropping to 0.1–0.2. Precipitation was below 120 mm, and air temperatures exceeded the long-term average by 1.5–2.0 °C. In contrast, 2024 had a much higher moisture availability, with precipitation exceeding 230 mm and HTC values reaching 1.3–1.5, corresponding to favourable conditions for wheat growth and grain filling.
2.3. Biochemical Analysis
Protein content (PC) was determined by the Kjeldahl method using an automatic distillation unit UDK 142 (Velp Scientifica, Usmate‑Velate, Italy). Gluten content (GC) and gluten index (GI) were measured with a Glutomatic 2200 system (Perten Instruments, Hägersten, Sweden), following the manufacturer’s instructions. The results of the SDSS test were obtained through sedimentation of ground grain in lactic acid [20], with some modifications [21].
2.4. Prolamin Extraction
Gliadins were extracted according to the following protocol: wheat kernels were milled, and gliadins were extracted for 12 h at room temperature using 70% ethanol in microtube. Subsequently, a staining solution based on methylene green was added, prepared as follows: 60.0 g of sucrose and 0.01 g of methylene green were dissolved in 100 mL of 5.1 mM aluminum lactate buffer at pH 3.1.
Glutenin extraction was performed based on the proposed method [22], with several modifications. The crushed seed was placed in a 2.0 mL Eppendorf tube, 350 µL of 70% ethanol was added, and the samples were incubated at 65 °C for 45 min. The tubes were then centrifuged at 12,000× g for 5 min, the supernatant was discarded, and the pellet was washed with 400 µL of 70% ethanol, followed by centrifugation under the same conditions. The pellet was dried to remove residual ethanol, and 300 µL of extraction buffer was added. The extraction buffer composition was: 2.0 g SDS–Na, 10.0 mL glycerol, 80 mL Tris-HCl buffer (pH 8.8), 1.0 mg bromophenol blue, brought to a final volume of 100 mL with distilled water. Prior to extraction, β-mercaptoethanol was added to the buffer at a ratio of 500 µL per 10 mL of extraction buffer.
2.5. Gliadin and Glutenin Allele Classification
Gliadin electrophoresis was carried out according to the procedure described earlier [23]. The separation of HMW-GS and LMWGS was performed in 12% polyacrylamide gels using denaturing SDS-PAGE [24], with minor modifications [25]. The durum wheat cultivars Langdon and Senatore Capelli (Triticum durum Desf.), as well as bread wheat reference cv. Chinese Spring (Triticum aestivum L.), were used as standards for the identification of durum wheat genotypes (cultivars and breeding lines) based on catalogues for gliadin and glutenin alleles [10,26,27]. The nomenclature of gliadin and glutenin loci used for durum wheat was based on the Gene Catalogue for bread wheat gliadins: Gli-A1, Gli-B1, Gli-A2, and Gli-B2; and glutenins: Glu-A1, Glu-B1, Glu-A3, Glu-B3, and Glu-B2 [28]. Alleles at each locus were designated by Latin letters as a ‘genetic formula’ in the same order of genes. For instance, the genetic formula of gliadins in cv. Langdon was: Gli-A1c, Gli-B1a, Gli-A2a, and Gli-B2a, with the following final abbreviation: c, a, a, a.
2.6. Statistical Treatment
In this study, various methods were used to assess population diversity and inter-population differences based on the allelic composition of prolamins. The use of multiple parameters to describe diversity is justified, as each coefficient characterizes a specific aspect of genetic variation and complements the overall picture. Genetic diversity within populations was evaluated using the mean number of alleles per locus (μ), the proportion of rare alleles (h) [29], and Nei’s gene diversity index (H) [30]. Allele frequencies for each locus were determined based on the observed allele counts in individual samples. Genetic similarity between populations of different geographic origins was assessed using the similarity index (r). The statistical significance of differences between populations was evaluated using the identity criterion (I), comparing its value with the χ^2^ distribution at a significance level of p < 0.01 [29].
Associations between alleles at different loci were analyzed using Pearson’s coefficient of association with Yates’ correction and Yule’s coefficient [31]. The significance of allelic associations was evaluated using the χ^2^ test with one degree of freedom:
and
If for k = 1, then the relationship is considered significant. Yule’s association coefficient [31]:
The statistical error of the Yule coefficient is calculated using the formula:
Differences in mean values between groups were assessed using Welch’s t-test, which does not assume equal variances [32]. Results were considered statistically significant at p < 0.05:
where
All statistical analyses were conducted using Microsoft Excel 2021. For multivariate analysis, allele frequency data were standardized, and clustering was performed using Ward’s method with Euclidean distances in Statistica 6.0 (StatSoft, Inc., Tulsa, OK, USA).
3. Results
Based on electrophoresis of gliadins and glutenins, alleles of Gli-1, Gli-2, Glu-1, and Glu-3 loci were identified and presented as genetic formulas in Supplementary Material Table S1. The characteristics of the allelic composition of gliadins and glutenins in tetraploid wheat from Kazakhstan (N = 86) and in the world collection (N = 95) will be discussed in the following sub-sections separately.
3.1. Tetraploid Wheat Collection from Kazakhstan
3.1.1. Gli-1 and Gli-2 Loci
Gliadin-coding loci (Gli-1 and Gli-2) exhibited multiple allelism, reflecting genetic polymorphism within the collection. In 86 tetraploid wheat accessions from Kazakhstan, the highest polymorphism was observed at the Gli-B2 locus (11.6%), followed by Gli-B1 (8.1%), Gli-A2 (7.0%), and Gli-A1 (5.8%). Overall, 17.4% of accessions carried rare gliadin alleles (15 out of 86).
Accessions with identical sets of gliadin alleles were often distinguished by differences in LMW-GS composition, confirming their distinct genotypes (e.g., Hordeiforme 207-92: Glu-A3a, Glu-B3b, Glu-B2b; Nauryz-3: Glu-A3h, Glu-B3c, Glu-B2b; see Supplementary Material Table S1). The number of alleles per locus ranged from 10 (Gli-B1) to 25 (Gli-B2), whereas for loci Gli-A1 and Gli-A2, the number of alleles was 11 and 13, respectively. In particular, Gli-A1g (53.5%) and Gli-A1eb (25.6%) were most frequent at Gli-A1, whereas Gli-B1a, Gli-A2a, and Gli-B2a dominated their respective loci (Figure 1). Detailed allelic formulas are presented in Supplementary Material Table S1.
3.1.2. Glu-1 Loci
Allelic diversity at HMW glutenin (Glu-1) loci in durum wheat from Kazakhstan was lower than at gliadin loci, consistent with the absence of D genome-encoded proteins in the tetraploid genome. Identified HMW-GS subunits and corresponding alleles are listed in Supplementary Material Table S1. Two additional subunits, 1Ax2** and 1Ax2*** (Figure 2), exhibited higher electrophoretic mobility than the classical 1Ax2* subunit (cv. Neepawa, bread wheat) and likely represent allelic variants of 1Ax2*. Predominant subunits were determined based on their frequency of occurrence (Figure 3).
The Glu-B1 locus comprised eight alleles. Glu-B1b, encoding the 1Bx7 + 1By8 subunit pair, was most frequent (70.9%). The Glu-B1al allele, present in 4.7% of accessions, encodes 1Bx7^OE^ + 1By8 and is of particular breeding interest (Figure 2). Overall, 33.7% of accessions (29/86) carried Glu-1 variants. Glu-A1 was more diverse than Glu-B1 (27.9%, 24/86), primarily represented by 1Ax2* (b) and the null allele (c). Polymorphism at the Glu-B1 locus was 11.6% (10/86), largely due to the combination of Glu-B1b with other alleles.
3.1.3. Glu-3 Loci
At the Glu-A3 locus, eight alleles were identified in the studied collection. The most frequent alleles were a (41.9%) and b (41.3%), which are associated with the synthesis of LMW glutenin subunits 6 and 5, respectively (Figure 4).
The Glu-B3 locus was represented by ten allelic variants. The predominant allele, Glu-B3b, controlled the synthesis of LMW glutenin subunits 8 + 9 + 13 + 16, observed in 52.9% of accessions. The Glu-B3a allele, encoding subunits 2 + 4 + 15 + 19, was found in 27.9% of accessions. Comparison of LMW glutenin subunit combinations with previously published allelic diagrams [10] indicated partial correspondence. For instance, the Glu-B3b allele is expected to produce four subunits (8 + 9 + 13 + 16). In the present study, three of these four subunits were detected in cv. Kargala-28, consistent with the allele identification based on electrophoretic mobility (Figure 5, lane 2).
Similarly, in cv. Kargala-69, an LMW glutenin combination resembling the pattern of Glu-B3d, was observed; however, subunit 15 was absent. These observations highlight intra-allelic variability and partial expression of expected subunits, emphasizing that electrophoretic patterns may not always fully correspond to previously reported allelic formulas.
3.2. International Tetraploid Wheat Germplasm Collection
3.2.1. Gli-1 and Gli-2 Loci
Based on gliadin electrophoresis and the derived genetic formulas (Supplementary Material Table S1), the level of genetic polymorphism was as follows: Gli-B1, Gli-A2, and Gli-B2 loci showed polymorphism in 4 out of 95 accessions (4.2%), while Gli-A1 was polymorphic in 3.2% of samples. Overall, 6 out of 95 accessions (6.3%) carried rare gliadin alleles. The number of identified alleles per locus was: Gli-A1–15, Gli-B1–19, Gli-A2–22, and Gli-B2–36 alleles (Supplementary Material Table S3). Specifically, two new blocks were identified for Gli-B1 and Gli-A2, three for Gli-A1, and up to seven for Gli-B2. This variation may be attributed to the inclusion of wild tetraploid wheat accessions in the study. Within each locus, two or three alleles with the highest frequency predominated. The most frequent alleles were: Gli-A1c (29.8%), Gli-A1b (27.7%), Gli-B1a (27.7%), Gli-A2a (36.2%), Gli-A2o (25.0%), Gli-B2a (15.4%), and Gli-B2hk (13.8%) (Supplementary Material Table S3). Similar to the Kazakhstan collection, some genotypes shared identical gliadin compositions. For example, accessions Ld-12 and Ld-134 exhibited the combination: Gli-A1g, Gli-B1a, Gli-A2a, Gli-B2a. In these accessions, HMW glutenin subunits 1Bx7 and 1By8 were detected based on SDS-PAGE electrophoretic mobility. In Ld-12, the 1Bx7 band exhibited higher intensity, consistent with its putative identification as the allelic variant 1Bx7^OE^. Analysis of LMW glutenin subunits revealed allelic differences between these genotypes. Accession Ld-134 carried Glu-A3b, Glu-B3b, and Glu-B2b, whereas Ld-12 had Glu-A3b, Glu-B3i, and Glu-B2b. These results indicate allelic variation at the Glu-B3 locus between Ld-12 and Ld-134, despite identical gliadin profiles.
3.2.2. Glu-1 Loci
Similarly to the Kazakhstan durum germplasm collection, HMW glutenin spectra revealed the allelic variant of the 1Ax2* subunit (Figure 3). The total frequency of these subunits was 29.3%, whereas the functional null allele (Glu-A1c) occurred in 68.6% of accessions, nearly twice the frequency observed in the Kazakhstan collection. The 1Ax1 subunit was detected in only two accessions: Grecale (Italy) and Tibetka (Kyrgyzstan).
At the Glu-B1 locus, 13 HMW glutenin subunit combinations were identified. The most frequent were 1Bx6 + 1By8 (27.4%) and 1Bx7 + 1By8 (23.7%). Several combinations differed from the classical and supplemental HMW-GS nomenclature [27,33]. For example, in accession IG-85503 (Pakistan), a subunit pair identified by SDS-PAGE as 22x + 9 (Figure 6) was substantially different from classical subunits 9 and 22, representing a putative assignment based on electrophoretic mobility. Overall, polymorphism at glutenin-coding loci was low. At Glu-A1, only 2 of 95 accessions (2.1%) were polymorphic, and at Glu-B1, 1 of 95 accessions (1.1%) showed variation.
3.2.3. Glu-3 Loci
Using denaturing SDS-PAGE, seven variants of LMW glutenin subunits encoded by the Glu-A3 locus and eight subunit combinations encoded by the Glu-B3 locus were identified (Figure 7). The highest frequencies were observed for subunit 6 of the Glu-A3a allele (56.8%), as well as for the subunit combination 2 + 4 + 15 + 19 of the Glu-B3a allele (33.7%) and the combination 8 + 9 + 13 + 16 of the Glu-B3b allele (34.7%).
The majority of accessions from the international germplasm collection exhibited a null variant at the Glu-B2 locus.
3.3. Statistical Analysis
Based on statistical calculations, the proportion of rare alleles (h), intra-population (μ), and genetic diversity (H) of tetraploid wheats from both the International and Kazakhstan germplasm collections are presented in Table 1. The intra-population diversity indicator (μ) characterises the population based on the number of rare alleles and their frequency. For example, quite close values of 3.66 ± 0.10 and 3.44 ± 0.05 were found for the Glu-A1 locus in both germplasm collections. In the International germplasm collection, the null allele Glu-A1c predominated, with a frequency of 68.6%, whereas in the Kazakhstan collection, the frequency distribution of Glu-A1 alleles was more balanced (Figure 3). Despite the higher number of identified HMW glutenin variants in the International collection, the within-population diversity index (μ) was lower, reflecting the dominance of the null allele.
The proportion of rare alleles (h) reflects the evenness of allele frequency distribution. For the Glu-B1 locus, the h value was higher in wheat from Kazakhstan (0.44 ± 0.05) than in the international germplasm collection (0.26 ± 0.04), indicating a more uneven distribution of allele frequencies in the Kazakhstan population. In this collection, the subunit pair 1Bx7 + 1By8 predominated, whereas the remaining subunits occurred at much lower frequencies. In contrast, in the international durum wheat collection, subunit pairs 1Bx7 + 1By8 (23.9%) and 1Bx6 + 1By8 (27.7%) were observed at comparable frequencies, and other subunits also showed substantial occurrence, indicating a more even genotype distribution. The degree of genetic diversity (H) ranged from 0.32 at the Glu-B2 locus to 0.93 at the Gli-B2 locus. Overall, statistical analysis demonstrated that the international tetraploid wheat collection was characterized by higher allelic richness and genetic diversity (H) at most Gli loci, whereas the Kazakhstan collection exhibited a more uneven frequency distribution with a limited number of predominant alleles, particularly at the Glu-1 loci. These differences reflect contrasting population structures shaped by breeding history and germplasm composition.
3.4. Biochemical and Technological Analyses and Allelic Composition of Prolamins in Durum Wheat Breeding Lines from Kazakhstan
Over three years, 26 durum wheat breeding lines showed a mean protein content (PC) of 15.4% and gluten content (GC) of 32.9%. Gluten index (GI) and SDS-sedimentation (SDSS) averaged 36 units and 35 mL, respectively (Supplementary Material Table S2), with 16 lines exhibiting normal gluten strength.
Gliadin electrophoresis revealed γ45 components in 19 of 26 genotypes. HMW glutenins at Glu-A1 included 1Ax1 (46.2%) and Ax2* (36.5%), while Glu-B1 was represented mainly by 1Bx6 + 1By8 (14.3%) and 1Bx7 + 1By8, including 1Bx7^OE^ (84.6%). LMW glutenins were dominated by subunit 6 (Glu-A3a, 67.3%) and subunit 5 (Glu-A3b, 23.1%) at Glu-A3, and by 8 + 9 + 13 + 16 (Glu-B3b, 48.1%) and 2 + 4 + 15 + 16 (Glu-B3g, 26.9%) at Glu-B3. The Glu-B2 locus was largely represented by the null allele Glu-B2b (73%) (Supplementary Material Table S2). Correlation analysis indicated a positive relationship between GI and SDSS (r = 0.73 ± 0.14).
Associations between prolamin alleles and quality traits were evaluated using χ^2^ and Yule’s Q (Table 2). Preliminary optima of qualitative characteristics were compiled for the calculations: PC 13.5–15.5%; GC 28–35%; GI from 30 units or more; SDSS from 30 mm or more. Glu-A3a and γ45 showed positive effects on GI and SDSS, while Glu-B3b was associated with lower values.
Some loci, including Glu-B2b and 1Bx7 + 1By8, exhibited inconsistent trends across statistical tests, reflecting the polygenic nature of protein and gluten content. Given the limited sample size, associations not consistently supported by both χ^2^ and Yule’s Q should be considered indicative and require validation in larger datasets.
4. Discussion
The present results provide a basis for the selection of durum wheat genotypes with desirable quality traits. Gliadin and glutenin profiles were analysed in cultivars and breeding lines produced by the main Kazakh Breeding Centres, including rare tetraploid accessions from germplasm collections. These genotypes are of breeding interest due to traits such as higher gluten and protein content, elevated carotenoids, and disease resistance. Their inclusion enabled assessment of genetic diversity at Gli-1, Gli-2, Glu-1, and Glu-3 loci and evaluation of breeders’ preferences in allele combinations in Kazakhstan durum wheat relative to international tetraploid wheat.
For comparative analysis and statistical calculations, the tetraploid wheat accessions were grouped according to their eco-geographic origin. Six groups were formed: (1) Eurasian region: Kazakhstan, Russia, Kyrgyzstan, Armenia, China and Mongolia with 106 accessions; (2) Southwest and Southern Asia: Iraq, Iran, Syria, Pakistan, India, Afghanistan, Saudi Arabia, Israel and Palestine with 19 accessions; (3) North, East, and South Africa: Algeria, Ethiopia, Egypt, Morocco, Tunisia and South Africa with 14 accessions; (4) Australia with 6 accessions; (5) Southern, Western and Central Europe: Cyprus, Greece, Italy, Portugal, Spain, Switzerland, Austria and France with 23 accessions; (6) North and South America: USA, Mexico and Peru with 13 accessions. To obtain more detailed information on the genetic diversity of alleles encoding prolamin synthesis, previously published data were also used [8,9,11,13,16,18,34,35,36,37,38] (Supplementary Material Table S4). Loci Gli-B5 and Glu-B2 were not included in the comparative analysis, since the polymorphism of these genes was represented by only two allelic variants. In the current study, the characteristics of each gliadin- and glutenin-coding locus and the effects of their alleles are discussed separately.
4.1. Gli-1 and Gli-2 Loci
In the Kazakh tetraploid wheat collection, 59 of the 131 alleles were identified using the reference catalogue [26], confirming the comparability of the material with previously studied collections. The most prevalent alleles were Gli-A1g, Gli-B1a, Gli-A2a, and Gli-B2a, which are also typical of durum wheat cultivars from Russia, Ukraine, and China [14]. The Gli-A1g allele exhibited broad ecological plasticity and was detected in all geographic groups except the African one. The Gli-A1c allele, characteristic of Italian cultivars [39], was absent only from the Australian group, possibly reflecting the limited sample size. The Gli-A1b allele occurred in all six regions, reaching its highest frequencies in the African and European groups, and has previously been described as characteristic of Spanish durum wheat cultivars [39]. Alleles of the Gli-1 locus associated with gluten content and quality, particularly Gli-A1a and Gli-A1c [40], were detected at low frequencies in the Kazakh wheat collection. Several alleles (Gli-A1ab, Gli-A1f, and Gli-A1k) were specific to the Eurasian group and, despite their low frequencies, contributed to the maintenance of genetic diversity.
The Gli-B1 locus is of particular interest due to its tight linkage with the Glu-B3 locus on the short arm of chromosome 1B and its involvement in gluten quality formation [41]. Based on the present data combined with published reports, a total of 21 alleles have been described at this locus. The Gli-B1c and Gli-B1b alleles, encoding γ-45 gliadins and considered desirable, were most characteristic of the European group (Supplementary Material Table S5). In contrast, the Gli-B1a allele, encoding γ-42 gliadins and associated with reduced gluten quality [7], remained common across all groups, with the highest frequency in the Eurasian group and the lowest in the European group. The Gli-B1la allele was detected in all regions, exhibiting pronounced geographic variation in frequency.
The Gli-A2 locus exhibited exceptionally high allelic diversity. By combining literature data with the results of the present study, 26 alleles were identified, more than 80% of which were classified as rare (< 5%). The Gli-A2a and Gli-A2o alleles, typical of Ethiopian wheat [42], were present in all geographic groups, whereas a substantial proportion of alleles showed region-specific distributions (Supplementary Material Table S5). The highest number of rare alleles was recorded in the Eurasian group, indicating its role as a reservoir of genetic diversity.
For the Gli-B2 locus, 44 previously described alleles and 7 novel alleles were identified. The Gli-B2h and Gli-B2hk alleles, which form highly similar gliadin blocks, occurred in most groups and likely share a close genetic origin and similar effects on agronomically important traits. Notably, half of the alleles detected in the Eurasian group were unique to this region. Despite the small sample size, the Australian group contained endemic alleles, highlighting pronounced regional specificity. Calculations of within-population diversity (µ), genetic diversity (H), and the proportion of rare alleles (h) showed that the highest µ values for the Gli-1 and Gli-2 loci were characteristic of the Eurasian group (Supplementary Material Table S6, Table 3).
As shown in Table 3, the Eurasian group exhibited the highest average intra-population diversity (µ ± S_µ_) for the Gli-1 and Gli-2 loci (12.12 ± 0.75). However, when examined per locus, the maximum µ value varied between regions. For example, for the Gli-A1 locus, µ was higher in the Asian group (9.31 ± 0.91; n = 19) than in the Eurasian group (6.08 ± 0.44; n = 155), despite both groups having the same number of identified alleles (n = 11). This difference reflects the allele-frequency distribution: the Eurasian group was dominated by Gli-A1g (61.6%) and Gli-A1eb (17.7%), with the remaining nine alleles each below 5%, whereas the Asian group showed a more uniform distribution, with Gli-A1b and Gli-A1c at 26.3% and Gli-A1mc at 10.5%. Consequently, intra-population diversity is higher when allele frequencies are more evenly distributed. The additional diversity index, h, which equals 0 when alleles are equally frequent, further confirmed this pattern. For instance, the Gli-A1 locus in the Eurasian group had h = 0.44 ± 0.04, indicating a notable imbalance in allele frequencies (Supplementary Material Table S6). Notably, smaller groups, such as the Asian accessions, often displayed higher µ values for Gli-1 and Gli-2 loci, emphasizing the influence of both sample size and allele distribution. To assess inter-population differentiation, the identity criterion (I) was calculated using the r ± S_r_ indicator of genetic similarity (Table 4; Supplementary Material Table S7). When I exceeded the tabulated χ^2^ value at a given significance level, differences between groups were considered significant [43].
While I values did not always surpass χ^2^, reflecting high-frequency shared alleles, the index effectively captured overall inter-population differences, although it is less sensitive to rare alleles. Using a stringent significance threshold of 1% (p < 0.01), differences were observed for several region pairs, with additional distinctions at 5% (p < 0.05) for selected loci. These results highlight that both allele frequency distributions and chosen significance levels critically influence the detection of genetic differentiation across durum wheat populations.
4.2. Glu-1 Loci
The Glu-1 locus comprises two tightly linked genes encoding x- and y-type HMW glutenin subunits, which differ in molecular weight, isoelectric point, and cysteine residue content and collectively contribute to gluten polymer formation [4]. In durum wheat, the contribution of HMW-GS to grain and gluten quality is generally considered less pronounced than that of LMW-GS; nevertheless, numerous studies have reported significant but often inconsistent associations between specific Glu-1 alleles and technological traits [44,45].
In the present study, no statistically significant relationships between individual HMW-GS and grain quality parameters were detected, including in breeding lines carrying subunits frequently reported as favourable (e.g., 1Ax1, 1Bx7 + 1By8) (Table 2). During electrophoretic identification, several HMW-GS with mobility differing from reference catalogue subunits were detected [27,33]. Comparable observations have been reported in Portuguese, Mediterranean, and other tetraploid wheat collections, where previously unclassified alleles of the Glu-1 loci were described [46,47,48].
In particular, the Glu-A1o allele encoding subunit V has been associated with improved gluten quality relative to the common subunits 1Ax1 and 1Ax2 [4]. In the present work, subunits designated as 2** and 2*** based on electrophoretic mobility showed similarities to rare catalogue components; however, their correspondence to known alleles (including Glu-A1o) should be regarded as tentative. Definitive assignment requires molecular or proteomic characterization, which was beyond the scope of this study.
Allelic composition analysis showed that Glu-A1b and the null allele Glu-A1c predominated across all six geographic groups, a pattern consistent with previous reports and generally associated with reduced gluten quality [49,50]. Nevertheless, earlier studies demonstrated that the negative effect of Glu-A1c may be partially compensated by specific combinations of glutenin alleles at Glu-B1, Glu-A3, Glu-B3, and Glu-B2 loci [47]. Such compensatory combinations were identified in a limited number of accessions in the present collection (Supplementary Material Table S1), emphasizing the importance of multi-locus interactions rather than single-locus effects.
At the Glu-B1 locus, x-type subunits predominated across all regional groups, in agreement with their generally greater contribution to gluten strength compared with y-type subunits [51]. The most frequent subunit pairs (1Bx7 + 1By8, 1Bx6 + 1By8, and 1Bx20 + 1By20) correspond to those widely reported in durum wheat collections worldwide (Supplementary Material Table S8). While Glu-B1b (1Bx7 + 1By8) and Glu-B1d (1Bx6 + 1By8) are often associated with improved gluten properties, Glu-B1e (1Bx20 + 1By20) has been linked to reduced gluten strength and lower SDS sedimentation values [4,52]. Structural differences between these x-type subunits, including a cysteine-to-tyrosine substitution in the N-terminal domain of 1Bx20, have been proposed to impair gluten network formation by limiting disulfide bonding [3,53].
Population-level analysis revealed the highest intra-population diversity (µ) for HMW-GS in the European group (Table 3), reflecting both a large number of detected subunits and a more even allele frequency distribution. Elevated diversity at the Glu-A1 and Glu-B1 loci in European accessions is consistent with the long breeding history and extensive germplasm exchange within this region. In contrast, other regional groups were characterised by a smaller number of high-frequency alleles accompanied by a higher proportion of rare variants, resulting in lower effective diversity values. Elevated diversity at the Glu-A1 and Glu-B1 loci in European accessions is consistent with the long breeding history and extensive germplasm exchange within this region. In contrast, other regional groups were characterised by a smaller number of high-frequency alleles accompanied by a higher proportion of rare variants, resulting in lower effective diversity values (Table 5, Supplementary Material Table S7).
Pairwise identity analysis demonstrated statistically significant differences between most regional groups at the Glu-1 loci. These differences were largely driven by variation in allele frequencies rather than by the presence of region-specific alleles, as the majority of accessions shared a limited set of common HMW-GS. When interpreted with this limitation in mind, the identity criterion provides evidence for moderate but significant population differentiation shaped primarily by unequal representation of widespread alleles.
Overall, the results indicate that although substantial polymorphism exists at the Glu-1 loci in durum wheat, the direct effect of individual HMW-GS on grain quality traits is highly variable and strongly dependent on genetic context. The findings emphasise the need for integrative analyses combining HMW- and LMW-GS composition with molecular characterisation and standardised quality assessments to clarify the functional significance of Glu-1 alleles in breeding programmes.
4.3. Glu-3 Loci
The LMW glutenin subunits of durum wheat are controlled by the Glu-A3, Glu-B3, and Glu-B2 loci, which are closely linked to the gliadin loci Gli-A1, Gli-B1, and Gli-B3, respectively [4]. Although early catalogues reported a limited number of alleles at these loci, subsequent studies have demonstrated a substantial expansion of allelic diversity, particularly at Glu-A3 and Glu-B3 [7,18,47,54,55]. This increasing complexity highlights the difficulty of interpreting individual Glu-3 effects without considering allelic combinations.
Previous studies have ranked Glu-A3 alleles according to their contribution to gluten viscoelastic properties, with alleles h, c, d, and a generally associated with higher sedimentation values [56]. In agreement with earlier reports [57], our work confirmed a positive association between Glu-A3a (subunit 6) and sedimentation level. In contrast, the effects observed for Glu-A3b (subunits 8 + 9 + 13 + 16) on sedimentation level and gluten index differed from published data [56,57], suggesting that genotype × environment interactions may obscure direct allelic effects. Combinations of HMW-GS and LMW-GS have therefore been proposed as more reliable predictors of semolina quality than individual alleles [47]. In this context, the presence of Glu-A3, Glu-B3, and Glu-B2 alleles a or b, together with Glu-A1c and Glu-B1d, has been associated with superior quality, whereas genotypes carrying Glu-A1c and Glu-B1e+f in combination with Glu-A3a, Glu-B3a, and Glu-B2a+b generally show reduced quality parameters [10,47]. This classification should be regarded as approximate, as grain quality is strongly influenced by environmental and agronomic factors [58,59].
Nevertheless, group-specific allelic variants were identified at the Glu-3 loci. At Glu-A3, several alleles were unique to the European group, whereas alleles a, b, c, d, and h were detected across all geographic groups, with Glu-A3a being the most frequent overall (Supplementary Material Table S9).
The Glu-B3 locus plays a central role in gluten quality through its control of LMW glutenin subunits, particularly those forming the LMW-2 pattern, which has been repeatedly associated with improved gluten strength [4,57,60]. In the present study, the negative effects of Glu-B3b [10] or Glu-B3s [55] on gluten index and SDSS volume were statistically confirmed (Table 2), consistent with earlier reports assigning a key positive role to Glu-B3a or Glu-B3r [10,55].
Using recommended combinations of HMW- and LMW-GS associated with high gluten quality [47,60,61], breeding lines were divided into two groups (Supplementary Material Table S2). Lines lacking Glu-B3b and carrying favourable Glu-B3 alleles exhibited significantly higher mean values of gluten index and SDSS, while no differences were detected for protein or gluten content. These results support the practical value of combined HMW–LMW glutenin profiles for discriminating breeding material with contrasting gluten quality. Analysis of allelic distribution revealed that Glu-B3 alleles a, b, c, and d were present in all geographic groups, although with different frequencies (Supplementary Material Table S9). The proportion of group-specific alleles was highest in European wheats, which also showed the greatest within-population variation (μ) and genetic diversity (H) at the Glu-A3 and Glu-B3 loci (Table 3).
Identity criterion (I) values for the Glu-3 loci are presented in Table 5. While some group comparisons did not reach significance at the most stringent threshold, consistent trends toward differentiation became apparent when data were considered across loci, indicating moderate but non-random divergence among geographic groups.
Finally, clustering based on the allelic composition of the Gli-1, Gli-2, Glu-1, and Glu-3 loci (Figure 8) revealed a clear pattern of regional genetic differentiation. Overall, allelic overlap among geographical groups was low. The highest proportion of shared alleles was observed between Australian and American accessions, with 24 of the 264 identified alleles being common to both groups (9.0%). Comparisons involving African accessions showed a similar but slightly lower level of overlap (8.3%), while Eurasian and Asian accessions shared the smallest proportion of alleles with other regions (7.5%). The distinct clustering of Eurasian wheat is largely attributable to the accumulation of region-specific alleles at the Gli-B2 locus, which were absent from other geographical groups and contributed substantially to its separation on the dendrogram. European wheat exhibited the highest degree of genetic distinctness, with 37.8% of alleles being unique to this region, reflecting pronounced variability at the Glu-B1 and Glu-B3 loci. Taken together, these results emphasize the central role of polymorphism at B-genome prolamin loci—particularly Gli-B2, Glu-B1, and Glu-B3—in shaping the regional structure of genetic diversity in durum wheat.
5. Conclusions
The identification of gliadin, HMW, and LMW glutenin alleles in durum wheat revealed substantial genetic diversity. Native and SDS-electrophoresis of prolamins remains an accessible and informative approach for analysing gluten protein composition. A set of 181 tetraploid wheat accessions, including 86 from Kazakhstan and 95 from the International germplasm collection, was studied for Gli-1, Gli-2, Glu-1, and Glu-3 loci.
In total, 145 allele combinations of gliadin and glutenin were identified. Biochemical analysis and identification of HMW and LMW glutenin subunits were performed in 26 breeding lines. A positive association was observed between the gliadin component γ45 and the Glu-A3a allele, reflected in higher SDSS and GI values. In contrast, the Glu-B3b allele was associated with lower gluten quality. Statistical analyses revealed systematic differences in prolamin composition among genotypes from diverse ecological zones and geographic origins. These findings provide a basis for selecting durum wheat genotypes with potentially superior gluten quality in breeding programs.
The reference list from the paper itself. Each links out to its DOI / PubMed record.
- 1Colasuonno P. Marcotuli I. Blanco A. Maccaferri M. Condorelli G.E. Tuberosa R. Parada R. de Camargo A.C. Schwember A.R. Gadaleta A. Carotenoid pigment content in durum wheat (Triticum turgidum L. var durum): An overview of quantitative trait loci and candidate genes Front. Plant Sci.201910134710.3389/fpls.2019.0134731787991 PMC 6853866 · doi ↗ · pubmed ↗
- 2Sissons M. Durum wheat products—Recent advances Foods 202211366010.3390/foods 1122366036429252 PMC 9689131 · doi ↗ · pubmed ↗
- 3Shewry P.R. Halford N.G. Lafiandra D. Genetics of wheat gluten proteins Adv. Genet.20034911118410.1016/s 0065-2660(03)01003-412779252 · doi ↗ · pubmed ↗
- 4Ruiz M. Giraldo P. The influence of allelic variability of prolamins on gluten quality in durum wheat: An overview J. Cereal Sci.202110110330410.1016/j.jcs.2021.103304 · doi ↗
- 5Cros D. Wrigley C.W. Hare R.A. Prediction of durum-wheat quality from gliadin-protein composition Aust. J. Agric. Res.19823342944210.1071/AR 9820429 · doi ↗
- 6Yupsanis T. Moustakas M. Relationship between quality, colour of glume and gliadin electrophoregrams in durum wheat Plant Breed.1988101303510.1111/j.1439-0523.1988.tb 00263.x · doi ↗
- 7Ruiz M. Bernal G. Giraldo P. An update of low molecular weight glutenin subunits in durum wheat relevant to breeding for quality J. Cereal Sci.20188323624410.1016/j.jcs.2018.09.005 · doi ↗
- 8Oak M.D. Tamhankar S.A. Rao V.S. Bhosale S.B. Relationship of HMW, LMW glutenin subunits and γ-gliadins with gluten strength in Indian durum wheats J. Plant Biochem. Biotechnol.200413515510.1007/BF 03263191 · doi ↗