Integrative Taxonomy Clarifies Species Limits in Two Closely Related Solitary Wasps: Pachymenes ater and Pachymenes ghilianii (Hymenoptera: Vespidae: Eumeninae)
Wellington Ferreira, Rodolpho Menezes, Matheus Viana, Marcel Hermes

TL;DR
This study uses multiple methods to clarify the species boundaries between two similar wasps, Pachymenes ater and Pachymenes ghilianii, improving their classification and understanding.
Contribution
The study introduces an integrative approach combining morphology, genetics, and geography to resolve species limits in a morphologically similar wasp group.
Findings
Traditional morphological traits are unreliable for distinguishing Pachymenes ater and P. ghilianii.
New morphological features and genetic data support their classification as separate species.
An integrative method improves species delimitation in morphologically conserved wasp groups.
Abstract
Telling closely related species apart can be difficult when they look very similar on the outside. This problem occurs in a group of solitary wasps found in Central and South America, where two suspected sister species have long been hard to separate because they share many body features and often live in the same regions. In this study, we investigated whether these two wasps truly represent separate species by examining them in several ways. We looked closely at body structures, including some features that had not been considered before, and compared them with modern genetic information and data on where each form is found. We discovered that some of the traits traditionally used to identify the species are not reliable, but other, previously overlooked features help distinguish them more clearly. The genetic evidence also supports the idea that they are two separate species and…
Genes, proteins, chemicals, diseases, species, mutations and cell lines named across the full text — each resolved to its canonical identifier and authoritative record.
Click any figure to enlarge with its caption.
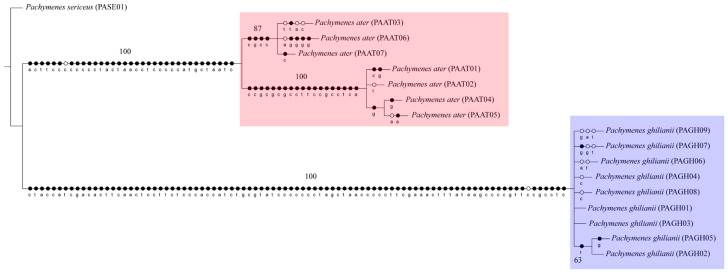 Figure 1
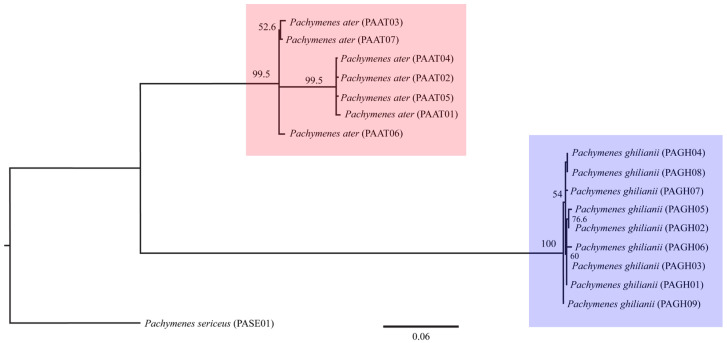 Figure 2
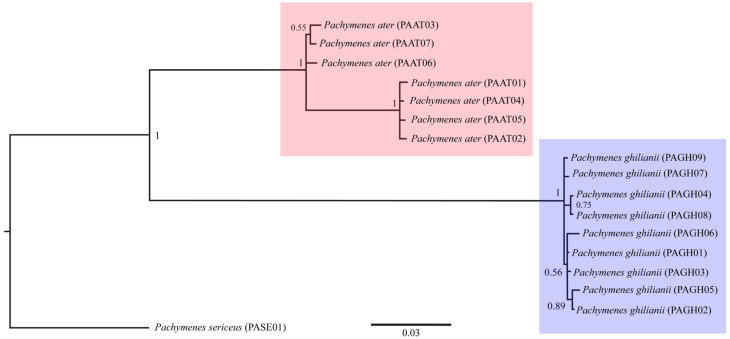 Figure 3
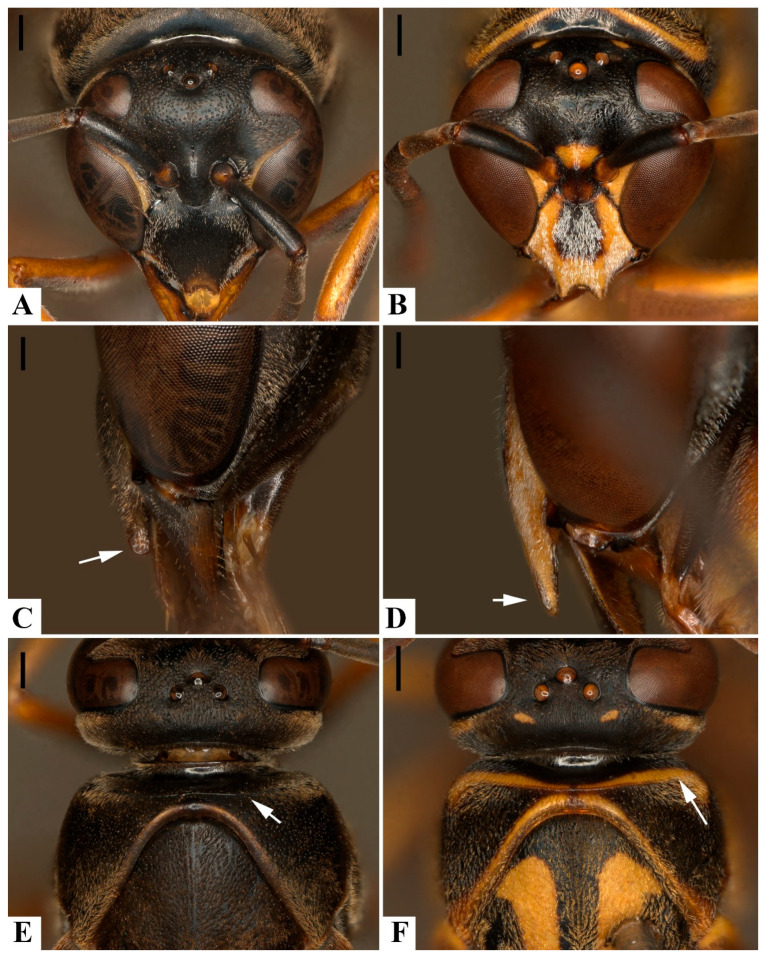 Figure 4
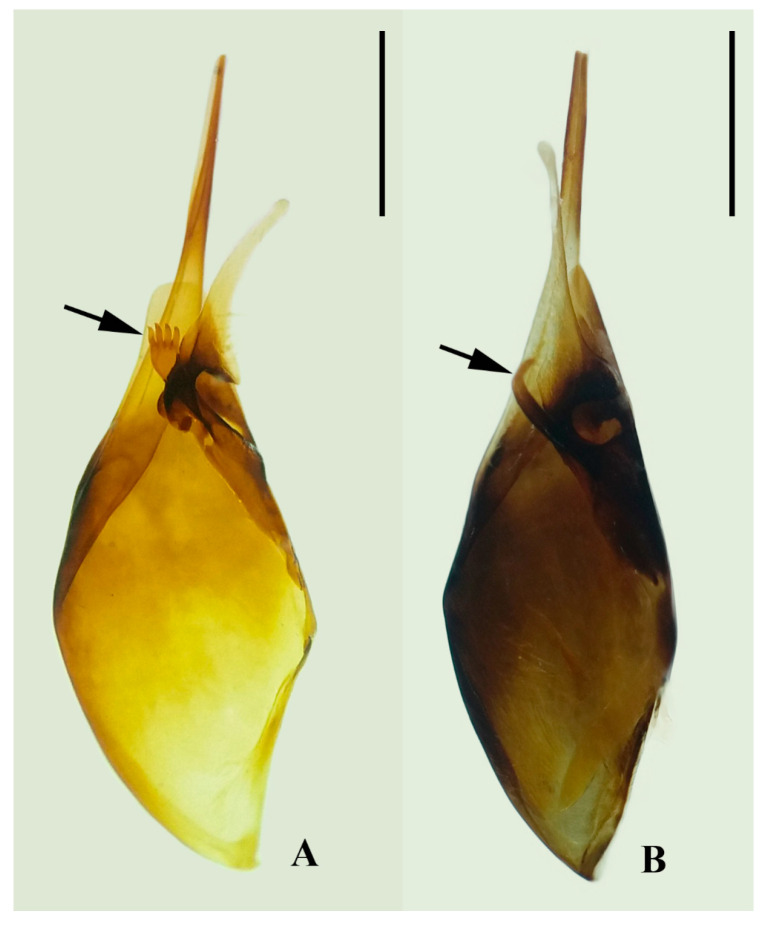 Figure 5
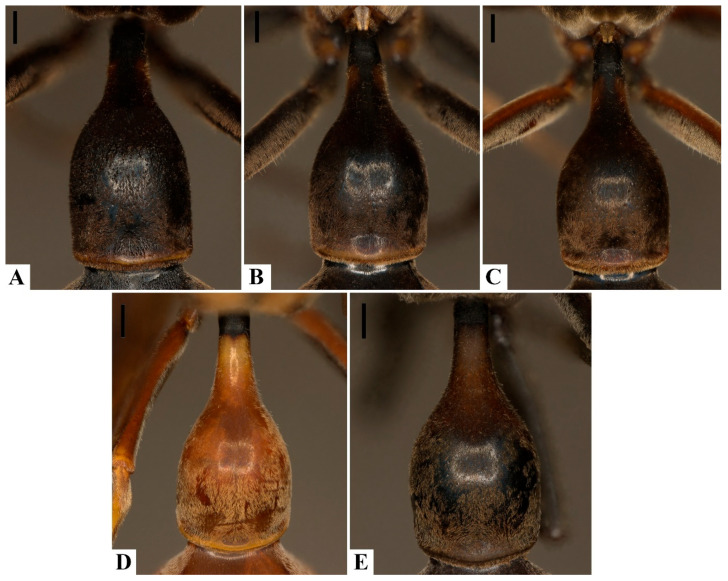 Figure 6
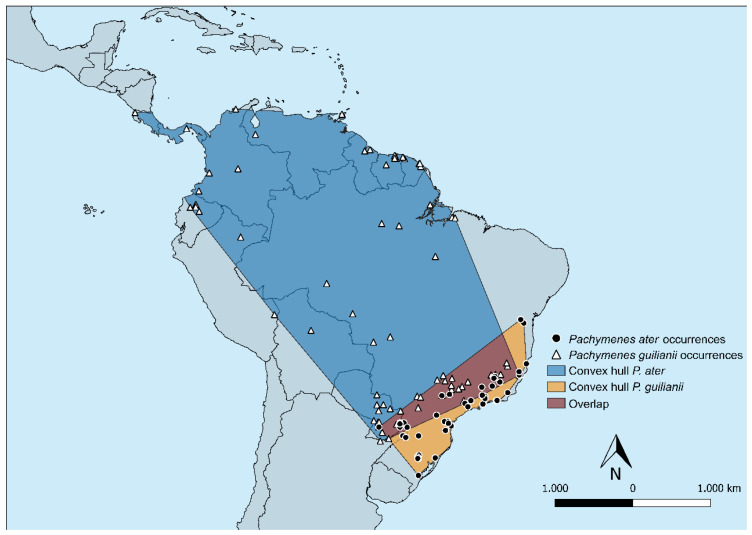 Figure 7
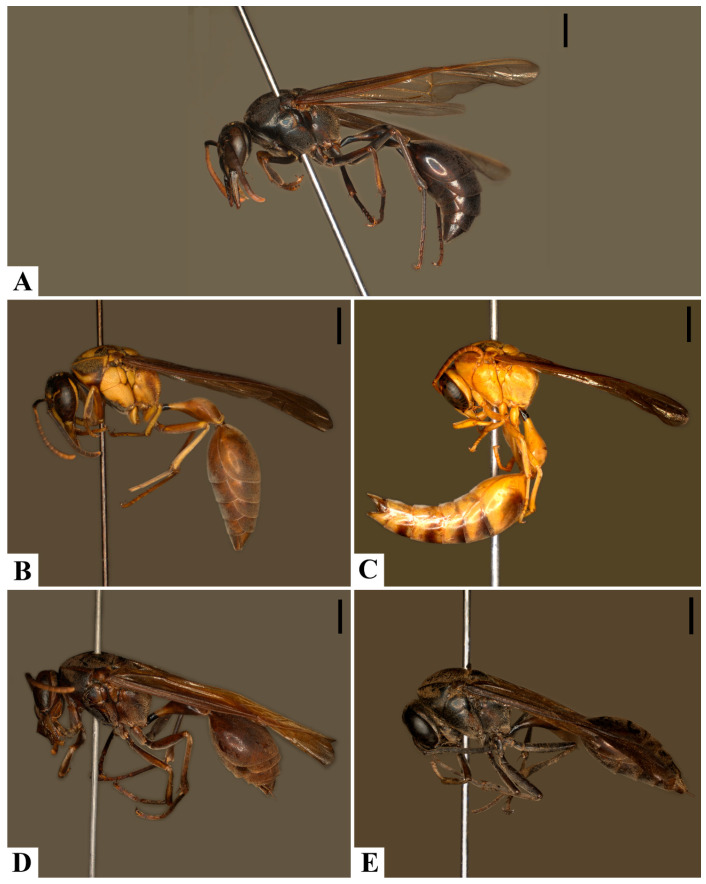 Figure 8
- —Conselho Nacional de Desenvolvimento Científico e Tecnológico (CNPq—Brazil)
Peer Reviews
No public reviews on file for this paper yet. If you reviewed it on a platform where reviews are public (OpenReview, ICLR, NeurIPS, ICML), you can paste yours below so the community can read it here.
Videos
No videos yet. Explain this paper in a talk, walkthrough, or lecture? Add one.
Taxonomy
TopicsInsect and Arachnid Ecology and Behavior · Plant and animal studies · Fossil Insects in Amber
1. Introduction
Integrative taxonomy has emerged as a powerful framework for species delimitation, advocating the use of multiple and complementary data sources to achieve more accurate taxonomic decisions [1,2,3,4]. Under this approach, biodiversity is investigated through a multifaceted perspective that incorporates biological data from morphology, molecular biology, behavior, and ecology to address questions concerning the nature and boundaries of species [1].
Despite methodological and logistical challenges, integrative taxonomy has gained substantial traction in recent years. Within Hexapoda, studies focused on Hymenoptera represent a significant portion of integrative taxonomic literature [5,6,7,8,9,10]. Some studies are of particular interest [7,9,11,12,13], which apply integrative methods to Vespidae. Nonetheless, many lineages within this family remain poorly studied from this perspective, including the subfamily Eumeninae.
The genus Pachymenes de Saussure is a Neotropical group of solitary wasps [14,15], reported in Brazil from Atlantic Forest fragments, highland regions, and the Cerrado [16,17]. A comprehensive taxonomic revision of Pachymenes was conducted in recent years [15], recognizing 18 valid species and presenting a phylogenetic hypothesis. In their treatment, the authors discouraged the recognition of subspecies, aligning with earlier critiques of infraspecific taxa based solely on cuticular coloration in vespids [18,19].
Although their study clarified species relationships within the genus, certain taxonomic issues remain unresolved. One such case involves the delimitation of Pachymenes ater de Saussure and Pachymenes ghilianii (Spinola), recovered as sister species in their phylogenetic analysis and united by a single homoplastic trait—punctation on the second metasomal tergum [15]. Identification of these species using the available key can be problematic due to overlapping or ambiguous morphological characters. For instance, the most accessible character applicable to both sexes—development of the pronotal carina—is described as weak or medially restricted in P. ater and more strongly developed across the dorsal pronotal surface in P. ghilianii. However, the subjective nature of this distinction and the absence of illustrations render it difficult to apply reliably, especially without comparative material at hand.
A second character, coarse punctation on the apical half of the first metasomal tergum (in P. ater) versus smooth or finely punctate (in P. ghilianii), also lacks diagnostic clarity, as both conditions are described as “usually” present, with no mention of potential overlap. Furthermore, variation in cuticular coloration adds to the confusion. While P. ghilianii typically displays a yellowish-brown integument with black markings, melanic forms closely resemble P. ater, which is generally uniform in dark coloration with minimal markings [14,15].
The potential for sympatric occurrence adds a further layer of complexity. Distributional records suggest overlap between these species, and in some localities, specimens of both are morphologically similar with respect to color and putatively diagnostic traits [14,15]. As a result, species boundaries between P. ater and P. ghilianii remain unclear.
To date, few studies have explored such frameworks in solitary vespids. Taxonomic work in Eumeninae remains reliant on discrete morphological characters, leaving species hypotheses under-tested. A reassessment of current morphological criteria, alongside the inclusion of additional data (e.g., molecular markers, ecological preferences), is necessary to improve species delimitation. Following the principles of integrative taxonomy [20,21], this study applies a multi-evidence approach to investigate the validity and limits of P. ater and P. ghilianii.
2. Materials and Methods
2.1. Sampling
Specimens from multiple localities were used in order to cover the geographic distribution of P. ater and P. ghilianii. Both dry-mounted and ethanol-preserved specimens (90%) were employed for molecular analyses (Table S1 in Supplementary Material—henceforth SM). Morphological studies were conducted exclusively on dry-mounted material (see SM). For phylogenetic analyses (see below), Pachymenes sericeus (de Saussure) was used as the outgroup.
Specimens were identified to species level following the key provided by Grandinete et al. [15], and comparisons were made with material previously identified by the same authors. The specimens were sourced from the Coleção Entomológica da Universidade Federal de Lavras (CEUFLA), and on loan from the following institutions: AMNH, American Museum of Natural History (New York, NY, USA—Dr. James Carpenter); DZSJRP-Hymenoptera, Coleção de Hymenoptera de São José do Rio Preto, Instituto de Biociências, Letras e Ciências Exatas, Universidade Estadual Paulista “Júlio de Mesquita Filho” (São José do Rio Preto, Brazil—Dr. Fernando Noll); RPSP, Coleção Entomológica Prof. J.M.F. Camargo, Faculdade de Filosofia, Ciências e Letras de Ribeirão Preto, Universidade de São Paulo (Ribeirão Preto, Brazil—Dr. Eduardo Andrade Botelho de Almeida); CESC/UNISC, Coleção Entomológica da Universidade de Santa Cruz do Sul (Santa Cruz do Sul, Brazil—Dr. Andreas Köhler) (see Supplementary Materials).
2.2. DNA Extraction, Amplification, Sanger Sequencing, and Sequence Edition
Thoracic muscle was extracted from both dry-mounted and ethanol-preserved specimens, following the removal of the head and forelegs. Specimens were then remounted, preserving the exoskeleton. DNA was extracted from the isolated thoracic muscle using the QIAquick^®^ Gel Extraction Kit (QIAGEN, Hilden, Germany). Two mitochondrial protein-coding genes were tested for amplification efficiency: Cytochrome c oxidase subunit I (COI), primers: CI-J-1718 [22] and CI-N-2191 [23]; and Cytochrome c oxidase subunit II (COII), primers: E2 [24] and COII1-2 [25]. Genbank accession numbers for specimens whose COI was amplified range from PX649439 to PX649454, and for COII from PX685873 to PX685884 (Table S3). Specific PCR conditions followed [26,27] (see also Table S2). PCR products were purified using the QIAquick^®^ PCR Purification Kit (QIAGEN) following the standard protocol and sent for sequencing to the Centro de Recursos Biológicos e Biologia Genômica (CREBIO), Universidade Estadual Paulista “Júlio de Mesquita Filho” (Jaboticabal, Brazil).
Sequence quality was evaluated using Geneious v7.1.3 [28]. Forward and reverse reads were assembled into contigs within the same software. Contigs were edited to remove sequencing noise and to identify ambiguous bases. All samples were processed, but only 17 yielded successful amplification for at least one marker (Table S3).
Independent alignments for each locus were performed using MUSCLE (Multiple Sequence Alignment) with default parameters [29]. Alignments were visualized and edited in Mesquite v3.31 [30], which was also used to generate the concatenated dataset.
Partitioning and molecular evolution model selection were performed using PartitionFinder2 [31], applying the Bayesian Information Criterion (BIC). The molecular evolution models for each gene are listed in Table S4. Phylogenetic analyses were conducted separately for each locus and also using the concatenated dataset (see below).
2.3. Phylogenetic Analyses
Phylogenetic reconstructions were conducted using maximum parsimony (MP), maximum likelihood (ML), and Bayesian Inference (BI). MP analyses used equal character weighting [32]. Heuristic searches were performed in TNT v1.1 [33] using “New Technology Search” with the following settings: Sectorial Search [34] in default mode, Ratchet [35] with 200 iterations and perturbation phase set to 8 (for both up- and down-weighting), Drift [34] with 20 cycles, and Tree Fusing [34] with 10 rounds. The procedure was repeated until the shortest tree length was recovered at least 100 times. Random seed was set to 0. Gaps were treated as missing data. Clade support was assessed by bootstrap with 1000 replicates under traditional search.
ML trees were inferred using Garli 2.01 [36] under default settings. Branch support was assessed via 1000 bootstrap replicates and summarized as a 50% majority-rule consensus tree in PAUP* v4 [37]. BI analyses were performed in MrBayes v3.2.3 [38], using two independent runs of four chains for 50 million generations, sampling every 1000 generations, with 20% burn-in. Burn-in, convergence, and stationarity were assessed using Tracer v1.6 [39]. Trees resulting from MP analyses were visualized and edited in WinClada v1.00.08 [40], while ML and BI trees were processed in FigTree v1.4.0 [41].
2.4. Morphological Character Reassessment
Morphological character reassessment was based on both the phylogenetic results and direct comparative analysis among studied specimens. Comparative analyses were conducted between specimens from the same locality and/or corresponding to the same molecular clade, as well as between specimens of different clades. Additionally, diagnostic characters for the genus Pachymenes and both studied species, as previously proposed in the literature [15,42], were reevaluated to assess their variation and taxonomic reliability.
Special attention was given to characters traditionally used in keys and species diagnoses, including those related to the coloration of the metasoma and appendages, body punctation and sculpture, male genitalia, clypeal and cephalic morphology, mesosomal configuration, and wing venation. Morphological variation was interpreted in light of the molecular results, especially to evaluate whether the observed variation corresponded to intraspecific polymorphism or indicated interspecific divergence.
For diagnostic purposes, emphasis was placed on characters with minimal ontogenetic variation and low environmental plasticity. Whenever possible, we prioritized the use of discrete, qualitative characters with high interspecific stability, minimizing the reliance on continuous or highly variable traits.
Terminology for general external morphology and for male genitalia followed traditional works on Eumeninae [43,44]. Some terms referring to the mesepisternal region were adapted [45]. The abbreviations F1–F11 were used for antennal flagellomeres, while T1–T7 and S1–S7 refer to metasomal terga and sterna, respectively.
Morphological traits were reanalyzed in light of the phylogenetic clades recovered in both separate and combined analyses, as well as the results of the species delimitation tests. For each clade, we verified the consistency of diagnostic characters that may support species recognition.
2.5. Environmental Space, PCA, and Niche Overlap
We used occurrence records of both species (Table S1). From the monthly TerraClimate dataset (1958–2024; https://www.climatologylab.org/terraclimate.html, accessed on 15 September 2025), including minimum temperature, maximum temperature, and precipitation, we derived the 19 standard bioclimatic variables (BIO01–BIO19) using the biovars function in the dismo package [46]. To reduce multicollinearity, we applied Pearson correlation analysis and excluded variables with |r| ≥ 0.70 [47]. The remaining predictors were BIO01 (annual mean temperature), BIO02 (mean diurnal range), BIO03 (isothermality), BIO12 (annual precipitation), and BIO15 (precipitation seasonality) (Table S2). This five-variable subset jointly captures thermal averages, intra-daily and seasonal temperature variation, and the hydrological regime, while minimizing redundancy among predictors.
The accessible area (M) for each species was defined as the minimum convex polygon (MCP) encompassing all occurrences and buffered by 100 km. Random background points were sampled within each species-specific M (M_1_, M_2_) and within their union (M_1_ ∪ M_2_). The union area was used to calibrate the environmental space, while the individual M represented species-specific environmental availability. Environmental space was summarized using a principal component analysis (PCA) based on the background of M_1_ ∪ M_2_ (centered and scaled data), and both occurrence and background points were projected onto the first two principal components (PC1–PC2).
In the PCA-environment framework, we computed kernel density grids (R = 100) [48], as implemented in the ecospat package [49], resulting in normalized environmental utilization surfaces. Niche overlap was quantified using Schoener’s D, and overlap levels were classified according to Engler’s framework: 0–0.2 (no overlap), 0.2–0.4 (low), 0.4–0.6 (moderate), 0.6–0.8 (high), and 0.8–1.0 (very high) [50]. Niche equivalence was tested using permutations within the combined background (H_0_: niches are indistinguishable in the PCA-env), while directional similarity was assessed in both directions (A → B and B → A) [51]. For each test, the target species’ niche was kept fixed and the source species’ occurrences were randomized within M_B, with 1000 permutations.
Finally, to evaluate the robustness of our results, we repeated the entire workflow using only BIO01 and BIO12 (annual mean temperature and annual precipitation, respectively). We then compared Schoener’s D, test p-values, and the cumulative variance explained by PC1 + PC2 between both analyses.
3. Results
3.1. Molecular Data
Sequences were obtained for 16 samples (COI; 472 bp) and 12 samples (COII; 617 bp). These were independently aligned and then concatenated into a final matrix of 17 terminals and 1089 characters. Among the 1089 characters, 841 were constant, 185 were parsimony-informative, and 63 were variable but uninformative.
3.2. Phylogenetic Analyses
The three phylogenetic methods (MP, ML, and BI), both the concatenated (COI + COII) and single-locus datasets consistently recovered P. ater and P. ghilianii as reciprocally monophyletic with strong statistical support (Figure 1, Figure 2 and Figure 3 and Figures S1–S6). Maximum parsimony yielded five equally parsimonious trees that, despite limited internal resolution, delineated two well-supported species-specific clades and revealed two subgroups within P. ater. Maximum likelihood similarly supported monophyly in all datasets, though it recovered different internal topologies and consistently identified a highly divergent lineage within P. ater (PAAT01, PAAT02, PAAT04, PAAT05). Finally, Bayesian inference also strongly supported monophyly for both species in all analyses, with internal relationships largely congruent with MP and ML for P. ater, but more variable for P. ghilianii. Together, these results robustly confirm species-level distinctiveness while revealing considerable genetic structuring within P. ater.
3.3. Reassessment of Morphological Characters
Males of the two species can be reliably distinguished by the shape of the clypeus and genitalia (Table 1). The male clypeus provides the most accessible diagnostic feature: in P. ater, its apical portion is broader, anteriorly expanded, and distinctly convex, with a rounded apical margin; in P. ghilianii, it is narrower, nearly flat in frontal view, and more pointed apically (Figure 4A–D). In contrast, females—particularly those with atypical coloration—are more difficult to identify based solely on external morphology.
The pronotal carina remains the most consistent external character distinguishing P. ater and P. ghilianii, being weakly developed and often restricted to the median region in P. ater, but strongly developed and continuous across the pronotum in P. ghilianii (Figure 4E,F; [15]). The inclusion of detailed photographs in the present study provides improved visualization of this diagnostic feature.
Male genitalia also exhibit informative species-level differences. The apical projection of the gonocoxite clearly separates the species, with P. ater showing two to five digitiform projections and P. ghilianii only one (Figure 5A,B). This trait, together with the pattern of digitus setation—long, numerous setae in P. ater versus short, concentrated setae in P. ghilianii—offers robust diagnostic potential.
Punctation on the first metasomal tergum (T1), although previously proposed as diagnostic, proved unreliable. Both species display overlapping variation in puncture density and depth (Figure 6A–E), and no specimens of P. ater exhibited the truly coarse punctation described in earlier works. Such variation appears correlated with general cuticular sculpture and coloration, as melanic specimens tend to show reduced contrast in surface features, occasionally obscuring carinae or sulci.
Overall, our morphological comparison indicates that the shape of the clypeus and male genitalia provide stable diagnostic characters, while the pronotal carina and T1 punctation are more variable and prone to misinterpretation. The figures presented here facilitate accurate identification of P. ater and P. ghilianii and refine the diagnostic framework for Pachymenes species.
3.4. Niche Overlap of Pachymenes ater and P. ghilianii
Collection records for P. ater and P. ghilianii are shown in Figure 7, and the chromatic variation can be seen in Figure 8A–E. Pachymenes ghilianii exhibits a broader distribution than P. ater. Specimens have been recorded from central-southern Brazil, Argentina, and Paraguay, extending northward to the Guianas, Trinidad and Tobago, Ecuador, Colombia, Costa Rica, Panama, and Suriname. In Brazil, the species occurs across multiple biomes, including the Amazon, Atlantic Forest, Cerrado, and Pantanal domains. No records are known from coastal regions of the continent. By contrast, P. ater shows a more restricted potential distribution, with collection records concentrated in the southeastern region of South America—specifically from Argentina, Paraguay, and Brazil.
With five variables (BIO01, BIO02, BIO03, BIO12, BIO15), niche overlap between species was moderate, with Schoener’s D = 0.382 (Table 2). The equivalence test did not reject indistinguishable niches (p = 0.525), and directional similarity was not significant in either direction (A → B p = 0.374; B → A p = 0.384) (see Table 2). The PCA explained 70.2% of the variance in PC1 plus PC2 (PC1 = 44.3%; PC2 = 25.9%) (Table 2). In the sensitivity analysis using only BIO01 and BIO12, the metric decreased to D = 0.144, and tests led to the same conclusion (equivalence p = 0.602; directional similarities not significant).
There is a partial overlap in the geographical distributions of P. ater and P. ghilianii. In sympatric populations, however, individuals of each species exhibit distinct body coloration. Specimens of P. ater are typically dark brown to blackish, with none or very few pale-yellow markings (Figure 8A). In contrast, individuals identified as P. ghilianii generally have brownish integuments with extensive yellow markings (Figure 8B), a pattern observed in most of the examined specimens of this species. Nevertheless, given the wide distribution of P. ghilianii, significant intraspecific color variation is observed, ranging from the typical brownish pattern with yellow markings to entirely melanic individuals (Figure 8B–E).
Melanic individuals of P. ghilianii—with predominantly dark integument—have been recorded from northern Brazil (Amazonas), Ecuador, Costa Rica, and Peru. In contrast, individuals with the more typical brown-yellow coloration appear to have a broader potential distribution. One male specimen with yellow integument and few brown markings was recorded from Trinidad and Tobago. However, the lack of brown markings in this specimen may be due to its age and preservation state (collected in 1963) (Figure 8C). A single P. ghilianii specimen with entirely black integument was observed, originating from Costa Rica (Figure 8E). No other specimens with completely dark integument were examined; all remaining individuals showed at least some brown or yellow markings.
4. Discussion
Our primary hypothesis—that Pachymenes ater and P. ghilianii are reciprocally monophyletic species—was consistently supported across all three phylogenetic methods. All analyses recovered two well-supported monophyletic groups corresponding to each species, using both combined and individual COI and COII datasets. Within P. ater, two clades were recovered, but no geographical structure was observed. In contrast, the internal relationships within P. ghilianii were less stable and lacked high support, despite broad geographic sampling.
The divergence within P. ater is notable given its more restricted distribution and externally uniform morphology. However, previous studies have documented substantial variation in male genitalia in this species [15], supporting our findings. This suggests that genitalic and molecular divergence may occur despite morphological uniformity in external traits. Environmental and biogeographic factors may explain this pattern. As an Atlantic Forest species, P. ater may experience genetic isolation due to habitat fragmentation during Pleistocene climate fluctuations [27,52]. A more comprehensive phylogeographic analysis, including targeted sampling and morphometric data, would help test this hypothesis.
Despite ongoing debate about the sole use of COI barcoding for species delimitation [53,54], it remains a useful tool when integrated with other lines of evidence [55]. Our results align with other integrative taxonomic approaches [7,56], particularly under monophyly- and lineage-based species concepts [57,58,59], which regard reciprocal monophyly as a strong criterion for species recognition.
Thus, molecular evidence corroborates the morphological distinction between P. ater and P. ghilianii proposed in previous taxonomic revisions [14,15]. The mitochondrial markers employed proved effective in distinguishing these species. While we emphasize the importance of integrating morphology, we also advocate for the use of mitochondrial markers in taxonomic studies of Eumeninae.
Although mitochondrial gene trees may not reflect species histories [60], recent analyses based on mitochondrial genome-scale data have recovered well-established topologies within the polistines [61], reinforcing the utility of mitochondrial markers for the understanding of historical relationships. Our results further demonstrate the usefulness of these markers for species delimitation of solitary wasps. DNA extraction from older museum specimens, though challenging due to degradation in dry-pinned insects [62], yielded high-quality sequences for COI and COII.
5. Conclusions
Our findings provide robust molecular support for the reciprocal monophyly of Pachymenes ater and P. ghilianii, confirming their status as distinct species under integrative taxonomic frameworks. Moreover, the detection of divergent lineages within P. ater, despite its external morphological uniformity, highlights the importance of incorporating both molecular and morphological data to uncover cryptic diversity. Together, our results reinforce the value of integrative approaches in clarifying species limits in morphologically conserved insect groups.
The reference list from the paper itself. Each links out to its DOI / PubMed record.
- 1Dayrat B. Towards integrative taxonomy Biol. J. Linn. Soc.20058540741510.1111/j.1095-8312.2005.00503.x · doi ↗
- 2Will K.W. Mishler B.D. Wheeler Q.D. The perils of DNA barcoding and the need for integrative taxonomy Syst. Biol.20055484485110.1080/1063515050035487816243769 · doi ↗ · pubmed ↗
- 3Schlick-Steiner B.C. Steiner F.M. Seifert B. Stauffer C. Christian E. Crozier R.H. Integrative taxonomy: A multisource approach to exploring biodiversity Annu. Rev. Entomol.20105542143810.1146/annurev-ento-112408-08543219737081 · doi ↗ · pubmed ↗
- 4Yeates D.K. Seago A. Nelson L. Cameron S.L. Joseph L. Trueman J.W. Integrative taxonomy, or iterative taxonomy?Syst. Entomol.20113620921710.1111/j.1365-3113.2010.00558.x · doi ↗
- 5Gibbs J. Integrative taxonomy identifies new (and old) species in the Lasioglossum (Dialictus) tegulare (Robertson) species group (Hymenoptera: Halictidae)Zootaxa 2009203213810.11646/zootaxa.2032.1.1 · doi ↗
- 6Baur H. Kranz-Baltensperger Y. Cruaud A. Rasplus J.Y. Timokhov A.V. Gokhman V.E. Morphometric analysis and taxonomic revision of Anisopteromalus Ruschka (Hymenoptera: Chalcidoidea: Pteromalidae)—An integrative approach Syst. Entomol.20143969170910.1111/syen.1208126074661 PMC 4459240 · doi ↗ · pubmed ↗
- 7Neumeyer R. Baur H. Guex G.D. Praz C. A new species of the paper wasp genus Polistes (Hymenoptera, Vespidae, Polistinae) in Europe revealed by morphometrics and molecular analyses Zookeys 20144006711810.3897/zookeys.400.6611 PMC 402324324843256 · doi ↗ · pubmed ↗
- 8Schwarzfeld M.D. Sperling F.A.H. Species delimitation using morphology, morphometrics, and molecules: Definition of the Ophion scutellaris Thomson species group, with descriptions of six new species (Hymenoptera, Ichneumonidae)Zookeys 20144625911410.3897/zookeys.462.8229 PMC 428443325589855 · doi ↗ · pubmed ↗