Clinical Validation of a Deep Learning-Based 2D Ultrasound Steatosis Algorithm: Cutoff Transferability, Scanner Generalizability, and Comparison with FibroScan
Jennifer Tai, Tse-Hwa Hsu, Cheng-Jen Chen, Ming-Ling Chang, Chihung Lin, Shiu-Feng Huang, Le Lu, Adam P. Harrison, Dar-In Tai

TL;DR
A deep learning algorithm for assessing liver steatosis via 2D ultrasound is validated across different imaging views and scanners, showing better performance than existing methods.
Contribution
The study demonstrates the algorithm's cutoff transferability across imaging views and generalizability to a new ultrasound scanner not used in training.
Findings
The DL algorithm achieved high AUROC scores (0.891–0.936) across different steatosis grades and imaging views.
DL outperformed FibroScan's controlled attenuation parameter in moderate-to-severe steatosis (p < 0.001).
Algorithm performance remained strong on a new scanner (AUROCs 0.838–0.896), confirming scanner generalizability.
Abstract
Background: Liver steatosis assessment by 2D ultrasound is widely used but remains subjective. We previously developed a deep learning (DL) algorithm for objective steatosis quantification. This study aimed to (1) establish histology-based cutoffs, (2) evaluate their transferability across different imaging views, and (3) validate performance on a new scanner not included in training. Methods: We retrospectively analyzed 588 ultrasound studies from 457 histology-proven cases and prospectively collected paired scans using a new scanner (Philips Affiniti 70). Images from right intercostal, left hepatic lobe, and subcostal views were processed with the DL algorithm, and mean values from 3–5 images per view were correlated with histology. Results: Across three views, the DL algorithm achieved AUROCs of 0.891–0.936 across steatosis grades, consistently outperforming FibroScan’s controlled…
Genes, proteins, chemicals, diseases, species, mutations and cell lines named across the full text — each resolved to its canonical identifier and authoritative record.
Click any figure to enlarge with its caption.
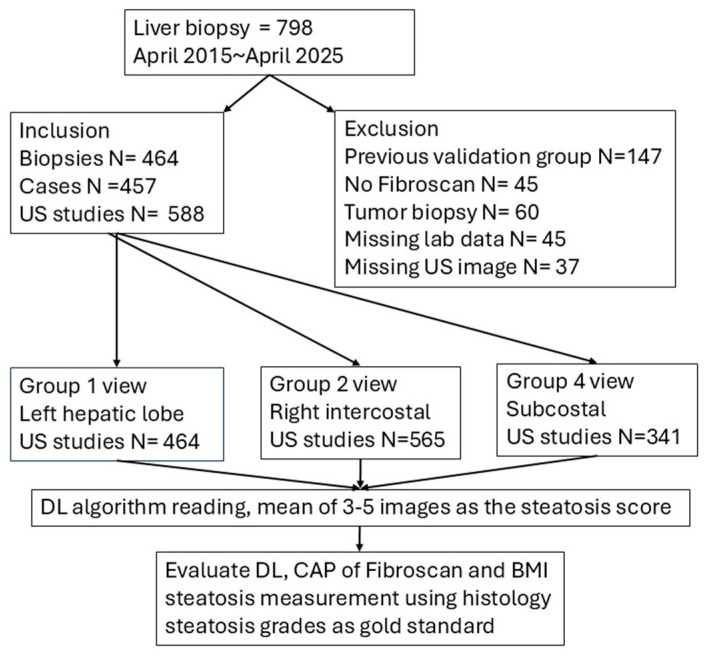 Figure 1
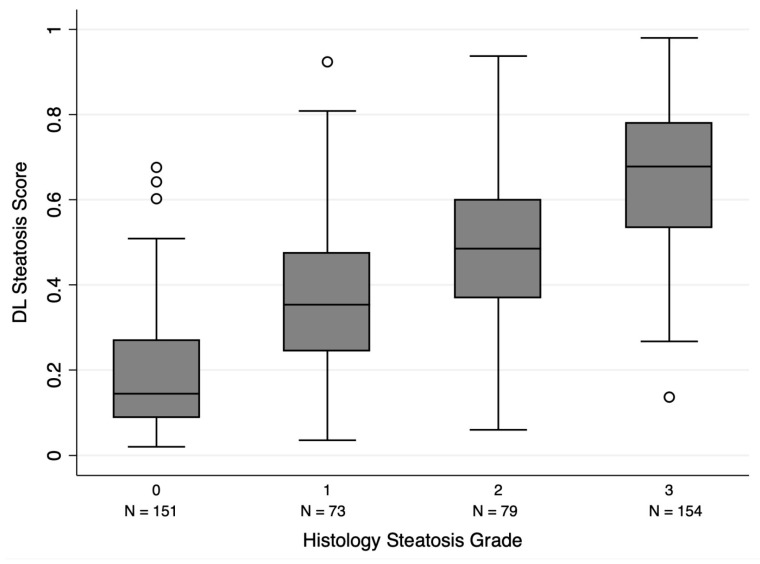 Figure 2
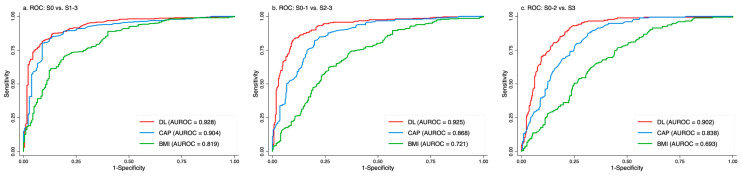 Figure 3
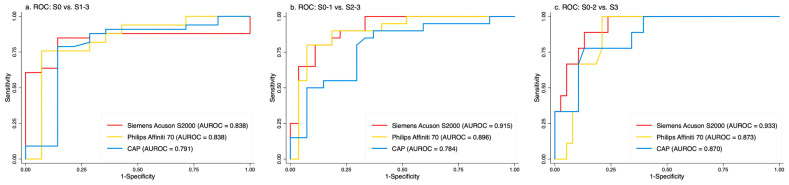 Figure 4
- —Chang Gung Memorial Hospital
Peer Reviews
No public reviews on file for this paper yet. If you reviewed it on a platform where reviews are public (OpenReview, ICLR, NeurIPS, ICML), you can paste yours below so the community can read it here.
Videos
No videos yet. Explain this paper in a talk, walkthrough, or lecture? Add one.
Taxonomy
TopicsLiver Disease Diagnosis and Treatment · Organ Transplantation Techniques and Outcomes · Hepatocellular Carcinoma Treatment and Prognosis
1. Introduction
Metabolic dysfunction-associated steatotic liver disease (MASLD) has become the leading cause of diffuse liver disease, following the global success of hepatitis B vaccination programs and the widespread use of direct-acting antiviral therapies for hepatitis C virus (HCV) [1,2]. Excess hepatic fat accumulation can lead to inflammation, fibrosis, and, in severe cases, hepatocellular carcinoma (HCC) [3,4,5]. MASLD is strongly associated with obesity and diabetes mellitus, with steatosis severity correlating with higher risks of hepatic and extrahepatic complications [2,3]. However, a substantial proportion (7–20%) of individuals with liver steatosis are non-obese, highlighting the need for accurate, non-invasive diagnostic methods for broader patient populations [6,7,8].
The current gold standards for steatosis quantification are liver biopsy and magnetic resonance imaging proton density fat fraction (MRI-PDFF) [9,10]. Biopsy is invasive, subject to sampling bias, and impractical for routine screening, while MRI-PDFF is expensive and not widely accessible. Although 2D ultrasound is widely available and inexpensive, conventional assessment of steatosis remains qualitative and subjective, limiting clinical utility.
Several quantitative ultrasound (QUS) methods [11,12,13,14,15], including FibroScan’s controlled attenuation parameter (CAP) [16,17], have been developed and clinically adopted for steatosis assessment. However, QUS often requires specialized equipment, predefined regions of interest, and standardized scanning protocols, limiting cross-system comparabilityImportantly, these QUS seem unable to differentiate between grade 2 and grade 3 steatosis well [14]. Deep learning (DL) applied to standard 2D ultrasound offers a promising alternative [18,19,20,21,22,23,24], enabling automated and objective analysis of entire ultrasound images without manual ROI selection, and allowing retrospective application to existing datasets for both clinical practice and research. In several recent studies, using deep leaning models with different scanners and views [18,22,24]. the AUC for quantification of steatosis may reach around 0.9 in different stages of steatosis. This approach successfully changes the conventional ultrasound from a subjective diagnosis to quantitative measurement.
In our previous work, we developed a DL algorithm that was trained by more than 200 thousand 2D-US images using ResNet18 as backbone, which accurately quantified steatosis across multiple scanners and views in histology-proven cases [18]. However, the diagnostic cutoff values were not well established. In this study, we increased the number of histology-proven cases and excluded those used in the previous training process as well as US images obtained from old scanners
2. Materials and Methods
This study was approved by the Institutional Review Board (IRB) of the Chang Gung Medical Foundation (CGMH IRB No. 201801283B0 and 202200758B0).
2.1. Patients
FibroScan (Echosens, Paris, France) has been available at Chang Gung Memorial Hospital, Linkou Medical Center, since 2015. As part of the center’s policy, FibroScan is routinely performed for all patients undergoing liver histology studies.
We prospectively enrolled consecutive patients who underwent both liver biopsy and FibroScan between April 2015 and April 2025. The primary indications for liver biopsy included evaluation of abnormal liver function tests, assessment of liver fibrosis, and diagnosis of liver tumors. All patients received comprehensive virological and immunological workups. Laboratory tests—including platelet count, prothrombin time, and transaminase levels—were performed within one week of the liver biopsy.
Patients were excluded if they had been previously included in the validation group, lacked FibroScan measurements, had tumor-only biopsy specimens, incomplete laboratory data, or insufficient 2D ultrasound imaging obtained within three months of the liver biopsy (Figure 1).
2.2. 2D Ultrasound
Since 2011, we have been providing free acoustic radiation force impulse (ARFI) elastography using the Acuson S2000 system (Siemens Healthcare, Erlangen, Germany) for all patients undergoing liver biopsy at our center [25]. A 2D ultrasound examination was also performed using the same system with a convex probe (4C1) during the same imaging session.
All participants were instructed to fast for at least four hours before the ultrasound examination. If 2D ultrasound images from the Siemens system were not available, images from other ultrasound systems obtained within three months of the liver biopsy were retrospectively collected.
2.3. Prospective Study on a New 2D Ultrasound Scanner
Additionally, to evaluate the generalizability of the DL steatosis algorithm across different ultrasound systems, we conducted a prospective study using paired 2D ultrasound examinations. Each patient underwent scanning with both the Siemens Acuson S2000 and the Philips Affiniti 70 (Seattle, WA, USA) system, equipped with a 3.5 MHz transabdominal probe. Notably, the Affiniti 70 was not included in the algorithm’s training dataset. Both 2D ultrasound studies were performed on the same day and within 1 month of liver biopsy.
FibroScan studies were funded through research grants and provided to all patients undergoing liver biopsy. Measurements were performed according to the manufacturer’s specifications and were primarily conducted by a single experienced technician (T-H) within one month of liver biopsy. On rare occasions, other trained personnel performed the measurements in her absence. The CAP was assessed using ten validated measurements, following the same criteria applied for liver stiffness evaluation. The final CAP value was calculated as the median of these individual measurements.
2.4. Image Selection and Classification
For the available 2D ultrasound studies, images were excluded if they were non-hepatic, contained only a limited portion of liver parenchyma, had poor image quality, or displayed unidentified scanning views, as determined by two reviewers (T-H and D-T).
No additional adjustments were made to the selected images. We assume that the examiners sought optimal scanning to aid diagnosis. Using the same images that had already been assessed by the US operators during their clinical examinations, our primary goal was to transition liver steatosis evaluation from a subjective assessment to an objective diagnosis.
The remaining images were then categorized into four scanning views, as defined in our previous study [18]:
- •Left hepatic lobe view (G1);
- •Right intercostal view (G2; right kidney excluded);
- •Liver-kidney contrast view (G3);
- •Subcostal view (G4; right kidney excluded).
Our previous studies demonstrated that the G3 view had lower repeatability and accuracy [18,26], and it was therefore excluded from current analysis. In addition, prior findings suggest that at least 3–5 images per view are necessary for reliable quantification; thus, scanning view groups with fewer than three images were also excluded.
2.5. DL Steatosis Algorithm and Image Reading
The DL steatosis algorithm was developed in our previous study [18]. It was trained and validated on 2899 patients and 228,075 ultrasound images acquired via 13 different scanners from patients undergoing elastography. The algorithm is based on ResNet18 [27] with images processed for de-identification, segmentation, normalized brightness and size, and rotated at random angles between 0 and 10 degrees. After training, it produces a continuous steatosis severity score from 0 to 1. More information about the training process—including the use of ordinal regression loss, tuned hyper-parameters, and image augmentation—can be found in the Supplementary Material of our previous work [18].
In this study, the DL steatosis algorithm was applied to the selected and annotated images. The final DL steatosis score for each patient was calculated as the mean score from 3–5 images per view group. The correlation between different views was more than 0.8 [18,26].
2.6. Histology Grading
To minimize inter-observer variability, liver histology was evaluated by an experienced pathologist (S-H), who was blinded to the present study. Steatosis severity was graded based on the hepatic fat cell fraction, following the classification by Kleiner et al. [28]:
- •Normal: <5%;
- •Mild: ≥5% and <33%;
- •Moderate: ≥33% and <66%;
- •Severe: ≥66%.
Liver fibrosis was staged semi-quantitatively from 0 to 4 using either the Kleiner et al. or METAVIR scoring systems [29]. In cases of discordance between the two classifications, the higher stage was assigned.
2.7. Statistical Analysis
Patient characteristics were summarized as frequencies and percentages for categorical variables, and as mean ± standard deviation (SD) or standard error of the mean (SEM) for continuous variables, as appropriate. Categorical variables were compared using the chi-square test or Fisher’s exact test, while continuous variables were analyzed using one-way ANOVA. The Mann–Whitney U tests were performed to compare DL steatosis scores between two grades, and partial correlation analysis was performed to assess the impact of fibrosis on DL steatosis measurements.
Model diagnostic performance was evaluated via receiver operating characteristic (ROC) curves, with the area under the ROC curve (AUROC) serving as the primary metric. Optimal cutoffs were determined using the Youden index to balance sensitivity and specificity. Correlation analyses were performed to investigate differences in DL steatosis scores among various scanning views. DeLong’s test was applied to compare AUROCs. In a portion of the ultrasound study, two separate scanners were utilized for identical analyses. Furthermore, Obuchowski’s non-parametric ROC method was applied to the G2 views to account for correlated measurements within the same patients.
Statistical analyses were performed using SPSS (v22), with R for non-parametric ROC studies. Additional calculations were performed using Microsoft Excel, and graphs, including ROC curves, were created in Stata/MP 14.0 for Mac. Statistical significance was defined as p < 0.05.
3. Results
3.1. Patient Demographics
A total of 457 patients with 464 liver biopsy studies (including six patients who underwent more than one biopsy) and 588 2D ultrasound studies were included in the final analysis (Figure 1). Of these patients, 55 were seropositive for hepatitis B surface antigen (HBV) and 12 were seropositive for hepatitis C virus (HCV) antibodies. The remaining 390 patients were seronegative for both HBsAg and anti-HCV and were classified as the non-HBV non-HCV (NBNC) group. Patients with HBV or HCV were categorized into the viral hepatitis group.
The demographic and clinical characteristics of the two groups are summarized in Table 1. Compared to the NBNC group, patients with viral hepatitis were more often male (p = 0.046), and had a significantly older age (55.3 ± 11.0 vs. 49.2 ± 14.0 years, p < 0.001), lower platelet counts (p < 0.001), lower total cholesterol levels (p = 0.003), and higher PT-INR (p = 0.006). Regarding associated etiologies, the prevalence of autoimmune hepatitis, primary biliary cholangitis, and acute hepatitis did not differ significantly between the NBNC and viral hepatitis groups. In contrast, the distributions of hepatic steatosis and fibrosis grades were significantly different between the groups (both p < 0.001). Severe steatosis (S3) was more prevalent in the NBNC group (36.9% vs. 14.9%), while advanced fibrosis (F4) was more common in the viral hepatitis group (26.9% vs. 6.9%).
3.2. Ultrasound Scanner Models
Six different ultrasound scanner models were used in this study (Table 2). The primary scanner was the Siemens Acuson S2000, which accounted for 439 studies (74.7%). This predominance was primarily due to the provision of free elastography for patients undergoing liver biopsy, with the Siemens Acuson S2000 being used for both elastography and 2D ultrasound in the same examination room. This setup facilitated the convenient completion of both studies during a single visit.
Among the six scanners, the Philips Affiniti 70 was the most recently introduced and was not included in the training dataset. Its performance was compared to that of the Siemens Acuson S2000, using examinations performed on the same day.
3.3. Diagnostic Performance Among Different Modalities
The distribution of DL steatosis scores across different histological steatosis grades is shown in Figure 2. Significant differences in DL scores were observed between each pair of adjacent grades (p < 0.001, Mann–Whitney U test).
Figure 3 and Table 3 present the ROC curves for DL steatosis scores, FibroScan CAP, and BMI in detecting steatosis grades using the G2 view. DL consistently achieved the highest AUROCs (0.904–0.929), followed by CAP (0.840–0.905), while BMI showed the lowest performance (0.692–0.817) across all thresholds. The ROC curves were measured using parametric and non-parametric analysis. There is no significant difference between two methods. Non-parametric ROC curves of G2 view were presented in Figure 3.
AUROCs of the DL steatosis score and CAP were compared using DeLong’s test. The p-values were 0.131 for grade 1 (S0 vs. S1–S3), <0.001 for grade 2 (S0–S1 vs. S2–S3), and <0.001 for grade 3 (S0–S2 vs. S3), indicating that the DL algorithm significantly outperformed CAP in detecting moderate-to-severe and severe steatosis.
Similar findings were observed in the G1 and G4 views (Table 3 and Supplementary Figure AUROCs in G1 view show similar or even better than G2 view).
3.4. Effect of Fibrosis on DL Steatosis Scores
Although fibrosis alters the echotexture in 2D ultrasound, DL steatosis scores remained highly correlated with histologic steatosis grade after adjustment for fibrosis (partial correlation r = 0.822, p < 0.001). Conversely, when controlling for steatosis grade, a negative correlation was observed between DL steatosis scores and fibrosis stage (partial correlation r = –0.281, p < 0.001).
3.5. Cutoff Values for Prediction of Histology Steatosis Grades
The G2 view is frequently used in studies to quantify liver steatosis and is often selected because it typically provides larger sample sizes suitable for developing diagnostic cutoff values. Using the G2 view, optimal DL algorithm cutoff values for histologic steatosis grades were determined by the Youden index from ROC analyses (Table 4):
•Grade 3: ≥ 0.55;•Grade 2: ≥ 0.44;•Grade 1: ≥ 0.26.
These G2-derived cutoffs were subsequently applied to the G1 and G4 views for comparison. Despite differences in imaging orientation, DL performance remained robust, with sensitivity, specificity, and accuracy summarized in Table 4. The DL algorithm achieved accuracies ranging from 0.792 to 0.875 across different steatosis grades and ultrasound views, supporting the transferability of cutoff values beyond the derivation view (G2).
CAP cutoff values were similarly determined as:
- •Grade 3: ≥ 288 dB/m;
- •Grade 2: ≥ 274 dB/m;
- •Grade 1: ≥ 251 dB/m.
Across all steatosis grades, the DL steatosis score consistently demonstrated superior diagnostic performance to CAP. The difference was most evident in grade 3, where DL achieved a higher accuracy (0.825 vs. 0.750), primarily due to higher sensitivity (0.825 vs. 0.750).
The Cross Confusion Matrix: DL vs. CAP predictions by histological grades in G2 view are shown in Supplementary Table S1.
3.6. Evaluation of a New Scanner (Affiniti 70, Philips)
A newly introduced ultrasound scanner, the Philips Affiniti 70, was implemented in our examination room within the past year. Since this device was not included in the DL algorithm’s training dataset, we evaluated whether it could still accurately quantify hepatic steatosis using images acquired from this system.
A total of 47 patients underwent ultrasound examinations using both the Philips Affiniti 70 and Siemens Acuson S2000 scanners, in addition to FibroScan and liver biopsy. Using histology as the gold standard, ROC curves were generated for the DL steatosis scores from both scanners.
As shown in Figure 4, the DL steatosis scores from the Affiniti 70 yielded AUROCs comparable to those from the Acuson S2000 across all steatosis grade thresholds (e.g., 0.838 vs. 0.838 for grade 1, 0.896 vs. 0.915 for grade 2, and 0.873 vs. 0.933 for grade 3), supporting the algorithm’s generalizability across different ultrasound scanners. Notably, DL scores from both scanners consistently outperformed CAP across all steatosis grades.
Although the ROC curves showed minimal differences, the diagnostic accuracy of the Affiniti 70 was lower than that of the S2000 when using the previously established cutoff system (Supplementary Table S2). This performance can be improved by applying an Affiniti 70-specific cutoff system.
4. Discussion
We evaluated our DL steatosis algorithm using retrospectively collected 2D ultrasound images from 457 histology-proven cases. Based on ROC analyses, we established optimal DL steatosis score cutoffs corresponding to histologic steatosis grades (none, mild, moderate, severe) (Table 3). Our findings suggest that the DL steatosis score provides objective, image-based quantification and demonstrates superior performance compared with CAP in detecting moderate to severe steatosis (Figure 3).
Several machine learning studies have applied 2D ultrasound for diagnosing liver steatosis [23]. However, most focused on binary classification (steatosis present vs. absent), often reporting excellent AUROCs (>0.9). While binary classification is informative, histology-based grading systems [28] provide a more granular assessment of steatosis severity. DL algorithms that align with these clinical grading systems are more relevant for practice. Recent studies have explored 3- or 4-class steatosis grading schemes. Among these, studies using liver histology or MRI-PDFF as the reference standard are summarized in Table 5 [14,18,21,22,24,30]. Most reported AUROCs > 0.9 for grade 1 steatosis, with three studies [14,18,30] also achieving AUROCs > 0.9 for grades 2 or 3.
In the study by Jeon et al. [14], B-mode ultrasound images were combined with tissue attenuation imaging (TAI) and tissue scatter-distribution imaging (TSI) as training inputs. This multimodal approach outperformed models using TAI or TSI alone, achieving the highest AUROCs among the studies listed in Table 5. However, since their model relies on TAI and TSI, it is limited to Samsung ultrasound scanners. In contrast, our previous work demonstrated consistent DL performance across multiple ultrasound vendors [18], highlighting the broader applicability of our approach.
In this study, we further validated our DL algorithm on 457 histology-proven cases and compared it with CAP. For images obtained from the G2 (right intercostal) view, the AUROC of the DL score remained >0.9 across all steatosis grades (Figure 3). DeLong’s test revealed significantly superior performance of the DL steatosis score over CAP for both grade 2 (Figure 3b) and grade 3 (Figure 3c) steatosis, with p-values < 0.001. These results support the clinical utility of the algorithm for accurate, objective assessment of hepatic steatosis using standard B-mode ultrasound.
Our DL algorithm outperforms FibroScan’s CAP in assessing liver steatosis by leveraging diverse and comprehensive imaging features, resulting in a more holistic analysis. CAP primarily measures ultrasound attenuation, which correlates with liver fat content. However, the relationship between attenuation and steatosis severity is nonlinear, often plateauing at moderate to severe steatosis [31,32]. In contrast, 2D ultrasound-based models can analyze multiple imaging features—such as parenchymal brightness, vascular structure visibility, diaphragm clarity, and liver-kidney contrast [33]—allowing for a more accurate correlation with steatosis grading, especially in severe steatosis [14].
Among the studies in Table 5, most of the studies used single scanners, while Vianna et al. used 7 scanners24. The use of multiple scanners during training process may avoid scanner factors and focus on steatosis characteristics. Our DL algorithm was initially trained on images from 13 different ultrasound scanners in a large cohort of patients undergoing elastography [18]. The primary scanners included: Philips IU22 (45.2%), Aloka SSD 5500 (21.9%), Toshiba TUS-A300 (16.1%) and ATL HDI 5000 (14.7%). Only 1% of the training images were from a Siemens Acuson S2000 scanner. In contrast, the Siemens Acuson S2000 was the primary scanner in this study (74.7%, Table 2). Despite these differences, the DL steatosis scores correlated well with histology grades, demonstrating robust generalizability across different ultrasound scanners.
To further assess scalability, the DL algorithm was tested prospectively on the Philips Affiniti 70, a new scanner not included in training. Performance remained high and comparable to that of the Siemens Acuson S2000, reaffirming the model’s generalizability across devices (Figure 4). However, the accuracy of Affinitei 70 is relatively lower than S2000 when preset cutoff values were applied. The accuracy can be improved when a specific cutoff derived from the Affiniti 70 scanners is applied (Supplementary Table S2).
In certain clinical scenarios—such as patients with a post-right lobectomy, or those with large hepatic tumors or cysts—the standard right intercostal (G2) view may not be obtainable, necessitating alternative views for assessment. In previous reports, Vianna et al. [24] and Byra et al. [22] also use views other than RLL. Therefore, we also evaluated the DL algorithm’s performance using:
- •G1 view (left hepatic lobe): AUROCs of 0.915–0.936, significantly outperforming CAP (0.842–0.901; p < 0.001 for grades 2–3; Supplementary Figure S1).
- •G4 view (subcostal): AUROCs of 0.891–0.914, numerically higher than CAP (0.865–0.883), but the differences were not statistically significant (p = 0.133–0.372; Supplementary Figure S2).
The AUROC results in the G1 view were comparable to, or even better than, those in the G2 view. These findings indicate that the DL algorithm can effectively quantify liver steatosis across multiple imaging views, offering greater flexibility in clinical practice.
Unlike QUS and elastography, which require placement of a region-of-interest (ROI) in the right hepatic lobe, our DL model does not require manual ROI selection, facilitating integration into routine ultrasound workflows. Moreover, G2-derived cutoffs transferred well to G1 and G4 views, supporting unified cutoffs across imaging orientations and reducing the need for view-specific adjustment.
5. Study Limitations
This study utilizes a retrospective and single-center design, which may contribute to selection bias. The limited number of cases with F0 fibrosis in this cohort reflects the tertiary referral status of the center, as most biopsies are conducted for chronic liver disease. In these biopsy-selected instances, severe fibrosis or cirrhosis not associated with viral hepatitis is typically linked to conditions such as autoimmune hepatitis, primary biliary cholangitis, or metabolic-associated fatty liver disease.
Fibrosis has the potential to alter echotexture, which may influence DL measurement of steatosis. Analysis indicates that DL-based steatosis scores align closely with histologic grades of steatosis regardless of fibrosis stage (partial correlation r = 0.802, p < 0.001). Additionally, when controlling steatosis grades, there is a negative correlation between DL-based steatosis scores and fibrosis grades (partial correlation r = −0.281, p < 0.001), which may indicate that fibrosis is associated with reduced liver steatosis. These findings suggest that fibrosis does not have a significant influence on the diagnosis of steatosis.
Another limitation is that gain settings were operator-dependent, and we had to assume optimal adjustments were made during image acquisition. Image quality is a key requirement for accurate measurement. For scanners not included in the training set [18], correlation studies—such as those performed on the Philips Affiniti 70 in this study (Figure 4)—could be conducted using paired images from old and new scanners taken on the same date, allowing potential adjustments to the cutoff values (Supplementary Table S2). In addition, external validation from other institutions will be needed.
Lastly, liver fat distribution is often uneven [34]. Our approach—using a mean score derived from 3–5 separate images per view—helps minimize the impact of regional fat variability. However, more targeted studies and larger image series are needed to further optimize this strategy.
6. Conclusions
Despite these limitations, our results indicate that DL algorithms can objectively quantify liver steatosis from 2D ultrasound images. The high AUROC and accuracy across multiple scanners and imaging views, together with the transferability of cutoff values and validation on a newly introduced ultrasound system, support its potential for real-world clinical implementation and research use.
The reference list from the paper itself. Each links out to its DOI / PubMed record.
- 1Younossi Z.M. Golabi P. Paik J.M. Henry A. Van Dongen C. Henry L. The Global Epidemiology of Nonalcoholic Fatty Liver Disease (NAFLD) and Nonalcoholic Steatohepatitis (NASH): A Systematic Review Hepatology 2023771335134710.1097/HEP.000000000000000436626630 PMC 10026948 · doi ↗ · pubmed ↗
- 2Vaz K. Clayton-Chubb D. Majeed A. Lubel J. Simmons D. Kemp W. Roberts S.K. Current Understanding and Future Perspectives on the Impact of Changing NAFLD to MAFLD on Global Epidemiology and Clinical Outcomes Hepatol. Int.2023171082109710.1007/s 12072-023-10568-z 37556065 PMC 10522780 · doi ↗ · pubmed ↗
- 3Steinman J.B. Salomao M.A. Pajvani U.B. Zonation in NASH—A Key Paradigm for Understanding Pathophysiology and Clinical Outcomes Liver Int.2021412534254610.1111/liv.1502534328687 · doi ↗ · pubmed ↗
- 4Ramadori P. Kam S. Heikenwalder M. T Cells: Friends and Foes in NASH Pathogenesis and Hepatocarcinogenesis Hepatology 2022751038104910.1002/hep.3233635023202 · doi ↗ · pubmed ↗
- 5Cannito S. Dianzani U. Parola M. Albano E. Sutti S. Inflammatory Processes Involved in NASH-Related Hepatocellular Carcinoma Biosci. Rep.202343 BSR 2022127110.1042/BSR 2022127136691794 PMC 9874450 · doi ↗ · pubmed ↗
- 6Lu F.-B. Zheng K.I. Rios R.S. Targher G. Byrne C.D. Zheng M.-H. Global Epidemiology of Lean Non-Alcoholic Fatty Liver Disease: A Systematic Review and Meta-Analysis J. Gastroenterol. Hepatol.2020352041205010.1111/jgh.1515632573017 · doi ↗ · pubmed ↗
- 7Long M.T. Noureddin M. Lim J.K. AGA Clinical Practice Update: Diagnosis and Management of Nonalcoholic Fatty Liver Disease in Lean Individuals: Expert Review Gastroenterology 2022163764774.e 110.1053/j.gastro.2022.06.02335842345 PMC 9398982 · doi ↗ · pubmed ↗
- 8Ha J. Yim S.Y. Karagozian R. Mortality and Liver-Related Events in Lean Versus Non-Lean Nonalcoholic Fatty Liver Disease: A Systematic Review and Meta-Analysis Clin. Gastroenterol. Hepatol.20232124962507.e 510.1016/j.cgh.2022.11.01936442727 · doi ↗ · pubmed ↗