Variational Deep Alliance: A Generative Auto-Encoding Approach to Longitudinal Data Analysis
Shan Feng, Wenxian Xie, Yufeng Nie

TL;DR
This paper introduces VaDA, a deep learning method for analyzing longitudinal data that can predict outcomes, cluster subjects, and learn representations simultaneously.
Contribution
VaDA is a novel generative model that unifies outcome prediction, clustering, and representation learning in longitudinal data analysis.
Findings
VaDA demonstrates high robustness and generalization across synthetic scenarios.
The model successfully detects meaningful clusters and generates high-quality face images using the CelebFaces Attributes dataset.
Abstract
Rapid advancements in the field of deep learning have had a profound impact on a wide range of scientific studies. This paper incorporates the power of deep neural networks to learn complex relationships in longitudinal data. The novel generative approach, Variational Deep Alliance (VaDA), is established, where an “alliance” is formed across repeated measurements via the strength of Variational Auto-Encoder. VaDA models the generating process of longitudinal data with a unified and well-structured latent space, allowing outcomes prediction, subjects clustering and representation learning simultaneously. The integrated model can be inferred efficiently within a stochastic Auto-Encoding Variational Bayes framework, which is scalable to large datasets and can accommodate variables of mixed type. Quantitative comparisons to those baseline methods are considered. VaDA shows high robustness…
Click any figure to enlarge with its caption.
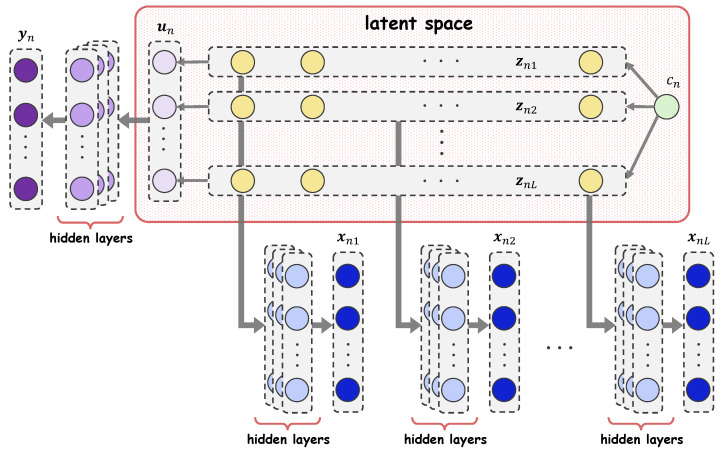 Figure 1
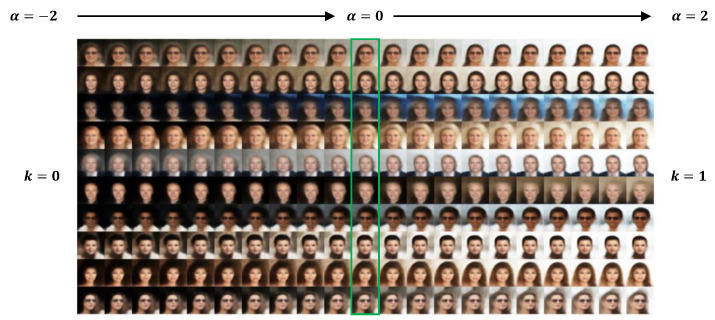 Figure 2
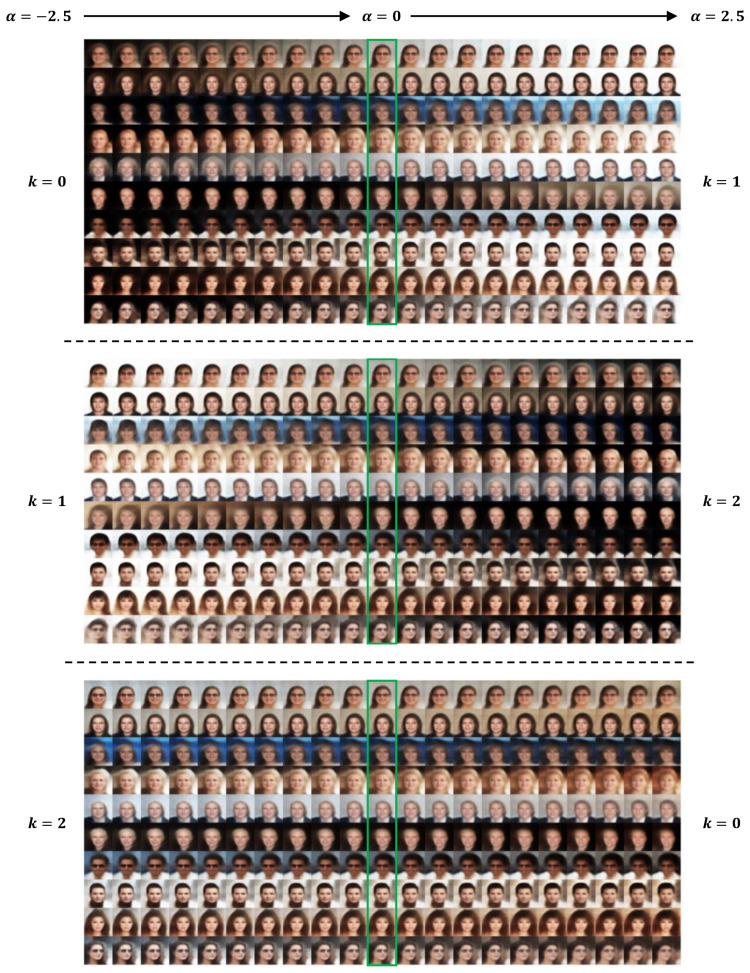 Figure 3
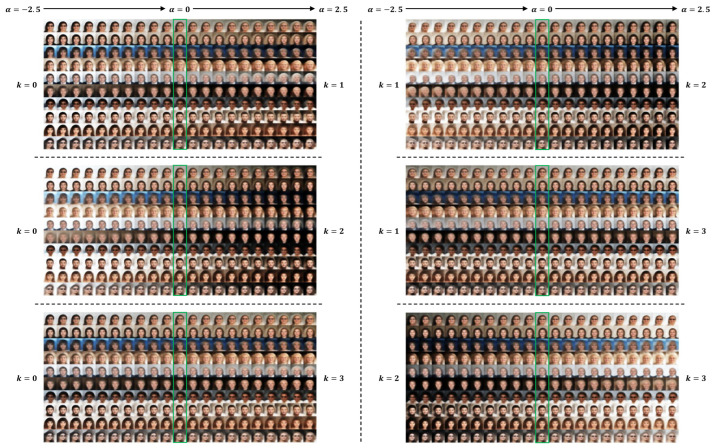 Figure 4
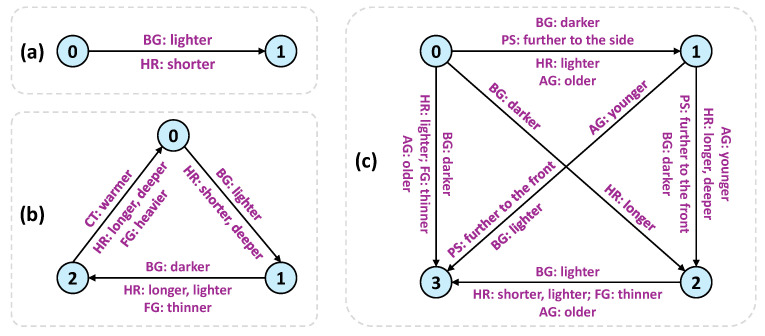 Figure 5
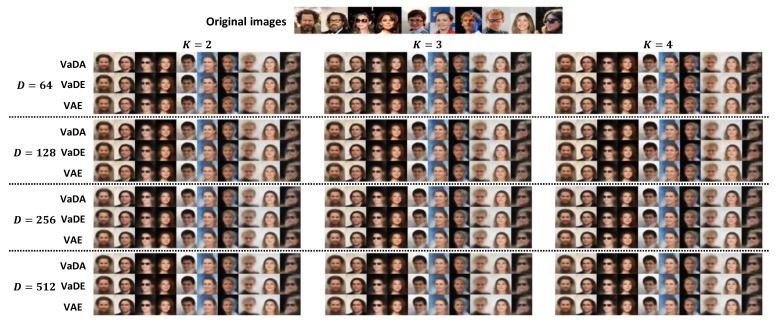 Figure 6
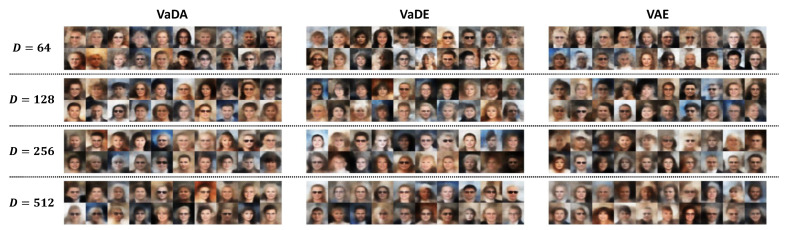 Figure 7
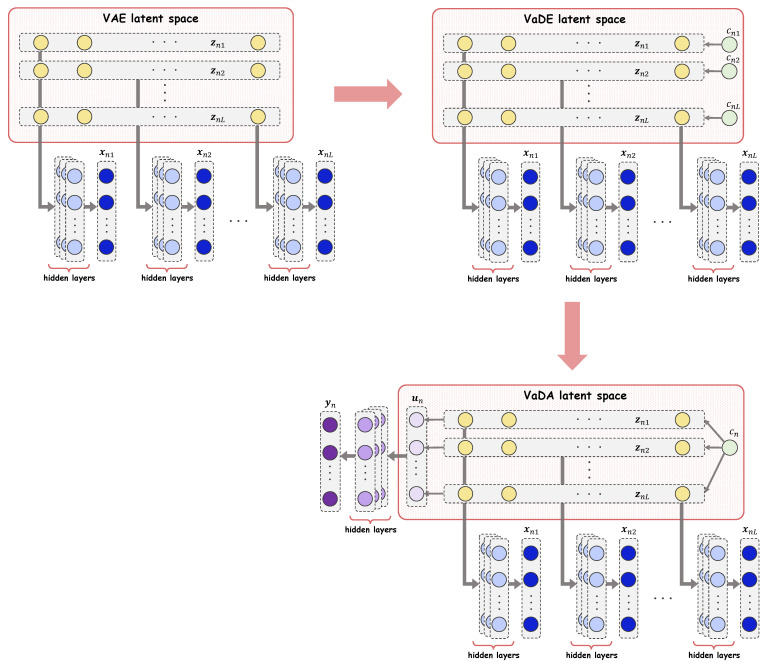 Figure 8
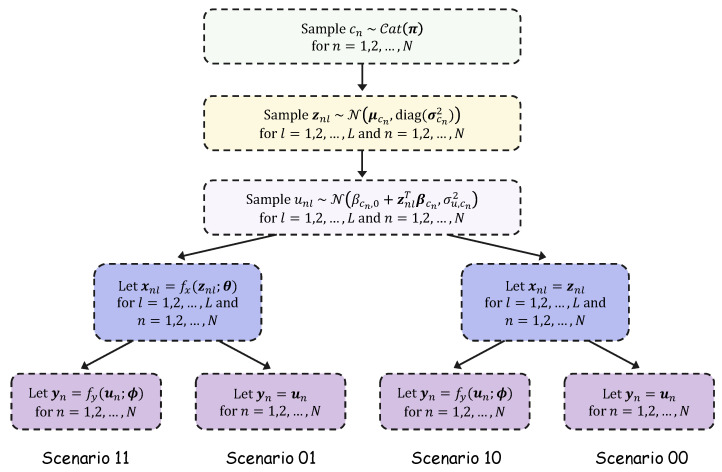 Figure 9
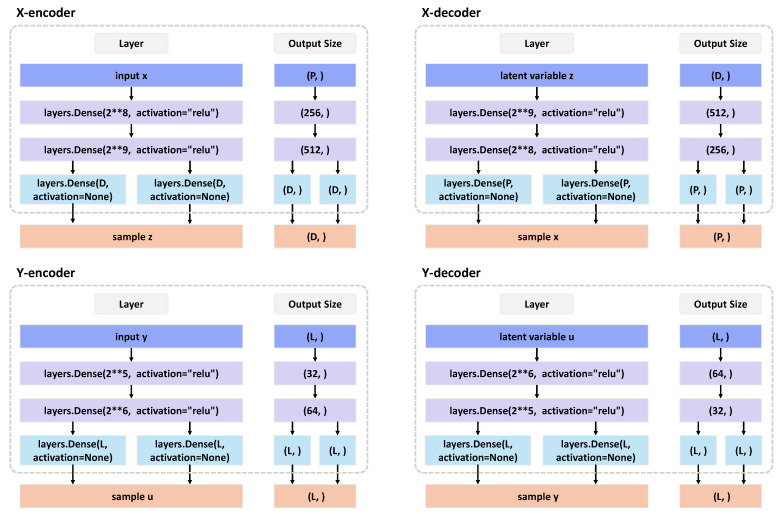 Figure 10
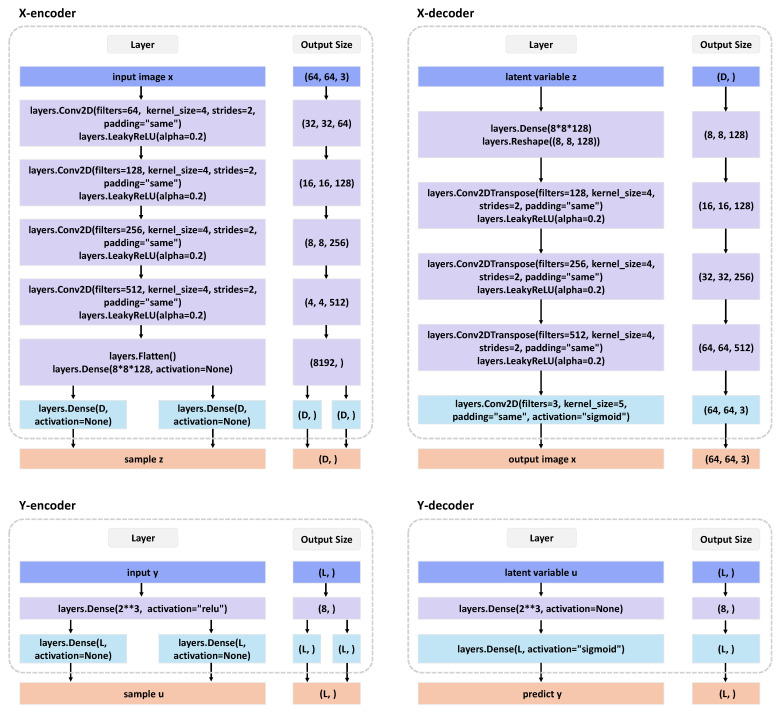 Figure 11
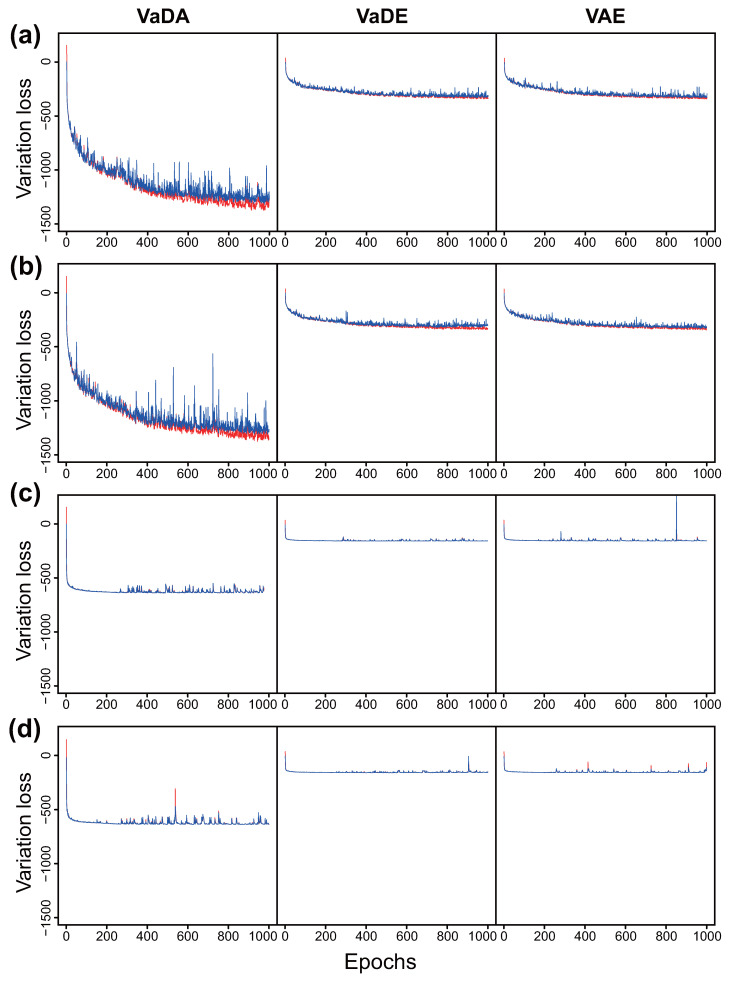 Figure 12
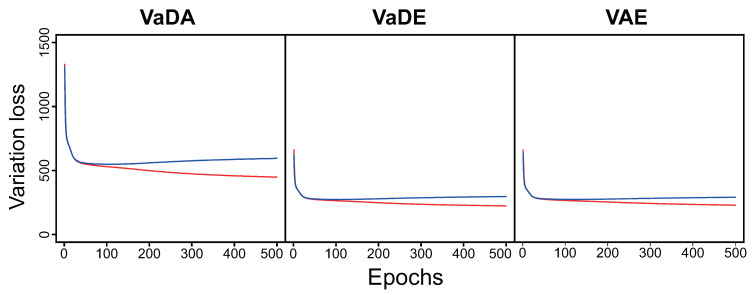 Figure 13
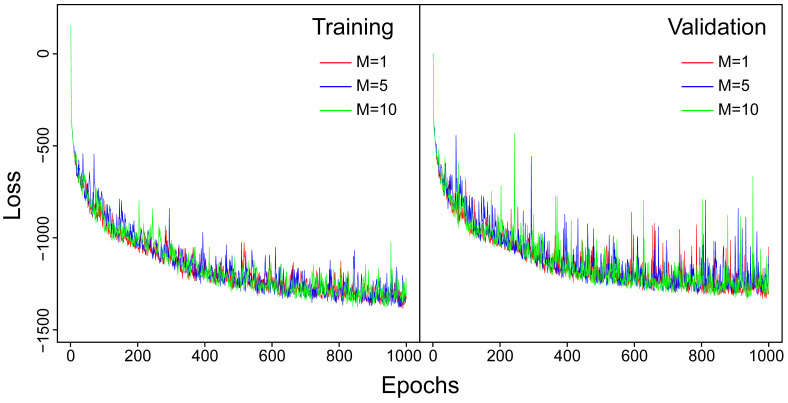 Figure 14
- —National Key R&D Program of China
- —National Natural Science Foundation of China
Peer Reviews
No public reviews on file for this paper yet. If you reviewed it on a platform where reviews are public (OpenReview, ICLR, NeurIPS, ICML), you can paste yours below so the community can read it here.
Videos
No videos yet. Explain this paper in a talk, walkthrough, or lecture? Add one.
Taxonomy
TopicsFace recognition and analysis · Generative Adversarial Networks and Image Synthesis · Emotion and Mood Recognition
1. Introduction
Longitudinal datasets naturally arise in a wide variety of fields and applications, such as social science, biomedicine and agriculture. They contain repeated measurements over multiple time points or spaces, allowing researchers to observe and investigate the temporal and spatial evolution about behaviors and relationships. Different to conventional cross-sectional data, where the sample points are collected independently, the correlated measurements from a subject make longitudinal data analysis a challenging problem. Marginal model [1] focusing on the population-averaged effects is a classical approach for longitudinal data analysis, where consistency inference results can be obtained by solving Generalized Estimating Equations (GEEs) with “working” correlation assumptions [2].
In recent years, rapid advancements in the field of deep learning have had a profound impact in a wide range of scientific studies. The representation learning techniques enable transforming high-dimensional data into their meaningful low-dimensional representations, facilitating a wide variety of downstream tasks hindered by the sheer size and complexity of the original datasets [3]. The Variational Auto-Encoder (VAE) introduced by Kingma and Welling [4] has been extensively used for probabilistic representation learning. It investigates the underlying deep generative model within an efficient stochastic Auto-Encoding Variational Bayes (AEVB) framework.
In this paper, we develop the Variational Deep Alliance (VaDA), a full deep generative model for longitudinal data analysis, where the data of covariates and responses are generated hierarchically from a unified and well-structured latent space. An important observation about the classical marginal model is that it cannot handle complex non-linear effects of covariates and is often hindered by the high-dimensional feature spaces that are intrinsically sparse [5]. In addition, the GEE approach with “working” correlation assumptions mainly models simple covariance structures of measurements, the misspecification of which can damage the estimation efficiency of marginal effects and further influence the prediction accuracy [1]. These are where we can incorporate the power of deep neural networks to learn complex relationships. Specifically, VaDA forms a deep “alliance” across repeated measurements via the strength of VAE, breaking out of the “working” assumptions from the GEEs based marginal modeling approach. From an overall perspective, the auto-encoding in VaDA proceeds in two directions, i.e., cross-sectionally (with X-encoder and X-decoder) and longitudinally (with Y-encoder and Y-decoder), to learn structured latent embeddings and make accurate predictions by probabilistic decoding.
In addition, the subjects in a longitudinal study can originate from subgroups characterized by distinguishable clusters in the latent space. Modeling such heterogeneity is significant in various situations, such as customer segmentation, precision medicine, etc. In VaDA, clustering of subjects is realized by forging it with a mixture model skeleton. The integrated model can be inferred efficiently within a stochastic AEVB framework, which is scalable to large datasets and can accommodate covariates and responses of mixed type. We use synthetic datasets to demonstrate the robustness and generalization capability of VaDA in prediction and clustering. A longitudinal study based on the well-known CelebFaces Attributes (CelebA) dataset [6] in computer vision is carried out, where we show its usefulness in detecting meaningful latent clusters and generating high-quality face images.
2. Related Works
2.1. Classical Approaches for Longitudinal Data Analysis
Besides the marginal model, the conditional model [7,8] and the mixed effects model [9,10] are two alternative classical approaches for longitudinal data analysis. The conditional model assumes directly a dependence structure between components of repeated measurements and models the joint probability as a multiplication of several transition probabilities. In the mixed effects model, the random subject-specific effects are introduced to induce the dependence relationship between measurements. Generally, these classical approaches are not accessible immediately to high-dimensional datasets. Dimension reduction or feature selection procedures should be conducted for data preprocessing. Moreover, these methods mainly tackle the linear effects of covariates. In [11,12], feature transformations were examined to optimize the non-linear regression relationships.
2.2. Deep Learning-Based Longitudinal Data Analysis
Following the efforts of VAE, Sohn et al. [13] proposed the deep conditional VAE approach as a way to incorporate auxiliary information of covariates for representation learning and prediction. However, the standard VAE and the conditional VAE are both designed for i.i.d. observations. In [14], the Gaussian Process Prior VAE (GPPVAE) approach was proposed to account for the association between sample points, which is crucial for correct model specification and optimal inference results in a longitudinal study. GPPVAE replaces the i.i.d. priors over the latent space with a Gaussian process prior, enabling specification of within-subject correlations through covariance functions [15]. It has been adapted for heterogeneous types of covariates [16] and responses [17], and for situations with missing data [18].
While GPPVAE models the temporal and spatial correlations via a covariance function in the latent space, the proposed VaDA approach induces the dependence relationships through a deep generative network. In addition, the covariates introduced in GPPVAE mainly serve as auxiliary information fed into the covariance function and are typically low-dimensional, thus not significantly reducing the inference efficiency. VaDA models responses and covariates in a full generative manner, where the probabilistic auto-encoding networks in two separate but unified directions allow handling response variables and covariates both of high-dimensional. Regarding the data privacy, such an integrated generative model riches uncertainty over the latent space and benefits the out-of-sample data generation essential for data sharing [19]. Moreover, GPPVAE is challenged by handling the cubic computational complexity in the length of repeated measurements, where additional assumptions such as low-rank factorization of the covariance matrix are required to simplify the computation and to reduce the memory burden [14]. In contrast, borrowing the power of deep neural networks, VaDA can handle theoretically arbitrary complex dependence structures in the data.
A separate body of related works for correlated observations structures the latent space of time series by dynamical systems. In [20], the VAE approach was adapted by introducing a deep Kalman filter to the latent representations. Chung et al. [21] and Johnson et al. [22] embedded the VAE into a recurrent neural network for modeling high-dimensional correlated sequences. However, these models are more suitable to time series and incorporating the information of covariates is still an area to be explored.
Recent efforts concatenating the power of deep learning with longitudinal data reassembled the mixed effects model with a feed-forward neural network to account for the complex non-linear effects of covariates [23]. As an extension of the multilayer perceptron regressor, this model is not a full generative model and mainly fitted for prediction purpose.
2.3. Clustering of Longitudinal Data
Clustering of longitudinal data remains a relatively under-explored area. The mixture of marginal models [24] introduces an overall mixture model framework to specify the possible heterogeneity of marginal effects in different clusters. The “working” correlation matrix is applied to model the dependence between measurements in each cluster, resulting in a maximization step in the EM algorithm as solving K (number of clusters) systems of GEEs. The grouped GEE approach [25] is a distance-based clustering algorithm for longitudinal data. It solves the GEEs in separate groups of subjects and optimizes the grouping using the Magalanobis distance with the estimated “working” correlation matrices. The two steps are implemented iteratively until reaching a stable point. The methods mentioned inherit the limitations of traditional models in handling non-linear effects of covariates and are not suitable for high-dimensional settings.
The Variational Deep Embedding (VaDE) approach [26] is a widely acknowledged variant of VAE for clustering analysis. It specifies a Gaussian mixture prior for the latent variables and is aimed at learning good representations that capture the statistical structure of the data. In a recent study about survival data clustering [27], the Variational Deep Survival Clustering (VaDeSC) approach related the latent representation of feature data from a VaDE encoder with the survival outcome by cluster-specific survival models to allow simultaneous clustering, representation learning and survival prediction [28]. Nevertheless, these approaches do not consider the relationships between sample points and assume i.i.d. observations. In VaDA, we rich the latent space of VaDE with cluster-specific marginal models to realize simultaneous clustering, representation learning and prediction for longitudinal data.
3. Methods
In this section, we present VaDA—a generative auto-encoding approach to longitudinal data analysis, which is built on the success of VAE, VaDE and VaDeSC.
3.1. Problem Settings
The longitudinal dataset under consideration consists of N targeting subjects, such as stocks, patients and varieties of crop. The experimental design includes observing each subject over L different time points or locations on some outcome of interest and P relevant features, which constitute the observed data for response and covariates. Denote the covariate data of subject as , where is the data at time point or location . The response information of subject n is denoted as . In our study, the P features can be of mixed type, i.e., can be real-valued or discrete for . To ease interpretation, we only consider the univariate outcome, which can be real-valued or discrete. Generalization to the multivariate case can be realized within the proposed framework. We leave formal exploration of this part to future work. For clustering of the longitudinal data, we consider for each subject a latent class label , which is unobserved and takes value in . K is the total number of clusters. The problem then is threefold: (i) to make prediction of the outcome; (ii) to uncover a clustering for the subjects; (iii) to obtain the low-dimensional representations for the feature data.
3.2. Generative Process
We assume that the observed data are independently and identically generated from a random process consisting of the following steps.
Choose a class label .For :
- (a)Choose a latent vector .
- (b)Generate by
- if is real-valued, choose ,
- if is categorical, choose , where the parameters are computed by
- (c)Generate latent quantity . Generate by
- (a)For real-valued outcome, choose with
where and .
- (b)For categorical outcome, choose with
where .
We use to denote the categorical distribution parameterized by , where and . G is the number of categories. denotes the Gaussian distribution with mean and covariance . is the latent representation or encoding of . D is the dimensions of and we have . Denote the data of latent representations as . For , and , where are the mean vector and covariance matrix of in class k. Denote and .
We use and to denote the sets of indexes for real-valued and categorical features, respectively. It has and . Collectively, the parameters to generate are derived from a decoding neural network with input and parameterized by .
The quantities are the intermediate latent states of the correlated response variables, which are mutually independent given the class label and structured by the underlying marginal model with cluster-specific marginal mean functions . We assume that has linear effects on and denote the marginal effects in cluster k as and residual variance as . allows modeling the intercept of the marginal mean function. Denote and . has the practical meaning as “pure outcomes”.
The final observed outcomes are produced through a non-observable mixing process, e.g., the gene–environment interaction in bioscience and the temporal and spatial evolution of behavior. We simulate this process artificially using the decoder which has input and is parameterized by . Modeling this process is essential in VaDA, where the measurements within a subject henceforth enter into a deep “alliance”. The overall generative process assumed by VaDA is depicted in Figure 1.
According to the generative process described above, the complete-data likelihood can be factorized as
which can be further factorized by
Taking the real-valued outcome as an example, the probabilities composing (1) are defined by
3.3. Variational Lower Bound
Based on the complete-data likelihood given in (1), the observed-data log-likelihood of VaDA can be written as
By Jensen’s inequality, it follows
where is the evidence lower bound objective (ELBO) of the log-likelihood , and is the variational auxiliary function to approximate the inaccessible true posterior . In VaDA, it is assumed that the auxiliary is a mean-field distribution and can be factorized as
where
Under some mathematical manipulations, it follows that the lower bound can be written as
where the expectation is taken w.r.t. with factorization (2).
We use neural networks to model and , i.e.,
where and are parameters for the posterior density function of . They are derived from the encoder network with input and parameters . Similarly,
where and are parameters for the posterior distribution of . They are derived from the encoder network with input and parameters .
We do not introduce excessive assumptions for distribution but obtain it by integrating and from the accessible posterior , i.e.,
where
Therefore, is a known function with inputs and parameters .
3.4. Understanding the ELBO of VaDA
The ELBO in (3) can be rearranged as
The first term is the reconstruction term, which encourages VaDA to explain the dataset well. It can be further separated into two parts as
corresponding to the reconstructions for outcomes and feature data, respectively. The second term is the Kullback-Leibler (KL) divergence from the prior of to their auxiliary posterior, which therefore regularizes the latent embedding to lie on a structured manifold as a mixture model. Appendix B illustrates the evolution of model structures and the induced changes of ELBOs between VAE, VaDE and VaDA.
Due to the complexity of the decoding and encoding networks, the expectation for the reconstruction term cannot be computed exactly. As in VAE and VaDE, the Stochastic Gradient Variational Bayes (SGVB) estimator and the reparameterization trick [4] are applied, which gives
and
We compute and as
where is the mth sample from to produce the Monte Carlo (MC) approximation and can be obtained by
and are obtained from the encoding network in (4). Meanwhile,
where is the mth sample from generated by
and are obtained from network in (5). Denote .
Given the MC samples of and , we can also form an approximation for as
for , under which the KL divergence between and can be computed analytically (see Appendix A for detailed derivations), given by
It is noticeable that the overall inference framework conducts decoding and encoding processes in two separate directions. The first is the cross-sectional direction from the latent space to the feature space with encoder and decoder , which is the same as for VAE and VaDE. The other is the longitudinal or allying direction from the latent space to the outcomes with encoder and decoder . To ease interpretation, we term and as X-encoder and X-decoder, and term and as Y-encoder and Y-decoder.
3.5. Clustering and Prediction
In the inference framework of VaDA, clustering of subjects can be realized in two paths. The first is the complete-data case where besides the feature data we have already observed the outcomes . The clustering therefore can be obtained by assigning subject n to cluster
where the probability can be approximated by defined in (6). The second path is when the outcomes have not been observed and are targets to be predicted. The clustering of subject n is given by
where
Prediction of from the observed data can be obtained by the following steps. The first step is to transform the feature data to their latent representations through the learned X-encoder. We have , which is the output of . In the second step, the representations are inserted into the K latent cluster-specific marginal models to obtain the estimated pure outcomes , where . Then, we use the Y-decoder to decode back to the outcomes , which are the outputs of . The final prediction can be obtained by
where we have used the probability mass function not as are unobserved.
4. Synthetic Study
In this section, we assess the proposed method for longitudinal data analysis through different simulated data scenarios. The objective is to evaluate the quality of clustering and prediction performance obtained coherently using VaDA. The baseline methods include VaDE+MM, VAE+GMM+MM and GMM+MM. VaDE+MM for longitudinal data analysis fits cluster-specific marginal models (MM) based on the representations of feature data and clustering derived simultaneously from VaDE. In VAE+GMM+MM, the clustering is realized by fitting a Gaussian Mixture Model (GMM) based on the obtained representations from VAE. Then, the cluster-specific marginal models are fitted for longitudinal prediction. GMM+MM applies the GMM for clustering and fits the cluster-specific marginal models based on the original dataset.
When fitting marginal models by the GEE approach, three types of “working” correlation assumption were considered, i.e., independence (MM0), ar1 (MM1) and exchangeable (MM2), with increased complexity on the allowed correlation structures [2]. Note that the assumptions MM1 and MM2 are equivalent when the length of measurements . Another problem is that the clustering results either from VaDE or GMM may differ within subject. To obtain a valid clustering for longitudinal data, we made subtle modifications in the algorithms of VaDE and GMM, where the clustering results for each subject were merged across measurements by summarizing the probability of belonging in each cluster and assigning the subject to cluster having the highest total probability. Due to the frequently appearing “rank deficiency” problem in the marginal models [29], we used the Principal Component Analysis (PCA) [30,31] to project further the feature embeddings in VaDE+MM and VAE+GMM+MM and the original feature data in GMM+MM to orthogonal principal components before fitting the cluster-specific marginal models to ensure smooth implementation of these baselines. The detailed instructions are presented in Appendix G.
Four synthetic scenarios were considered. The generated feature data had dimensions and the length of measurements for a subject was . We used a number of subjects. Therefore, there were totally 10,000 observations. In Scenarios 11 and 01, we considered the data generated from three clusters with ten-dimensional latent embeddings, where the marginal effects were non-linear. Scenario 11 corresponded to the well-specified case where the data were generated using the VaDA decoders in two separate directions. Scenario 01 used only the X-decoder to generate the feature data and the outcome variables for each subject were mutually independent given by the pure outcomes. In Scenarios 10 and 00, we considered the data generated from three clusters with linear cluster-specific marginal effects. Scenario 10 used only the Y-decoder to induce dependence between outcomes and the feature data were generated directly from a mixture model with diagonal component covariance matrices. In Scenario 00, we considered the baseline where the data were generated following a simple linear regression model in each cluster where neither the X-decoder nor the Y-decoder was applied. See Appendix C for detailed generating processes and parameter configurations in the four scenarios. Here, we consider the real-valued outcome. The categorical case is examined in the following section with the CelebA dataset. In each scenario, 30 random datasets were generated independently to make reliable assessment on the methods.
The deep learning methods VaDA, VaDE and VAE were implemented under the backbone of TensorFlow [32] and trained with the Adam method for optimization [33] at the default learning rate of . Due to the difference between the inference frameworks, the batch size for VaDA was set as 128, and for VaDE and VAE it was set as . For all the three models, the number of training epochs was set as 500, which had been decided approximately by cross-validation (Appendix E). To make a fair comparison, the decoder and encoder network architectures in VaDE and VAE were set the same as the X-decoder and X-encoder in VaDA, respectively. See Appendix D for specific network configurations. We used MC sample for the SGVB estimator as its usual settings. Further explorations on this hyperparameter are provided in Appendix F. And opposed to the practice in many deep unsupervised learning methods, we did not pretrain the networks. But a re-scaling of the response and covariate variables to zero-mean and unit-variance was conducted before training the models. The training/testing ratio of the data was set as . As the latent dimensions D and the number of clusters K were unknown a priori, we varied the settings of and when fitting each model, which were reasonable quantities considered in practice.
Comparison between methods was based on the metrics of mean square error (MSE) and adjusted Rand index (ARI) [27]. The metric MSE was used to assess the accuracy of prediction, while ARI was computed to evaluate the quality of clustering. As we know the data generating process, the ground-truth class labels can be used post hoc to unambiguously assess the clustering performance. ARI allows evaluation between two data classifications with different number of classes and is not affected by the label switching problem [34].
Table 1 compares the results of MSE on the testing datasets when setting in the four scenarios. The fitting results on the training datasets are presented in the Supplementary Materials (Section S1) as a reference. As can be seen, VaDA significantly outperforms the other methods exhibiting high generalization performance across the four scenarios. It is noticeable that VaDA has a remarkably higher performance in Scenarios 11 and 10 (having within-subject correlations), which implies the importance of correctly modeling the within-subject correlations. VaDA can simulate more sophisticated dependence relationships compared with the marginal model with commonly used “working” correlation structures. Additionally, a decreasing on the MSE can be observed in Scenarios 11 and 01 (with non-linear marginal effects) as the dimensions D of latent representation increases. While small D value could cause a loss of information, larger D allows capturing more latent features that improve the prediction accuracy. In our experiments on VaDA, increasing the latent dimensions D has not resulted in an over-fitting problem, which however becomes severe when using the methods VaDE+MM and VAE+GMM+MM in Scenarios 10 and 00 (with linear marginal effects). In Scenarios 01 and 00 (no within-subject correlation), VaDA performs slightly inferior to the baseline method GMM+MM. This bias could be a result of overly modeling the within-subject correlations which however do not exist.
Table 2 compares the results of MSE on the testing datasets when setting in the four scenarios. We consider the settings while the true number of latent clusters is 3. By an overall inspection, it can be found that the prediction results are not very sensitive to the specification of K. VaDA shows stable performance with varied K values across the four scenarios and significantly outperforms the other methods in Scenarios 11 and 10 where the within-subject correlations exist. In addition, the baseline method GMM+MM can achieve a good prediction accuracy in Scenarios 01 and 00 (no within-subject correlation). However, its performance degrades heavily in Scenarios 11 and 10 when dependence relationships between outcomes are present. Overall, modeling of the within-subject correlations has a more significant impact on the prediction results in our experiments. The unexpected good performance of GMM+MM in Scenario 01 with non-linear marginal effects could be a result of adequate sample size and no severe rank-deficiency problem in the design matrix transformed by PCA.
The clustering results on the testing datasets assessed by the ARI value are provided in Table 3 and Table 4. The values of ARI closer to one indicate higher degree of matching between two classifications. There are totally five different clustering results under comparison provided by VaDA-YX, VaDA-X, VaDE, VAE+GMM and GMM, respectively. We denote clustering rule (7) of VaDA under complete data as VaDA-YX, and rule (8) with unobserved outcomes as VaDA-X. In Table 3, we fix on and test the clustering performance with varied latent dimensions D. As can be seen, VaDA-YX and VaDA-X show great robustness in retrieving the ground-truth clusters in all the four scenarios. Even with insufficient latent dimensions D, the methods can provide clustering results matching well with the original grouping of the subjects. It is noticeable that there is little difference between the clustering results of VaDA-YX and VaDA-X, which is in line with expectation. In principle, the clustering rules VaDA-YX and VaDA-X differ by an integral with respect to the predictive distribution . If peaks at the true value of , the two clustering rules will probabilistically give the same results. The architecture of VaDA can incorporate the diversity of different data generating mechanisms in the four synthetic scenarios and has obtained high prediction accuracy as shown in Table 1 and Table 2. The combined results imply that the overall AEVB framework of VaDA could provide a good approximation for the true predictive distribution, which gives consistent estimators for the outcomes.
The clustering quality of VaDE deteriorates considerably as the latent dimensions D is reduced in Scenarios 11 and 01 (with non-linear marginal effects). Comparison between the results of VaDA and VaDE highlights the expressiveness provided by jointly modeling the marginal regression and clustering in the latent space. The VaDA approach exploits the interactions between the covariate data and the response data, which could calibrate the clustering bias with inadequate covariate information. The representations learned by VAE improve the clustering from GMM in Scenarios 11 and 01 (with non-linear marginal effects), but degrade the performance in Scenarios 10 and 00 (with linear marginal effects).
In Table 4, the clustering performances with varied K values when fixing on are compared. Again, the approaches VaDA-YX and VaDA-X show better generalization performance compared with the other methods. It is noticeable that there is a dramatic decreasing on the ARI value when K is smaller than the ground-truth. This observation is conformable with the property of ARI as two subjects originally separated in two classes now could have to be inserted into one cluster. Generally, the performances of VAE+GMM and GMM arrive their optima at the ground-truth K value.
Overall, VaDA can achieve superior clustering performance while hardly sacrificing the prediction accuracy. It is robust and shows high generalization performance in those misspecified cases, which provides us with great confidence in applying the VaDA approach for longitudinal data analysis in those real-world settings.
5. Application on CelebA Dataset
In this section, we consider a novel application of the proposed method on the CelebA dataset. CelebA is a large-scale face attribute dataset containing 202,599 face images from 10,177 celebrities. The 40 binary attributes annotations per image provide rich source of variability to establish a comprehensive longitudinal study.
We focus on the recognition task on whether a celebrity wears sunglasses from the face image, which constitutes a supervised learning problem with a binary response variable. To form a longitudinal dataset, two face images for each celebrity were randomly chosen: one was wearing sunglasses and the other was not (the order was shuffled). Therefore, there exists apparent within-subject dependence. It can be expected that correctly modeling the relationship between the outcomes of a subject will enhance the performance of representation learning, clustering and image generating. There were totally 3169 celebrities (1199 female celebrities and 1970 male celebrities) who had both the face images with sunglasses and without sunglasses. We used the images from 1200 male celebrities to balance the gender ratio. Finally, the number of subjects in the longitudinal study was , the length of measurements was and there were totally observations. The feature data were organized by cropping and scaling the corresponding face images to pixels as in [35], which therefore had an input tensor shape .
The methods VaDA, VaDE+MM and VAE+GMM+MM, which can realize prediction, clustering and representation learning, were implemented. We did not consider the baseline method GMM+MM here as it can hardly be implemented with efficiency when the data is high-dimensional. While VaDE and VAE inspect the face images in the CelebA longitudinal dataset as fully independent samples, the VaDA method treats the paired image data. As we considered a binary outcome, the link function in the marginal models for VaDE+MM and VAE+GMM+MM was set as “logit” [29]. We also changed the reconstruction term about in the ELBO of VaDA to the negative logistic loss function (cross-entropy) [36] to match with the type of outcome. As the values for the latent dimensions D and the number of clusters K were unknown a priori, we took experiments on and , which were conventional settings. The training/testing ratio was set as . Again, we used the Adam method for optimization with a learning rate . The batch size for VaDA was set as 128 and for VaDE and VAE it was set as . For all the three methods, the number of training epochs was set as 100. To accelerate the progress of training, we used the off-the-shelf network architectures from the improved VAE model in [35] for the X-decoder and X-encoder, which had been used to process the CelebA dataset and achieved good performance in representation learning. Appendix D provides details for the network architectures. Again, no pretraining was conducted. Image data were scaled into by dividing the maximum pixel value 255.
5.1. Prediction
Table 5 compares the prediction accuracy of different methods on the training/testing dataset, evaluated through the value of classification error rate. VaDA shows a high generalization performance with various settings of D and K. It fits well to the training data while making even better prediction on the testing data. Oppositely, VaDE+MM and VAE+GMM+MM show a sign of over-fitting with large D values. Specifically, the prediction accuracy of VaDE+MM or VAE+GMM+MM is gradually improved on the training data but worsen on the testing data as the assumed latent dimensions D increases. In addition, changing the “working” correlation assumption in the two methods does not save the performance. They even perform better when the independence assumption (MM0) is made. Through the following experiments, we will see that the deteriorated performance could largely come from fitting the cluster-specific marginal models, which are specified and fitted separately from the representation learning stage in VaDE+MM and VAE+GMM+MM.
5.2. Clustering
When evaluating the clustering results of CelebA data, we have no prior known subject label to match with as what we have done in the synthetic experiments. Recently, a study demonstrates that visual concepts such as face pose and gender could be manipulated by simple vector arithmetic in the latent space, giving rise to the definition of concept vector for image editing [37]. This strategy provides us a way to visually investigate properties of different clusters by identifying the concept vector from one cluster to another. Specifically, we encode each observed image to its latent representation through the X-encoder and take averaging over the latent representations within each cluster. Denote the obtained latent vector in cluster k as . Then, the concept vector from cluster to k can be defined by , which indicates a direction in the latent space encoding certain variations in the image data from cluster to k. If we map back to the image space through the X-decoder, an increasing of the value will edit the image following the direction from cluster to k. While clustering results of high quality can provide meaningful concept vectors, good generalization performance of X-encoder and X-decoder is also necessary to ensure a satisfactory manifestation of the editing effects.
In Figure 2, Figure 3 and Figure 4, we provide results of image editing on face images from five subjects as examples. The image editing manifested here is based on the clustering and representation learning results of VaDA. Given the space limitations, we have placed the image editing results based on VaDE and VAE+GMM in the Supplementary Materials (Section S2). To make consistent comparison with the other methods, the clustering rule VaDA-X is applied.
Figure 2 corresponds to the results when the subjects are separated into two clusters. We can see smooth transition between dark and light backgrounds from cluster to . It is also noticeable that little by little the hair becomes shorter while other facial attributes are largely retained.
Figure 3 manifests the image editing results when three clusters are assumed. Again, the dominant variations are from the background and the hair. From cluster to , the background becomes lighter, the hair gets shorter and the hair color is slightly deepened. From cluster to , reversed changes are presented. Nevertheless, the left side of image editing from to shows a warmer color palette than the right side of image editing from to . Interestingly, this subtle difference can be validated by image editing from to , where the overall color tone shifts towards warmer hues. In addition, there also exhibits slight variation on the fringe. While the fringe gets thinner from to , it becomes heavier from to . This therefore corresponds to the little change of fringe from cluster to .
Figure 4 shows the image editing results decoded by the six concept vectors from a four-cluster separation of the subjects. Besides the background changes and the hair length and color transitions, we detect two additional meaningful variation axes: age and face pose. It can be seen clearly that there are transitions on age from cluster to , from to , from to and from to with the appearance getting older. The pattern of transition from cluster to shares similarity with that from to , where the background becomes darker along with the growing age. Nevertheless, difference exists between cluster and . The appearance gets old little by little from to , which completes a circle from to , from to and finally from to with the age getting older and older and then returning young. The similar circle can be figured out from cluster to , from to and finally from to but with a reversed transition on the darkness of background. Additionally, smooth transitions on the face pose can be found from cluster to , from to and from to , where the faces gradually turn from profile to full front. This detection illustrates that the face images from cluster could be characterized as facing sideways. We summarize the transitions between different clusters in Figure 5.
Compared to the proposed method, the clustering performances of VaDE and VAE+GMM are largely unsatisfactory. The VaDE method which performs representation learning and clustering simultaneously gives distinguishable clusters under different settings of the number of clusters. However, it has limited generalization capability as shown in case (Figure S2) and (Figure S3). The approach to cluster produces images that gradually blur. Generally, the latent space learned by VAE is not responsive to the clustering result of GMM (Figures S4–S6). There is nearly imperceptible variation when changing the value.
5.3. Image Reconstruction and Generation
The image reconstruction results are compared between the methods VaDA, VaDE and VAE. We map the testing images to the latent space using the X-encoder and decode them back to the image space using the X-decoder. Ten reconstruction examples are presented in Figure 6. The three methods sharing the same encoder and decoder structures exhibit comparable performance and there is nearly no difference that can be identified given the latent dimensions D and the number of clusters K. While varying the setting of K has little impact on the image reconstruction, increasing the latent dimensions D gradually smooths the images. The overall results demonstrate the effectiveness of the X-encoder and X-decoder established in our experiments, which can capture the main properties of the image data.
Figure 7 shows the face images generated by VaDA, VaDE and VAE with . Random face images were obtained by decoding the latent vectors drawn from the estimated latent space. Overall, compared with VaDA, the methods VaDE and VAE are less advantaged in out-of-sample generalization. Even though the generated images by VaDA are not perfect and tend to be blurry on the hair, they are more realistic on the face color and have compatible and harmonious overall appearance than the images generated by VaDE and VAE. VaDE is more likely to produce weird faces in our experiments and the images generated by VAE tend to be blurrier though the overall spatial face structures are preserved. Nevertheless, the three methods show improved data generating performance as the latent dimensions D is increased. The out-of-sample generalization performance relies heavily on correct modeling of the latent space structures. The outperforming of VaDA is in line with expectation as it has a better-structured latent space allowing within-subject dependence and unifying the latent information from outcome and features.
6. Conclusions
In this paper, we developed a generative auto-encoding approach to longitudinal data analysis. VaDA retains the strengths of VAE to learn well-structured latent space and is an enhanced version of VaDE to accommodate the nature of longitudinal data. Moreover, it goes beyond the GEEs based marginal modeling approach by forging a deep “alliance” across measurements to incorporate more complicated dependence structures. VaDA integrates prediction, clustering and representation learning in a unified AEVB framework, which alleviates the loss of information between different stages and fortifies interaction and coordination across all parts of the model.
Synthetic and real-world data experiments were implemented. The results demonstrated the robustness and effectiveness of the proposed method, which achieved high prediction accuracy and showed excellent ability in recovering the underlying grouping of the data under varied assumptions of data generating mechanism. The VaDA approach well captured the latent structure of CelebA longitudinal data, where we obtained meaningful clustering results of the face images. Moreover, it exhibited high generalization capability. The generated face images have more realistic and harmonious appearance than those from VAE or VaDE.
Nevertheless, there is still room further improvements. In the experiments, we have used given decoder and encoder network structures. For synthetic data, the networks similar to the ones in the data generating process were adopted. For CelebA data, we used the available convolution neural network structures established in previous studies for face images and a simple dense network to model the relationship between outcomes. A pilot study was conducted to investigate the impact of redundancy in encoder and decoder network architectures (see Section S3 in Supplementary Materials). While the redundancy was found to degrade the performance of VaDA, incorporating “dropout” layers [38] could mitigate this issue, resulting in a calibrated model. These findings highlight the need for a more comprehensive exploration of network structures in order to optimize the performance of VaDA for real-world applications.
Another potential enhancement of the method is to weight the different variational loss terms like the practice in [39], especially to consider the balance between reconstruction loss terms on response and covariates. In addition, a thorough analysis of the identifiability of VaDA, while beyond the scope of this work, remains an important theoretical question for further research. The study in [40] has demonstrated the identifiability properties of deep generative models like VAE and VaDE up to an affine transformation under moderate conditions. Our future work should explore the potentials of extending these results to VaDA to strengthen its theoretical foundation.
In current work, we have not considered the handling of missing data on covariates or response, which frequently arise in longitudinal study. Improper treatment of missingness could introduce bias under certain missing data mechanisms [41]. Nevertheless, the generative modeling framework of VaDA can be extended immediately to the missing data cases, where missing data mechanism can be integrated naturally into the ELBO to derive a systematic treatment. Such enhancement will strengthen the robustness and generalizability of current model.
While the proposed VaDA approach processes high flexibility in handling the high-dimensional longitudinal data, there are still limitations that it is only suitable to datasets with equal-length measurements across subjects (these datasets often appear in well scheduled and organized longitudinal experiments). Nevertheless, the inference framework of VaDA provides a solid foundation for combining the efforts of VAE with alternative classical methods for other types of longitudinal data. A potential is to go beyond the generalized neural network mixed effects model in [23] by extending it to a full generative framework, which is a part of our ongoing work.
The present study introduces a novel longitudinal perspective to the widely recognized CelebA dataset by reorganizing its structure and applying the VaDA method for improved representation learning, clustering and image generation. This perspective could offer a meaningful contribution to the pattern discovery based on CelebA and other benchmark vision datasets. Future work could explore the applicability of the method to longitudinal data with more complex and naturally evolving spatio-temporal dynamics such as those in clinical or behavioral studies. This may also involve extending the proposed framework to handle challenges including missing data and irregular length of measurements as noted in our earlier discussion, therefore further enhancing the VaDA’s practical utility in more real-world longitudinal studies.
The reference list from the paper itself. Each links out to its DOI / PubMed record.
- 1Fahrmeir L. Tutz G. Multivariate Statistical Modelling Based on Generalized Linear Models 2nd ed.Springer Series in Statistics Springer New York, NY, USA 200110.1007/978-1-4757-3454-6 · doi ↗
- 2Liang K.Y. Zeger S.L. Longitudinal data analysis using generalized linear models Biometrika 198673132210.1093/biomet/73.1.13 · doi ↗
- 3Zhu R. Guo D. Qi D. Chu Z. Yu X. Li S. A survey of trustworthy representation learning across domains ACM Trans. Knowl. Discov. Data 20241817310.1145/3657301 · doi ↗
- 4Kingma D.P. Welling M. Auto-encoding variational bayes Proceedings of the 2nd International Conference on Learning Representations Banff, AB, Canada 14–16 April 2014
- 5Hastie T. Tibshirani R. Wainwright M.J. Statistical Learning with Sparsity: The Lasso and Generalizations CRC Press Boca Raton, FL, USA 2015
- 6Liu Z. Luo P. Wang X. Tang X. Deep learning face attributes in the wild Proceedings of the IEEE International Conference on Computer Vision Santiago, Chile 7–13 December 2015
- 7Clogg C.C. Some models for the analysis of association in multiway cross-classifications having ordered categories J. Am. Stat. Assoc.19827780381510.1080/01621459.1982.10477891 · doi ↗
- 8Qu George Y. Williams G.W. Beck G.J. Goormastic M. A generalized model of logistic regression for clustered data Commun. Stat. Theory Methods 1987163447347610.1080/03610928708829585 · doi ↗