Identification of Tumor- and Immunosuppression-Driven Glioblastoma Subtypes Characterized by Clinical Prognosis and Therapeutic Targets
Pei Zhang, Dan Liu, Xiaoyu Liu, Shuai Fan, Yuxin Chen, Tonghui Yu, Lei Dong

TL;DR
This study identifies two glioblastoma subtypes with different survival rates and immune profiles, offering new insights into prognosis and treatment options.
Contribution
The novel pathway-based classification of GBM subtypes provides a new framework for prognosis and targeted therapies.
Findings
Two GBM subtypes (C1 and C2) were identified with distinct survival rates and immune characteristics.
A neural network model accurately predicted subtype classification and prognosis using hub biomarkers.
Potential therapeutic drugs (Methotrexate, Cisplatin, and Cytarabine) were validated for subtype-specific treatment.
Abstract
Glioblastoma multiforme (GBM) is the most aggressive primary brain cancer (with a median survival time of 14.5 months), characterized by heterogeneity. Identifying prognostic molecular subtypes could provide a deeper exposition of GBM biology with potential therapeutic implications. In this study, we classified GBM into two prognostic subtypes, C1-GBM (n = 57; OS: 313 days) and C2-GBM (n = 109; OS: 452 days), using pathway-based signatures derived from RNA-seq data. Unsupervised consensus clustering revealed that only binary classification (cluster number, CN = 2; mean cluster consensus score = 0.84) demonstrated statistically prognostic differences. We characterized C1 and C2 based on oncogenic pathway and immune signatures. Specifically, C1-GBM was categorized as an immune-infiltrated “hot” tumor, with high infiltration of immune cells, particularly macrophages and CD4+ T cells, while…
Genes, proteins, chemicals, diseases, species, mutations and cell lines named across the full text — each resolved to its canonical identifier and authoritative record.
Click any figure to enlarge with its caption.
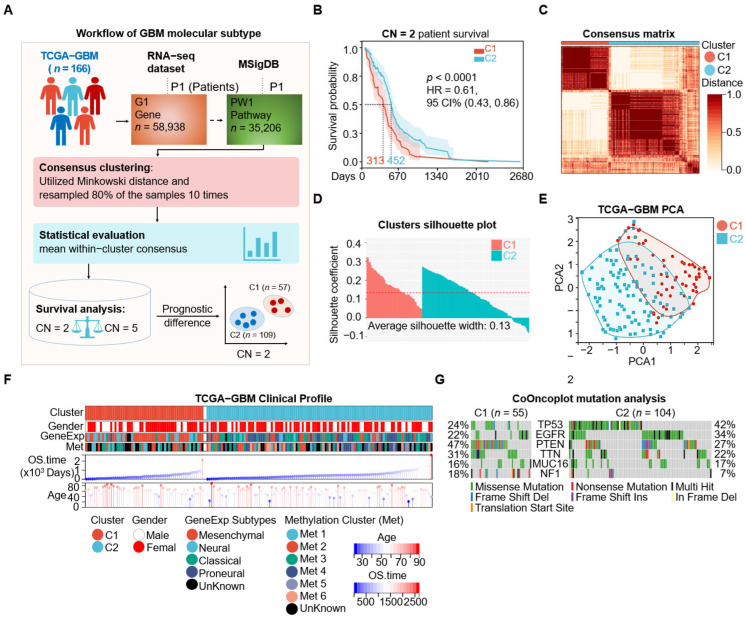 Figure 1
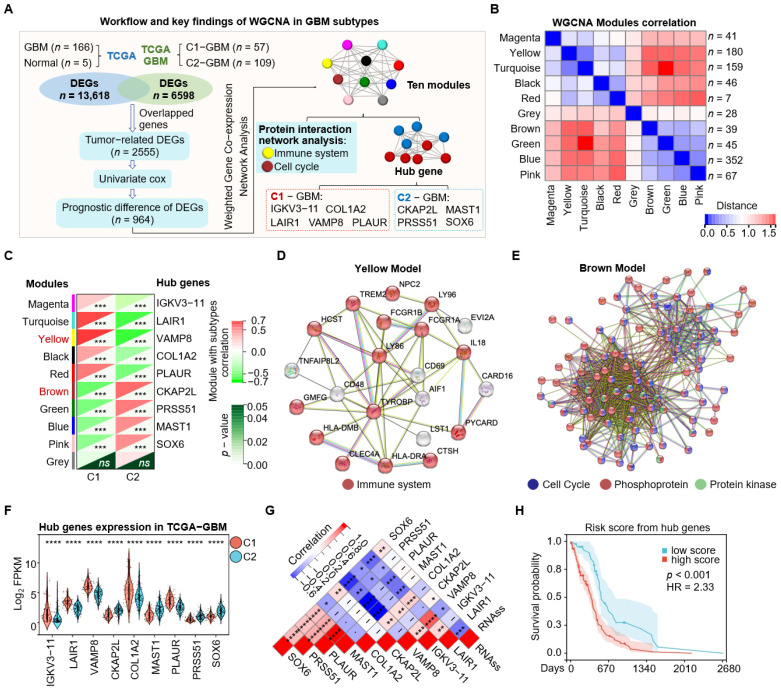 Figure 2
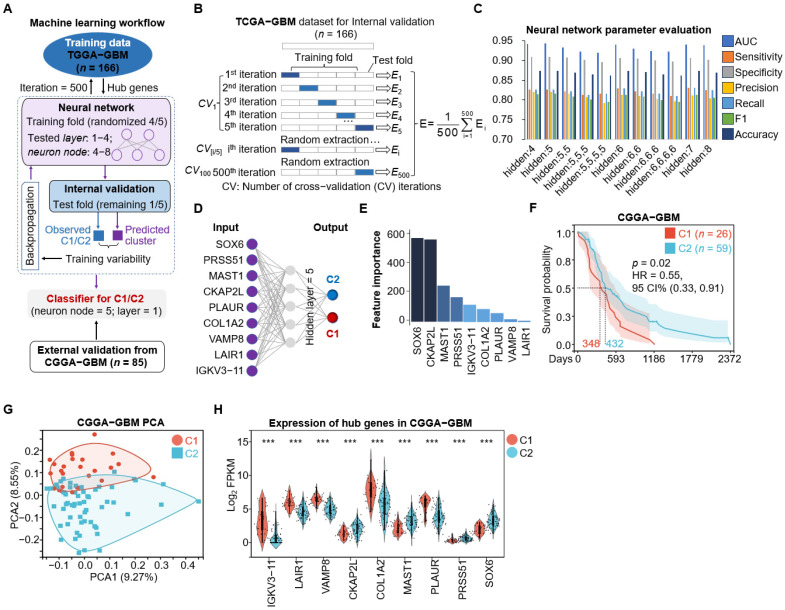 Figure 3
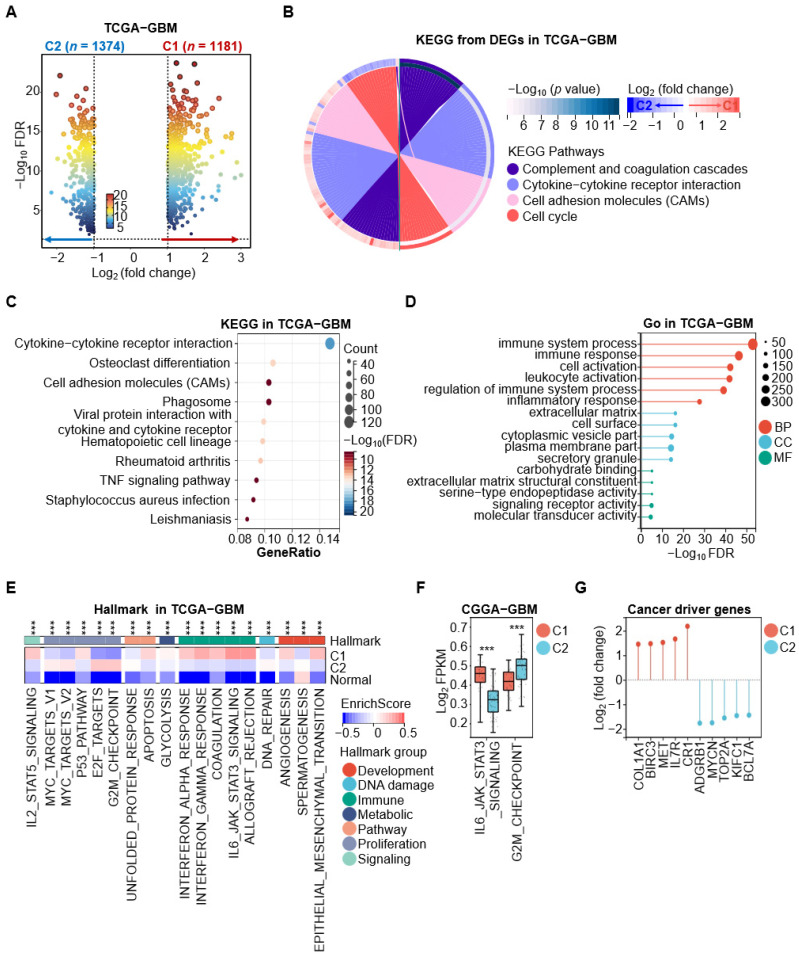 Figure 4
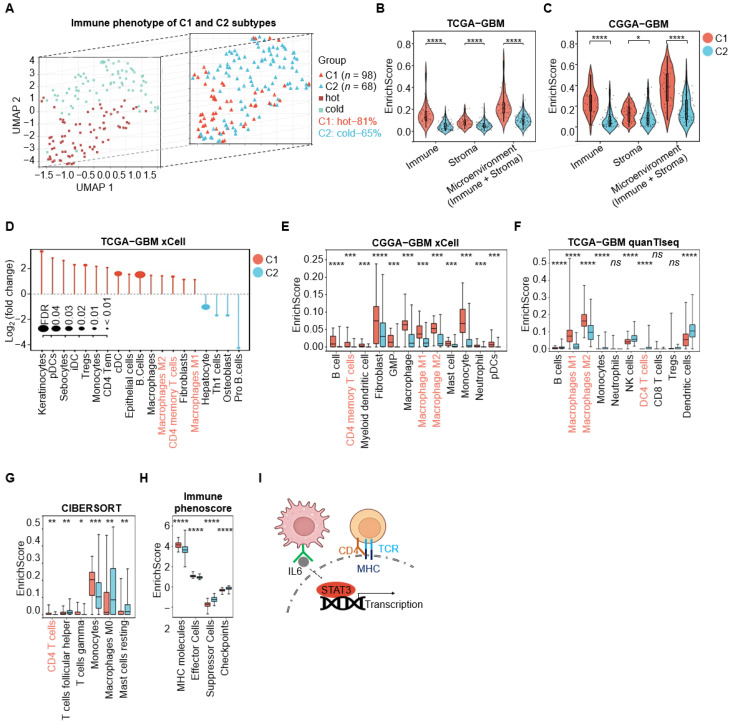 Figure 5
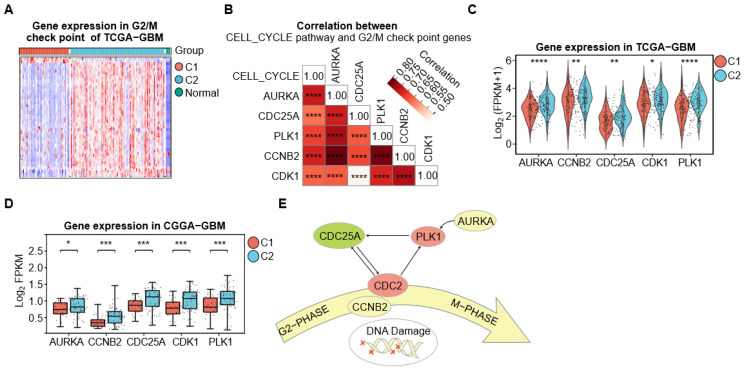 Figure 6
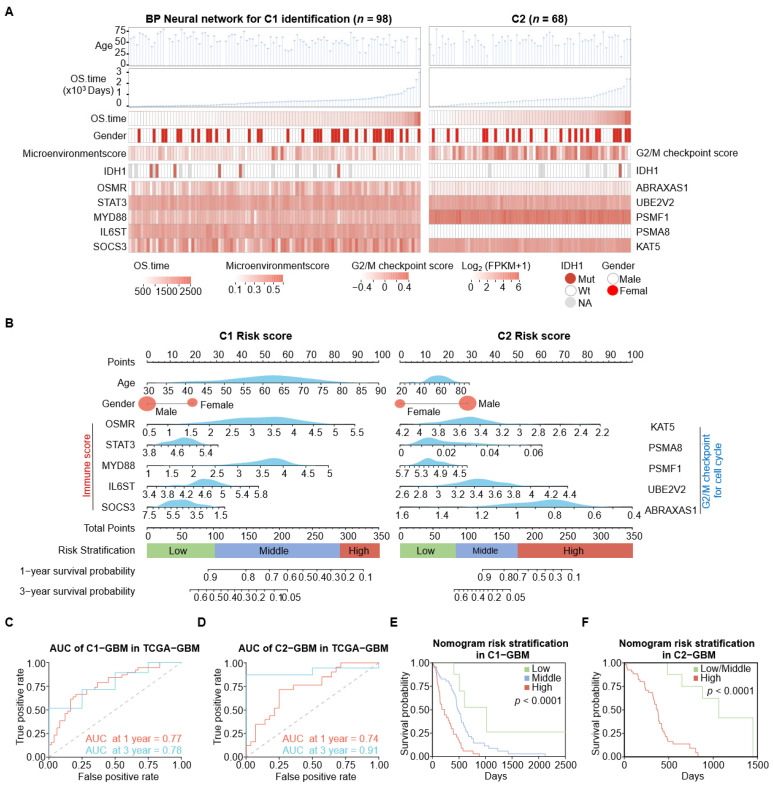 Figure 7
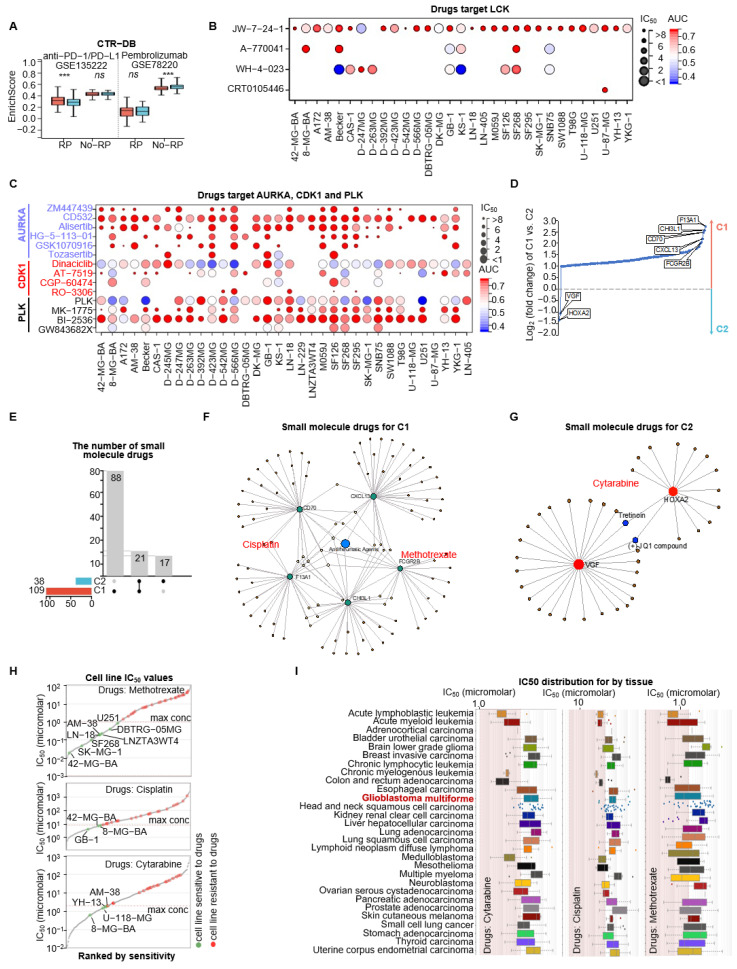 Figure 8
- —National Natural Science Foundation of China
- —Shandong Provincial Natural Science Foundation
- —Fundamental Research Funds for the Central Universities
- —Hebei Natural Science Foundation
Peer Reviews
No public reviews on file for this paper yet. If you reviewed it on a platform where reviews are public (OpenReview, ICLR, NeurIPS, ICML), you can paste yours below so the community can read it here.
Videos
No videos yet. Explain this paper in a talk, walkthrough, or lecture? Add one.
Taxonomy
TopicsFerroptosis and cancer prognosis · Glioma Diagnosis and Treatment · Bioinformatics and Genomic Networks
1. Introduction
Glioblastoma multiforme (GBM) is the most common and aggressive brain tumor. It exhibits severe intra- and inter-tumor heterogeneity, with a median survival time of only 14.5 months [1,2,3]. Multi-omics studies conducted by the Cancer Genome Atlas (TCGA) and the Chinese Glioma Genome Atlas (CGGA) have revealed complex genetic characteristics in GBM, such as co-deletions of chromosomes 1p and 19q, mutations in genes like IDH, PTEN, TP53, TERT, and ATRX, amplifications of EGFR, and disruptions in P53, Rb, and PI3K signaling pathways [4,5,6]. Classifying GBM based on molecular features enhances traditional pathology-driven diagnostics [6,7], enabling the identification of the molecular markers for disease diagnosis and patient stratification. The classification of GBM based on these abnormal molecules has gradually reduced the time from diagnosis to treatment, leading to a significant improvement in accuracy and specificity. However, challenges remain regarding the reliance on independent features and prognostic factors.
Previous molecular subtypes of GBM still have limitations when it comes to improving patient prognosis. The World Health Organization updated its guidelines to reclassify several brain tumor entities, particularly gliomas, considering both morphological and genetic variations and provided the isocitrate dehydrogenase (IDH, an enzyme that catalyzes the conversion of isocitrate to alpha-ketoglutarate in the citric acid cycle in brain tumor) gene mutation subtype [8]. Patients with IDH1 mutations, which occur in about 5% of primary GBM patients cases, have a better prognosis compared to those with IDH1 wildtypes [9]. However, despite this advantage in prognosis, IDH1 mutation in GBM patients is limited. Verhaak et al. proposed four GeneExp subtypes based on gene expression—proneural, neural, classical, and mesenchymal—defined by aberrations of EGFR, NF1, and PDGFRA/IDH1, providing a unified framework for transcriptomic and genomic stratification of GBM [7]. Wang et al. identified the neural subtype originating from non-tumor cells within the tumor microenvironment [10,11]. They also included methylation status to classify GBM into six methylation subtypes (clusters M1 to M6), with cluster M5 identified as the G-CIMP subtype [6]. This classification complements the analysis of gene mutation and transcription, further subdividing the proneural subtype into G-CIMP-positive and -negative groups. DNA methylation status in the MGMT promoter region can predict response to temozolomide treatment [12], but this is applicable only to the non-recurrent classical subtype of GBM. However, GeneExp subtypes and methylation subtypes lack clear prognostic differences and exhibit overlaps among subgroups. Recently, Park J. et al. identified three new GBM subtypes—mitotic (characterized by association with the methylated MGMT gene promoter and sensitive to TMZ treatment), intermediate, and invasive subtypes—through the analysis of four large-scale gene expression profiles [13]. Wang et al. extended the integration of MS-based proteomics to identify GBM subtypes differing in infiltrating macrophages and the distribution of specific immune cell types [14], and Ravi et al. employed spatially resolved multi-omics in glioblastoma samples and identified segregated niches hallmarked by immunological and metabolic stress factors [15], highlighting the need to consider the state of the tumor microenvironment (TME) for optimizing tumor classification.
Pathway-based analysis of transcriptomic cancer data, which captures biological interaction among genes, offers a more powerful and robust approach for molecular classification than traditional gene-based analysis. Pathway-based analysis evaluates a predefined aggregation of genes within functional pathways [16]. This approach utilizes information from multiple loci within a functional signaling pathway, leading to more stable and robust results compared to single gene analyses [17,18]. In the context of GBM, which is highly heterogeneous and complex, identifying distinct prognostic subtypes is essential for improving patient outcomes. Garofano et al. [17] demonstrated the effectiveness of a pathway-based classification method by analyzing single-cell and bulk RNA sequencing data. They found that the mitochondrial subtype reliant on oxidative phosphorylation is associated with better clinical outcomes, whereas the glycolytic/plurimetabolic subtype relies on aerobic glycolysis, amino acid, and lipid metabolism [17]. Our study aims to utilize pathway-based gene expression data to achieve molecular classification of GBM. By focusing on the collective behavior of gene sets within functional pathways, pathway-based classification offers a more robust and biologically meaningful analysis. This method inherently achieves dimension reduction by analyzing gene sets rather than individual genes [19,20], thus addressing the heterogeneity and complexity of GBM more effectively than traditional single-gene approaches.
In this study, we utilized pathway-based gene expression data and performed unsupervised clustering to identify two distinct prognostic GBM subtypes: cluster 1 (C1-GBM), characterized by an enriched immune microenvironment and active PD1 and MHC pathways (immune-infiltrated “hot” tumors), and cluster 2 (C2-GBM), defined by activation of cell cycle and G2/M checkpoint (inherent driving). We developed a neural network classifier to predict the C1 and C2 subtypes and validated it using the external dataset from CGGA-GBM. Subsequently, we constructed a Cox proportional hazards model integrating predictions from the neural network to generate a nomogram for prognostic survival prediction in the TCGA-GBM cohort. Using the Genomics of Drug Sensitivity in Cancer (GDSC) database, we evaluated the sensitivity of GBM cell lines to subtype-specific gene targets. Our findings identified immune and inherent driving GBM subtypes via molecular signatures, enhancing prognostic predictions and informing the selection of targeted therapies for GBM patients.
2. Materials and Methods
2.1. Data Source
Gene expression profiles and clinical information regarding overall survival for the TCGA-GBM (n =166) were downloaded from https://xenabrowser.net/datapages/ (accessed on 14 January 2026) for use as the training set. An independently validated dataset from the Chinese Glioma Genome Atlas (CGGA) project was downloaded from http://www.cgga.org.cn/download.jsp (ID WESeq_325, accessed on 14 January 2026). The drug-related gene expression datasets GSE135222 and GSE78220 from the GEO dataset were downloaded from the Cancer Treatment Response gene signature DataBase (CTR-DB, http://ctrdb.cloudna.cn/home, accessed on 14 January 2026) for drug response analysis.
2.2. The Molecular Signatures Database (MSigDB) and Gene Set Variation Analysis (GSVA)
MSigDB is the largest collection of dataset for molecular markers [21]. It includes various gene expression features such as positional gene sets, strategy gene sets, regulatory target gene sets, computational gene sets, immune marker gene sets, feature gene sets, cancer marker gene sets, ontology gene sets, and cell type marker gene sets [21,22]. The GSVA package in R was used to compute sample-wise enrichment scores for MSigDB sets. Specifically, GSVA summarizes gene-level expression profiles into gene set-level activity scores, thereby transforming the original gene-by-sample expression matrix into a gene set-by-sample enrichment matrix. In this study, all MSigDB gene sets were jointly evaluated to generate an initial feature matrix comprising 35,206 gene set signatures across 166 TCGA-GBM samples. GSVA was implemented using the argument kcdf = “Gaussian”, with all remaining parameters set to their default values [23].
2.3. Unsupervised Consensus Clustering
Consensus clustering is a technique used to identify cluster members, allowing the differentiation of samples into subtypes based on various histological datasets. We utilized the ConsensusClusterPlus (v1.46.0) R package to perform clustering on the MSigDB gene set matrix (Row: pathway gene sets, n = 35,206; Colum: samples, n = 166) [24]. The clustering method employed was partitioning around medoids (PAM) with Minkowski distance and resampling 80% of the patients for 10 repetitions [25]. The cluster numbers (CNs) derived from this process were used for consensus assessment and survival analysis. The TCGA-GBM patients (n = 166) were divided into two clusters: C1-GBM (n = 57) and C2-GBM (n = 109).
2.4. Silhouette and Principal Component Analysis
The silhouette method is used to evaluate the quality of clustering in unsupervised machine learning algorithms [26]. It measures how well data points within a cluster are separated from those in other clusters. The silhouette score ranges from −1 to 1, with higher values indicating better-defined clusters, and the average silhouette width provides an overall assessment of clustering effectiveness [27]. Principal component analysis (PCA) is a statistical technique used for dimensionality reduction and feature extraction in data analysis and machine learning [28]. It aims to transform a dataset with potentially correlated variables into a new set of uncorrelated variables called principal components. PCA simplifies visualization by projecting high-dimensional data into lower dimensions, enabling easier assessment of clustering and data separation.
2.5. Mutation Analysis
To compare the C1-GBM and C2-GBM subtypes, we analyzed patient mutation data using the maftools R package [29]. Specifically, the CoOncoplot function depicted the mutation profiles of both subtypes, illustrating frequencies, co-occurrences, and exclusivities. For a more detailed statistical comparison, we employed the ForestPlot function to generate a forest plot, which revealed significant differences in gene mutations between the two types. This included effect sizes and confidence intervals, thus identifying genes significantly mutated in one subtype compared to the other.
2.6. Weighted Gene Co-Expression Network Analysis (WGCNA)
WGCNA was performed to explore gene–gene interaction patterns within the expression profiles of 964 prognostic tumor-related differentially expressed genes (DEGs) from the TCGA-GBM cohort [30,31]. First, we constructed a pairwise correlation matrix using Pearson correlation coefficients, with the similarity between genes and defined as , where and denote the expression profiles of genes and , respectively. The similarity matrix was then transformed into an adjacency matrix using a soft-thresholding power of = 5: , which increases the emphasis on stronger correlations. Next, a topological overlap matrix (TOM) was computed to capture both direct and indirect interactions based on shared neighbors. Hierarchical clustering was performed on the TOM-based dissimilarity to generate a gene dendrogram, and modules were identified using a minimum module size of 20 and a sensitivity of 4. Using a distance cutoff of 0.2, co-expression modules were defined; genes assigned to the grey module (unassigned genes) were excluded from downstream analyses. Hub genes were then identified from the non-grey modules based on high intramodular connectivity and strong module membership ( ); in total, nine hub genes were retained as candidate predictive biomarkers. Finally, module eigengene correlation heatmaps were generated to assess relationships among modules and to evaluate potential substructures.
2.7. Backpropagation (BP) Neural Network
The backpropagation (BP) neural network is a multilayer feedforward network trained using the backpropagation algorithm to minimize prediction error. We implemented a BP neural network in R using the NeuralNet package (v1.44.2) and used the expression levels of the nine hub genes as input features [32]. In the hidden layer, neuron activations were computed as , where denotes the activation function, is the weight matrix, is the input vector (gene-expression features), and is the bias vector. To constrain activations to the range [0, 1], we applied the sigmoid function . The output layer activation was computed using a linear function . Model performance was evaluated using repeated five-fold cross-validation: in each repeat, samples were randomly split into five folds, with four folds used for training and one fold held out for testing. This procedure was repeated 100 times (100 repeats), and accuracy, sensitivity, precision, and specificity were averaged across all folds and repeats. For external validation, the trained model was further assessed on the CGGA-GBM dataset ( ), where subtypes were predicted using the BP-based classifier.
2.8. Differential Gene and Functional Analysis
Differential expression genes (DEGs) between C1-GBM and C2-GBM were obtained from the limma R package using the following screening criteria: genes with p value < 0.05 and fold change (FC) > |1.5| were considered to be statistically significant [33].
DEGs from Tumor vs. normal: The RNAseq of GBM (n = 166) and normal tissue (n = 5, from TCGA-GBM dataset) resulted in 13,618 DEGs.DEGs between C1-GBM and C2-GBM clusters: The RNAseq data of C1-GBM (n = 57) and C2-GBM (n = 109) from GBM resulted in DEGs.We selected the overlapping genes between DEGs from the C1-GBM vs. C2-GBM clusters and DEGs from tumor vs. normal. We obtained tumor-related DEGs that are significantly different between C1 and C2-GBM (tumor-related DEGs).The tumor-related DEGs were used for the enrichment analysis of signaling pathways and Gene Ontology (R package clusterProfiler, false discovery rate (FDR) < 0.05 as statistically significant) [34].The univariate-Cox was analyzed by integrating OS.time and patient status phenotype dataset (n = 166) and 964 prognosis tumor-related DEGs were obtained.
2.9. Tumor Microenvironment (TME) Analysis
We analyzed the tumor microenvironment using RNA sequencing data from the TCGA-GBM cohort (n = 166) with the xCell [35], quanTISeq [36], Immunophenoscore [37], and CIBERSORT [38]. The xCell, quanTISeq, and CIBERSORT algorithms utilize a database of gene expression signatures from known cell types to obtain the abundance of different cells in the sample. By comparing the gene expression patterns from our samples with these reference datasets, we could determine the relative presence of various cell types within the sample. The xCell, quanTISeq, and CIBERSORT were used for the unsupervised clustering of immune cells, resulting in two classifications of immune enrichment: “hot” tumors (highly enriched in immune cells) and “cold” tumors (low immune infiltration).
2.10. Drug Sensitivity Prediction and Verification
We explored the Genomics of Drug Sensitivity in Cancer database to identify target drug for GBM cell lines, specifically focusing on the subtype-specific target within the PD1 pathway and G2/M checkpoint. Subtype-specific targets from the top DEGs are analyzed for protein–drug interactions (using the DrugBank database, Version 5.0) and protein–chemical interactions (using the Comparative Toxicogenomics Database). This analysis identified small molecular drugs, which we then validated for effectiveness through Genomics of Drug Sensitivity in Cancer (GDSC). The data of cancer cell lines from GDSC were analyzed using the GSCA (https://guolab.wchscu.cn/GSCA/#/drug, accessed on 14 January 2026) to determine the relationship between drug sensitivity and gene expression.
2.11. Survival Model Construction
In the C1-GBM subgroup, univariable Cox regression was performed to evaluate associations between overall survival (OS) and the log_2_(FPKM + 1)-transformed expression levels of IL6 pathway-related genes. Genes with p < 0.05 were considered candidate variables, and the top five genes with the smallest p-values were selected for downstream modeling. Similarly, in the C2-GBM subgroup, univariable Cox regression was conducted to screen G2/M checkpoint pathway-related genes, using the same criteria (p < 0.05) and selecting the top five genes with the smallest p-values. In total, 12 variables from the TCGA-GBM cohort were included in the final model: age at diagnosis, gender, and the log_2_(FPKM + 1)-transformed expression levels of OSMR, STAT3, MYD88, IL6ST, and SOCS3 for C1-GBM, as well as ABRAXAS1, UBE2V2, PSMF1, PSMA8, and KAT5 for C2-GBM. Optimal cut-off points for risk stratification were determined using the maxstat (v0.7-25) R package. Model discrimination was assessed by time-dependent ROC analysis at 1- and 3-year time points using timeROC (v0.4).
2.12. Statistical Analysis
All statistical calculations were performed using the R software, version 4.3.2. The significance test of the regression coefficients was conducted using the two-sided Student’s t-test. Pearson’s correlation analysis was employed to compute correlation coefficients between factors. For prognostic analysis, survival curves were generated using the Kaplan–Meier method, with significance evaluated via the log rank test.
3. Results
3.1. Identification of Two GBM Prognostic Subtypes Through Unsupervised Clustering
We utilized molecular signature sets from MSigDB via GSVA to form a comprehensive tumor process set of TCGA-GBM, comprising 35,206 signatures across 166 samples (Figure 1A). Unsupervised consensus clustering was then performed using the ConsensusClusterPlus R package with the number of clusters (CN) ranging from 2 to 10 to identify potential subtypes (Figure 1B). The evaluation of clustering consistency revealed that five clusters (CN = 5) reached the highest average cluster consensus score of 0.86, while two clusters (CN = 2) followed with an average score of 0.84 (Supplementary Figure S1A). Notably, increase in the area under the cumulative distribution function (CDF) was not substantial at CN = 5 (Supplementary Figure S1B). Moreover, survival analyses suggested limited separation among the five-cluster solution, with only two of the ten pairwise comparisons reaching statistical significance (Supplementary Figure S1C). In contrast, the two-cluster solution displayed a pronounced survival difference (p < 0.0001, log rank test; Figure 1B). Therefore, we selected CN = 2 for downstream analyses, defining two subtypes: C1-GBM (n = 57) and C2-GBM (n = 109). The consensus matrix for CN = 2 demonstrated stable cluster membership (Figure 1C). In addition, silhouette analysis (average silhouette width = 0.13) and principal component analysis (PCA) supported the separation between C1-GBM and C2-GBM (Figure 1D,E).
We next examined the clinical and molecular characteristics of these subtypes and compared them with previously reported GeneExp-Subtypes and Methylation Clusters [6,7]. C1-GBM showed a shorter overall survival (OS) time (313 days) and predominantly corresponded to the mesenchymal GeneExp subtype (n = 35, 61%) and methylation cluster Met2 (n = 13, 23%) among the six methylation clusters. Meanwhile, 2-GBM exhibited a longer OS time (452 days), was enriched for classical (34%) and proneural (34%) GeneExp subtypes, and aligned with methylation cluster Met4 (Figure 1F and Table 1). Mutation profiling revealed distinct patterns between the two subtypes. In C1-GBM, the most frequently mutated genes were PTEN (47%), TTN (31%), TP53 (24%), EGFR (22%), NF1 (18%), and MUC16 (16%). In C2-GBM, the highest mutation frequencies were observed in TP53 (42%), EGFR (34%), PTEN (27%), TTN (22%), MUC16 (17%), and NF1 (7%) (Figure 1G). Forest plot analysis further indicated a higher odds ratio of PTEN and NF1 mutations in C1-GBM, whereas TP53 mutation were more prevalent in C2-GBM; ATRX mutations were detected only in C2 (p < 0.05) (Supplementary Figure S1D). Collectively, these findings suggest that C1-GBM is more consistent with a mesenchymal-like molecular profile characterized by PTEN/NF1 alterations, while C2-GBM is more consistent with a proneural/classical-like profile with frequent TP53 mutations.
3.2. Identification of Featured Biomarkers for C1/C2 Subtypes via WGCNA
We employed Weighted Correlation Network Analysis (WGCNA) to partition 964 prognostic, tumor-related genes into ten co-expression modules and to identify hub genes based high module membership (Figure 2A,B). After excluding the grey module (unassigned genes), module–trait correlation analysis showed that the Yellow and Turquoise modules were positively associated with C1-GBM, whereas the Brown module was associated with C2-GBM (Figure 2C). Protein–protein interaction analysis using the STRING database indicated genes in the Yellow module was enriched for immune system-related functions, while the Brown module was predominantly involved in cell cycle processes (Figure 2D,E).
Among the selected hub genes, immunoglobulin κ variable 3-11 (IGKV3-11), leukocyte-associated immunoglobulin-like receptor 1 (LAIR1), vesicle-associated membrane protein 8 (VAMP8), type I collagen α2 chain (COL1A2), and plasminogen activator urokinase receptor (PLAUR) were highly expressed in C1-GBM, whereas cytoskeleton-associated protein 2-like (CKAP2L), serine protease 51 (PRSS51), microtubule-associated serine/threonine kinase 1 (MAST1), and SRY-box transcription factor 6 (SOX6) showed elevated expression in C2-GBM (Figure 2F). In addition, the cancer stemness score (RNAss) was negatively correlated with LAIR1 and VAMP8 and positively correlated with CKAP2L and SOX6 (Figure 2G), indicating that these hub genes are linked to tumor stemness-related characteristics. Survival analysis further showed that higher expression of IGKV3-11, LAIR1, VAMP8, COL1A2, and PLAUR was associated with poorer overall survival, whereas higher SOX6 expression was significantly associated with improved prognosis (Supplementary Figure S2A), supporting their potential prognostic value. Finally, a risk score derived from the nine-gene signature stratified patients into high- and low-risk groups; the high-risk group exhibited a 2.33-fold higher hazard compared with the low-risk group (Figure 2H), highlighting the significance of these signatures for risk prediction.
3.3. Classification Model Utilizing Machine Learning on Subtype-Specific Hub Genes
To apply the novel subtypes to the external dataset, we constructed a neural network-based classifier. Neural networks can capture nonlinear relationships and learn high-level representations from omics data [39,40], and they have been widely used for cancer classification tasks [41].
We developed a backpropagation (BP) neural network model to classify the C1 and C2 subtypes (Figure 3A). The model was trained on the TCGA-GBM cohort (n = 166) using repeated 5-fold cross-validation over 500 iterations. In each iteration, samples were randomly partitioned into five folds; four folds (approximately 80%) were used for training and the remaining fold (approximately 20%) was held out for internal validation. The nine hub genes were used as input features, and predicted labels were compared with the consensus clustering-defined C1/C2 assignments to evaluate model performance (Figure 3B). We evaluated multiple network architectures by varying the number of hidden layers (one to four) and the number of neurons per layer (four to eight), and optimized model weights using the backpropagation algorithm to minimize classification error. The final classifier consisted of a single hidden layer with five neurons and achieved a ROC AUC of 0.94, indicating strong discriminative performance (Figure 3C,D). Feature contribution analysis of the nine-gene signature showed that SOX6 had the highest contribution (Figure 3E). The trained classifier was then applied to the independent CGGA-GBM cohort (n = 85), stratifying patients into C1 (n = 26) and C2 (n = 59). Survival analysis and PCA in the CGGA cohort, together with subtype-specific hub gene expression patterns and their associations with prognosis, were consistent with the trends observed in the TCGA training cohort (Figure 3F−H and Supplementary Figure S3A), supporting the robustness of the classifier for external subtype prediction.
3.4. Differential Expression Genes Analyses Indicate Characteristics of C1 and C2 Subtypes
Given the distinct prognostic differences between the C1 and C2 subtypes, we performed differential expression analysis to identify genes with significant differential expression between C1-GBM and C2-GBM (C1 vs. C2). The analysis identified 6598 differentially expressed genes (DEGs) with a false discovery rate (FDR) < 0.05 and a fold change > |1.5| (Figure 2A). We then retained only those DEGs that also showed significant tumor–normal differences, resulting in 2555 tumor-related, subtype-specific DEGs that met both criteria (tumor vs. normal: FDR < 0.05, fold change > |1.5|; C1 vs. C2: FDR < 0.05, fold change > |1.5|). Among these, 1181 tumor-related genes were upregulated in C1-GBM and 1374 were upregulated in C2-GBM (Figure 4A, Table S1).
Pathway and Gene Ontology (GO) enrichment analysis was performed using the clusterprofiler R package with FDR < 0.05 as the significance cutoff. DEGs upregulated in C1-GBM were primarily enriched in the cytokine-cytokine receptor interaction, whereas DEGs upregulated in C2-GBM were mainly enriched in the cell cycle pathway (Figure 4B). Enrichment analysis of all 2555 DEGs further indicated broad involvement in immune-related pathways and biological processes (Figure 4C,D). In addition, analysis of MSigDB hallmark gene sets associated with cancer development, immunity, and signaling pathways, revealed significant differences in enrichment scores among C1-GBM, C2-GBM, and normal samples [22]. Specifically, C1-GBM showed higher enrichment of immune-related hallmarks, whereas C2-GBM exhibited stronger enrichment of proliferation-related hallmarks (Figure 4E). These patterns were further supported in the CGGA cohort, particularly for the IL6_JAK_STAT3_SIGNALING and G2/M_CHECKPOINT pathways, consistent with the trends observed in TCGA (Figure 4F).
Additionally, we investigated specific genes driving oncogenesis of C1-GBM and C2-GBM. In C1-GBM, key tumor driver genes included BIRC3 (Baculoviral IAP Repeat Containing 3), MET (MET Proto-Oncogene, Receptor Tyrosine Kinase), COL1A1 (Collagen Type I Alpha 1 Chain), CR1 (Complement C3b/C4b Receptor 1), and IL7R (Interleukin 7 Receptor). Conversely, in C2-GBM, distinct oncogenic roles were played by ADGRB1 (Adhesion G Protein-Coupled Receptor B1), MYCN (MYCN Proto-Oncogene, BHLH Transcription Factor), TOP2A (DNA Topoisomerase II Alpha), KIFC1 (Kinesin Family Member C1), and BCL7A (BAF Chromatin Remodeling Complex Subunit BCL7A) (Figure 4G). Overall, this study revealed distinct tumor characteristics between the C1-GBM and C2-GBM, with C1-GBM primarily linked to immune-related processes and C2-GBM to cell proliferation-related processes.
3.5. C1-GBM Exhibits an Immune-Infiltrated (“Hot”) Tumor Microenvironment with Checkpoint Upregulation
This study reveals that C1-GBM is preferentially enriched for immune-related pathways, whereas C2-GBM is more associated with cell cycle pathways through differential expression and enrichment analyses. To further characterize the biological basis of these differences, we investigated the tumor microenvironment (TME), a complex system consisting of various cells, molecules, and structures around a tumor which can shape tumor growth, invasion, and immune escape [42]. Chen et al. classified tumors into three immune phenotypes based on the degree of immune cell infiltration: immune-inflamed, immune-excluded, and immune-desert phenotypes [43]. Immune-inflamed tumors are often referred to as “hot” tumors, whereas immune-excluded and immune-desert tumors are commonly considered “cold” tumors [42,44]. In this study, we operationally defined “hot” tumors as those showing overall high immune cell infiltration and “cold” tumors as those with low infiltration. Among tumors with evaluable immune cell composition estimates (n = 63), 51 (81%) in C1-GBM exhibited substantial immune cell enrichment (Figure 5A), supporting an immune-inflamed (“hot”) phenotype.
We used four complementary computational methods (xCell, CIBERSORT, quanTISeq, and Immunophenoscore) to quantify immune infiltration and identify immune cell types. Across both TCGA-GBM and CGGA-GBM cohorts, C1-GBM consistently exhibited significantly higher immune scores than C2-GBM (Figure 5B,C). In particular, CD4^+^ T cells (supported by xCell, CIBERSORT, and quanTIseq) and macrophage subsets (M1 and M2 macrophages estimated by xCell and quanTISeq) were significantly more abundant in C1-GBM (Figure 5D,F,G). These findings were validated in the CGGA-GBM cohort, which also showed enrichment of CD4^+^ memory T cells, M1 macrophages, and M2 macrophages in C1-GBM (Figure 5E). Consistently, hallmark pathway analysis indicated that the IL6_JAK_STAT3_SIGNALING pathway was most enriched in C1-GBM, accompanied by elevated expression of key genes such as STAT3 (Signal Transducer and Activator of Transcription 3) and JAK1 (Janus Kinase 1) (Supplementary Figure S4A). IL-6 (Interleukin-6), a macrophage-secreted factor, can activate STAT3 to promote gene transcription [45,46].
Furthermore, immune phenotype analysis revealed that C1-GBM had higher enrichment of major histocompatibility complex (MHC) molecules and effector cell signatures, together with increased checkpoint-related signals, while showing lower suppressor-cell signals (Figure 5H). MHC molecules are essential for antigen presentation and the initiation of adaptive immune responses [47,48]. Correspondingly, MHC pathway-associated genes, including HLA-C (Major Histocompatibility Complex, Class I, C), HLA-DPA1 (Major Histocompatibility Complex, Class II, DP Alpha 1), HLA-DPB1 (Major Histocompatibility Complex, Class II, DP Beta 1), HLA-DQA1 (Major Histocompatibility Complex, Class II, DQ Alpha 1), HLA-DQA2 (Major Histocompatibility Complex, Class II, DQ Alpha 2), HLA-DRB5 (Major Histocompatibility Complex, Class II, DR Beta 5), and HLA-DRB6 (Major Histocompatibility Complex, Class II, DR Beta 6), were significantly upregulated in C1-GBM (Supplementary Figure S4B). Additionally, genes related to PD1 pathway, such as BATF (Basic Leucine Zipper ATF-Like Transcription Factor), HLA-DRB1 (Major Histocompatibility Complex, Class II, DR Beta 1), CD3D (CD3 Delta Subunit Of T-Cell Receptor Complex), LCK (LCK Proto-Oncogene, Src Family Tyrosine Kinase), PDCD1LG2 (Programmed Cell Death 1 Ligand 2), CD3E (CD3 Epsilon Subunit Of T-Cell Receptor Complex), CD3G (CD3 Gamma Subunit Of T-Cell Receptor Complex), CD8B (CD8 Subunit Beta), NFATC2 (Nuclear Factor Of Activated T Cells 2), and PDCD1 (Programmed Cell Death 1), were also significantly overexpressed in C1-GBM, suggesting their potential as therapeutic targets (Supplementary Figure S4C). In summary, C1-GBM is characterized by a highly immune-infiltrated microenvironment, with MHC-mediated antigen presentation, IL-6 secretion by macrophages, and the PD1 pathway playing critical roles in coordinating immune responses (Figure 5I), collectively emphasizing its distinct immunological landscape.
3.6. C2-GBM Exhibits a Tumor-Intrinsic Proliferative State with G2/M Checkpoint Activation
Analysis of hallmark gene sets revealed that the C2-GBM had the highest enrichment score for the G2/M checkpoint relative to C1-GBM (Figure 4E). The G2/M checkpoint pathway is essential for cell cycle progression and plays a significant role in cancer development, especially in high-risk populations [49]. We retrieved the hallmark G2/M checkpoint gene set (200 genes) and found that 82 genes were significantly upregulated in C2-GBM compared with both C1-GBM and normal samples, indicating pronounced activation of the G2/M checkpoint pathway in C2-GBM (Figure 6A, Table S1). Previous studies have reported that during the M phase, the kinase Aurora A (AURKA) and its cofactor Bora jointly activate PLK1, which subsequently triggers CDC25 phosphatase and the downstream activation of CDC2 (CDK1), forming a feedback loop that efficiently propels cells into mitosis [49]. Our analysis revealed a high positive correlation between the expression of AURKA, CDC25A, PLK1, CCNB2, and CDK1, all of which were highly expressed in C2-GBM (Figure 6C). Moreover, the expression of these genes was positively correlated with KEGG cell cycle pathway enrichment score (Figure 6B), supporting their association with enhanced G2/M checkpoint activity and proliferative capacity. This pattern was consistent in the CGGA-GBM cohort for the C2-GBM, further reinforcing the connection between these genes and G2/M checkpoint activation (Figure 6D). Collectively, these findings indicate that C2-GBM contributes to tumor growth through enhanced activation of the G2/M checkpoint pathway, underscoring its critical role in cell cycle regulation and tumor progression (Figure 6E).
3.7. Establishment of a GBM Survival Model
C1-GBM is characterized by an immune-infiltrated microenvironment with significant IL6 pathway activity, whereas C2-GBM is marked by tumor driver and activation of G2/M checkpoint for the cell cycle. To develop subtype-specific survival prediction models based on C1/C2 assignments as predicted by the BP neural network classifier, we explored clinical and molecular characteristics between C1-GBM (n = 98) and C2-GBM (n = 68) subtypes (Figure 7A). We employed correlation analysis between IL6 pathway-related genes and overall survival (OS) time in C1-GBM, as well as G2/M checkpoint pathway-related genes and OS time in C2-GBM, to select candidate variables (p < 0.05). According to the correlation analysis results, the model includes age, gender, log_2_ (FPKM + 1) gene expression level of OSMR, STAT3, MYD88, IL6ST, and SOCS3 for C1-GBM and ABRAXAS1, UBE2V2, PSMF1, PSMA8, and KAT5 for C2-GBM. We then constructed subtype-specific nomograms using variables screened (Figure 7B). Model performance was evaluated using time-dependent ROC analysis. In the TCGA-GBM training cohort, the time-dependent AUC values were above 0.7 for predicting 1-year and 3-year OS in both the C1-GBM and C2-GBM models (Figure 7C,D), demonstrating the nomogram’s effective discrimination capabilities. We further implemented risk stratification based on the total nomogram points. For C1-GBM, patients were classified into three risk groups: low-risk (total points < 102), middle-risk (102 total points < 291), and high-risk (total points 291). Similarly, patients in C2-GBM were stratified into three risk groups: low-risk (total points < 83), middle-risk (83 total points < 176), and high-risk (total points 176). The Kaplan–Meier analyses showed significant discrimination among the risk groups in C1-GBM and C2-GBM (p < 0.0001, log-rank test; Figure 7E,F).
3.8. Sensitive Drug Selection for Immune-Related C1 and Proliferative C2 Subtypes
Given the distinctive features of the two subtypes, we aimed to identify candidate drugs with potential subtype-specific efficacy. First, we retrieved pembrolizumab- and anti PD-1/PD-L1 response-related gene sets from CTR-DB and grouped them into signatures associated with drug sensitivity (response) and drug resistance (non-response). Enrichment analysis showed that C1-GBM displayed higher enrichment of the response signature, suggesting a greater likelihood of sensitivity to anti PD-1/PD-L1 therapy, whereas C2-GBM showed higher enrichment of the non-response signature, indicating potential resistance to pembrolizumab (Figure 8A).
Next, to target subtype-specific pathways, we explored the Genomics of Drug Sensitivity in Cancer (GDSC) resource for compounds directed against key DEGs in the PD1 pathway (predominant in C1) and five DEGs in the G2/M checkpoint pathway (predominant in C2) [50]. Our analysis highlighted JW-7-24-1, which targets LCK, as effective in 35 GBM cell lines, suggesting its potential against the PD1 pathway in C1-GBM (Figure 8B, Table S2). For C2-GBM, CD532 (targeting AURKA) and BI-2536 (targeting PLK1) showed efficacy in over 30 GBM cell lines, indicating their suitability for this subtype (Figure 8C, Table S2).
Finally, univariable Cox regression identified 138 DEGs associated with worse prognosis (HR > 1, p < 0.05) (Figure 8D, Table S1). We further prioritized subtype-specific high-expression prognostic DEGs as potential targets for small-molecule discovery, including F13A1 (Coagulation Factor XIII A Chain), CHI3L (Chitinase 3 Like 1), CXCL3 (C-X-C Motif Chemokine Ligand 3), FCGR2B (Fc Gamma Receptor IIb) in C1-GBM (log_2_ FC > 2), and VGF (VGF Nerve Growth Factor Inducible) and HOXA2 (Homeobox A2) in C2-GBM (log_2_ FC < −1). This led to the identification of 109 candidate compounds for C1 and 38 for C2 after excluding 21 overlapping compounds (Figure 8E, Table S3). Drug sensitivity analysis based on GDSC data prioritized Methotrexate and Cisplatin for C1-associated targets, whereas Cytarabine was prioritized for C2-GBM (Figure 8F–H, Table 2). Notably, these drugs have also demonstrated efficacy against acute lymphoblastic leukemia and cervical squamous cell carcinoma (Figure 8I).
4. Discussion
In this study, we created pathway-level activity profiles derived from MSigDB gene sets and applied unsupervised consensus clustering to classify GBM into two prognostically distinct subtypes. We further constructed a BP neural network classifier using a nine-gene signature (including IGKV3-11, LAIR1and SOX6) to enable subtype prediction in an independent cohort. Collectively, our results support a pathway-informed framework for GBM stratification that links clinical outcome to both tumor-intrinsic programs and the tumor immune microenvironment.
A key methodological feature of our work is the pathway-based representation of transcriptomic data. Compared with single-gene classifiers, pathway-level signatures can be more robust and biologically interpretable because they capture coordinated programs that underpin tumor behavior [17,19,20,51]. Using MSigDB signatures, our subtype solution showed clear survival separation (p < 0.0001, log-rank test) and demonstrated concordance with established transcriptomic categories, with C1-GBM more aligned with mesenchymal-like patterns and C2-GBM more aligned with classical- and proneural-like patterns [6,7]. This concordance suggests that the proposed subtypes capture biologically meaningful variation while providing improved prognostic resolution.
Mechanistically, the two subtypes appear to be driven by different dominant programs. C1-GBM is characterized by an immune-infiltrated microenvironment and prominent cytokine-associated signaling, with IL6–JAK–STAT3 signaling emerging as a representative pathway [45,46]. In line with an immune-inflamed (“hot”) phenotype, C1-GBM shows enrichment of immune cell signatures, including CD4+ T cells and macrophage-related programs. Memory CD4^+^ T cells can shape antitumor immunity by coordinating immune responses, and antigen presentation through major histocompatibility complex (MHC) molecules is critical for T cell activation and immune coordination [47,48,52,53]. The IL6-JAK-STAT3 axis provides mechanistic link between inflammatory signaling and tumor progression, as IL-6 can activates Janus kinase (JAK) enzymes to promote STAT3 phosphorylation and nuclear translocation, thereby regulating transcriptional programs involved in inflammation, survival, and immune modulation [45,46,54,55]. Notably, the immune-infiltrated state in C1-GBM is accompanied by checkpoint-associated signals, which is consistent with adaptive immune resistance and may reflect immune exhaustion features. This biological context supports the potential relevance of PD-1/PD-L1-directed strategies for a subset of C1-GBM patients while also emphasizing that immune infiltration alone does not necessarily translate into effective tumor control.
In contrast, C2-GBM exhibits a tumor-intrinsic proliferative program with low immune infiltration and strong activation of cell cycle regulation, including the G2/M checkpoint. Elevated activity of mitotic entry pathways suggests dependence on core cell cycle machinery, in which the Cyclin B–CDK1 complex plays a central role in driving the G2-to-M transition [49,56]. In addition, C2-GBM shows features consistent with oncogenic driver activity. Tumor drivers are genetic alterations that confer growth advantages and shape tumor evolution under selective pressures. In this context, increased MYCN expression, a MYC-family transcription factor implicated in proliferation and differentiation programs in multiple cancers including neuroblastoma, may contribute to the aggressive proliferative phenotype of C2-GBM [57,58]. Together, these observations support the interpretation that C2-GBM progression is primarily governed by proliferative and cell cycle programs, suggesting that therapeutic hypotheses for this subtype may prioritize targeting mitotic checkpoint vulnerabilities and oncogenic growth signaling rather than immune modulation.
In summary, we propose a pathway-informed classification of GBM into two prognostically distinct subtypes. C1-GBM represents an immune-infiltrated subtype with prominent inflammatory signaling and checkpoint-associated features, whereas C2-GBM represents a proliferation-associated subtype with strong G2/M checkpoint activity and tumor-intrinsic growth programs. This framework may facilitate improved prognostic stratification and support the development of subtype-tailored therapeutic strategies.
5. Conclusions
In this study, we employed pathway-based unsupervised clustering to classify GBM patients into two prognostically distinct subtypes: C1-GBM (immunosuppression-driven), which exhibits mesenchymal-like features and an immune-infiltrated microenvironment with checkpoint-associated signals, and C2-GBM (tumor inherent-driven), which shows proneural-like features and a proliferation-associated program with prominent cell cycle activity. C1-GBM displayed elevated immune microenvironment scores and immunological activity, consistent with an immune-inflamed (“hot”) phenotype, and showed enrichment patterns suggestive of potential responsiveness to anti-PD-1/PD-L1 immunotherapy. In contrast, C2-GBM exhibited lower immune infiltration and stronger activation of cell-cycle programs, including the G2/M checkpoint. To facilitate rapid and accurate diagnosis and classification, we constructed a BP neural network classifier based on a nine-gene signature, including IGKV3-11, LAIR1, VAMP8, COL1A2, PLAUR, CKAP2 L, MAST1, PRSS51, and SOX6. Moreover, we constructed subtype-specific prognostic models to estimate survival risk for patients classified as C1-GBM or C2-GBM. Based on the distinctive characteristics of these subtypes, we recommend small-molecule chemotherapy, specifically Methotrexate and Cisplatin for C1-GBM, and Cytarabine for C2-GBM. Overall, our study presents a pathway-informed framework for GBM classification and risk prediction, and it may facilitate future efforts toward subtype-tailored precision therapy.
The reference list from the paper itself. Each links out to its DOI / PubMed record.
- 1Phillips H.S. Kharbanda S. Chen R. Forrest W.F. Soriano R.H. Wu T.D. Misra A. Nigro J.M. Colman H. Soroceanu L. Molecular subclasses of high-grade glioma predict prognosis, delineate a pattern of disease progression, and resemble stages in neurogenesis Cancer Cell 2006915717310.1016/j.ccr.2006.02.01916530701 · doi ↗ · pubmed ↗
- 2Lee E. Yong R.L. Paddison P. Zhu J. Comparison of glioblastoma (GBM) molecular classification methods Semin. Cancer Biol.20185320121110.1016/j.semcancer.2018.07.00630031763 · doi ↗ · pubmed ↗
- 3Ghosh D. Nandi S. Bhattacharjee S. Combination therapy to checkmate Glioblastoma: Clinical challenges and advances Clin. Transl. Med.201873310.1186/s 40169-018-0211-830327965 PMC 6191404 · doi ↗ · pubmed ↗
- 4Cancer Genome Atlas Research Network Comprehensive genomic characterization defines human glioblastoma genes and core pathways Nature 200845510611068 Correction in Nature 2013, 494, 50610.1038/nature 0738518772890 PMC 2671642 · doi ↗ · pubmed ↗
- 5Zhao Z. Zhang K.N. Wang Q. Li G. Zeng F. Zhang Y. Wu F. Chai R. Wang Z. Zhang C. Chinese Glioma Genome Atlas (CGGA): A Comprehensive Resource with Functional Genomic Data from Chinese Glioma Patients Genom. Proteom. Bioinform.20211911210.1016/j.gpb.2020.10.005PMC 849892133662628 · doi ↗ · pubmed ↗
- 6Brennan C.W. Verhaak R.G. Mc Kenna A. Campos B. Noushmehr H. Salama S.R. Zheng S. Chakravarty D. Sanborn J.Z. Berman S.H. The somatic genomic landscape of glioblastoma Cell 201315546247710.1016/j.cell.2013.09.03424120142 PMC 3910500 · doi ↗ · pubmed ↗
- 7Verhaak R.G. Hoadley K.A. Purdom E. Wang V. Qi Y. Wilkerson M.D. Miller C.R. Ding L. Golub T. Mesirov J.P. Integrated genomic analysis identifies clinically relevant subtypes of glioblastoma characterized by abnormalities in PDGFRA, IDH 1, EGFR, and NF 1Cancer Cell 2010179811010.1016/j.ccr.2009.12.02020129251 PMC 2818769 · doi ↗ · pubmed ↗
- 8Louis D.N. Perry A. Reifenberger G. von Deimling A. Figarella-Branger D. Cavenee W.K. Ohgaki H. Wiestler O.D. Kleihues P. Ellison D.W. The 2016 World Health Organization Classification of Tumors of the Central Nervous System: A summary Acta Neuropathol.201613180382010.1007/s 00401-016-1545-127157931 · doi ↗ · pubmed ↗