Small Molecule Cocktail DLC79 Suppresses Gliomagenesis by Activating Ascl1 and Remodeling Transcriptome
Chuxiao Mao, Zhancheng Deng, Zhuming Chen, Lirong Huang, Caiyun Wang, Gong Chen, Qingsong Wang

TL;DR
A drug cocktail called DLC79 reprograms glioma cells into neuron-like cells, reducing tumor growth and offering a new therapy approach for glioblastoma.
Contribution
DLC79 is a novel small-molecule cocktail that pharmacologically reprograms glioma cells via ASCL1 activation, suppressing tumor growth and promoting neuronal differentiation.
Findings
DLC79 activates ASCL1 and reprograms glioma cells into neuron-like cells with upregulated neuronal markers.
DLC79 treatment inhibits glioma cell proliferation, migration, invasion, and clonogenicity in vitro.
In a xenograft model, DLC79 pretreatment reduced tumor bioluminescence by 56% and tumor mass by 47%.
Abstract
What are the main findings? A small molecule cocktail DLC79 (DAPT, LDN193189, CHIR99021, I-BET762, and Isx9) activates endogenous Ascl1 as a key drug target and remodels transcriptional identity, inducing the pharmacological reprogramming of glioma cells to neuron-like cells.DLC79 suppresses oncogenic behaviors (proliferation, migration, and invasion) and tumorigenicity in vivo. A small molecule cocktail DLC79 (DAPT, LDN193189, CHIR99021, I-BET762, and Isx9) activates endogenous Ascl1 as a key drug target and remodels transcriptional identity, inducing the pharmacological reprogramming of glioma cells to neuron-like cells. DLC79 suppresses oncogenic behaviors (proliferation, migration, and invasion) and tumorigenicity in vivo. What are the implications of the main findings? By suppressing tumorigenicity while promoting neuronal differentiation, this approach may open new avenues for…
Genes, proteins, chemicals, diseases, species, mutations and cell lines named across the full text — each resolved to its canonical identifier and authoritative record.
Click any figure to enlarge with its caption.
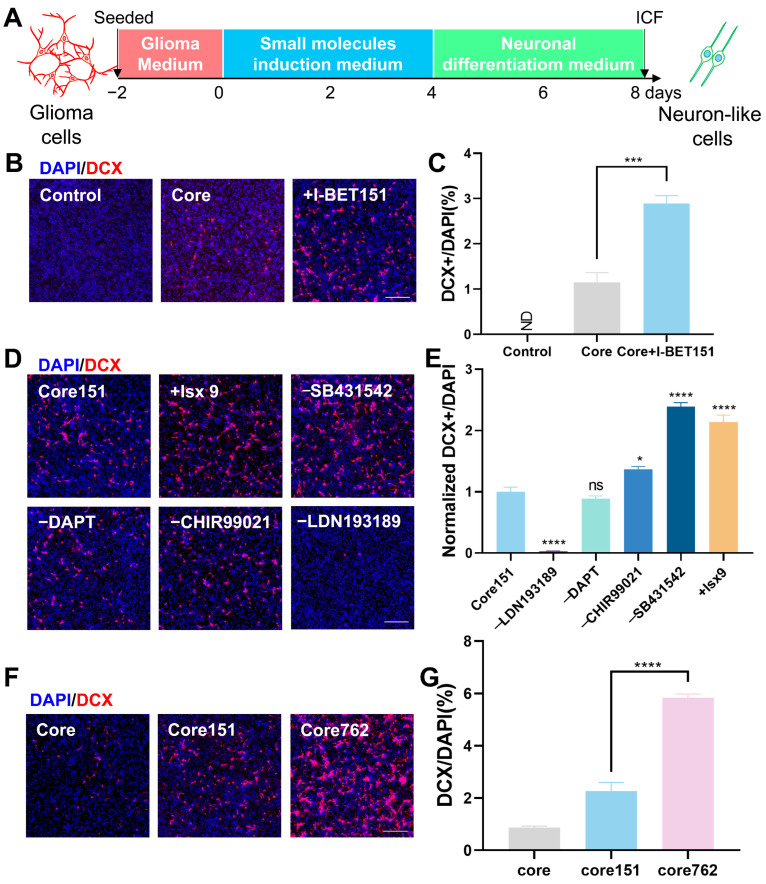 Figure 1
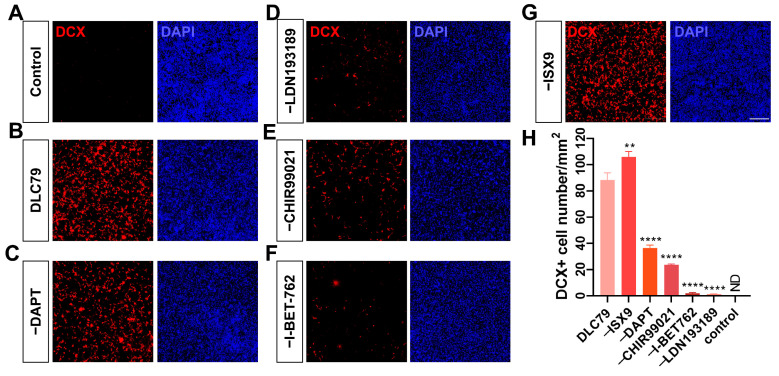 Figure 2
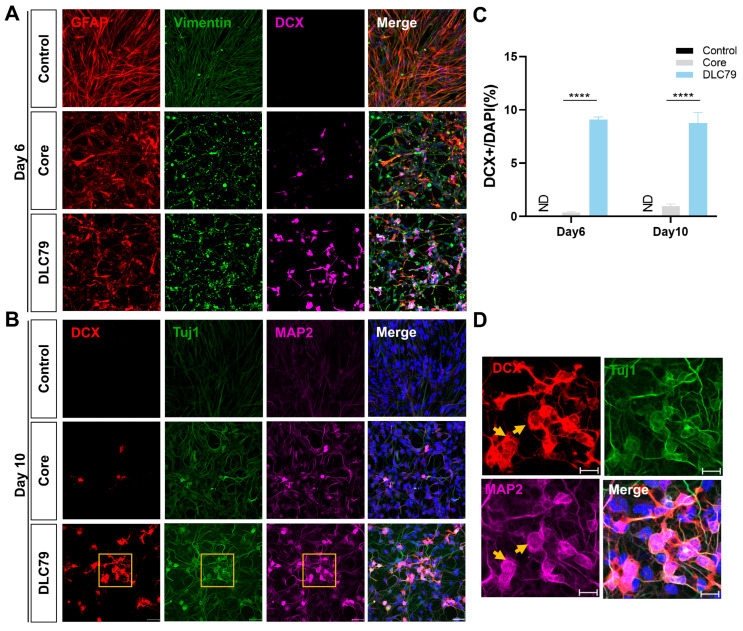 Figure 3
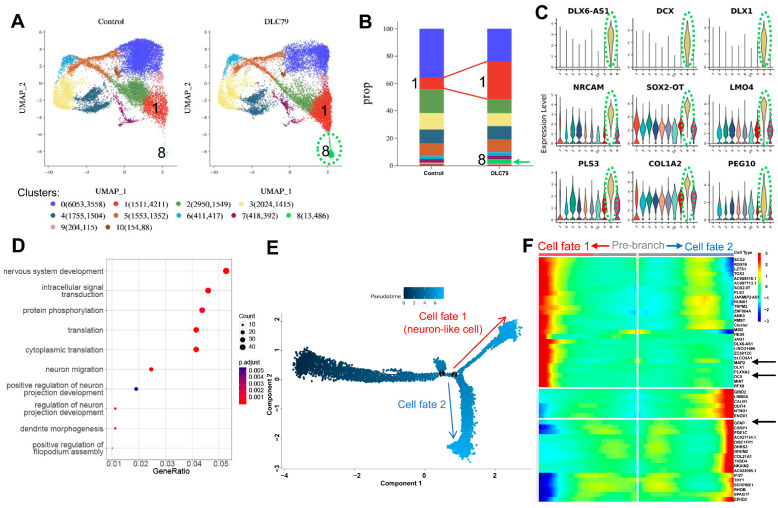 Figure 4
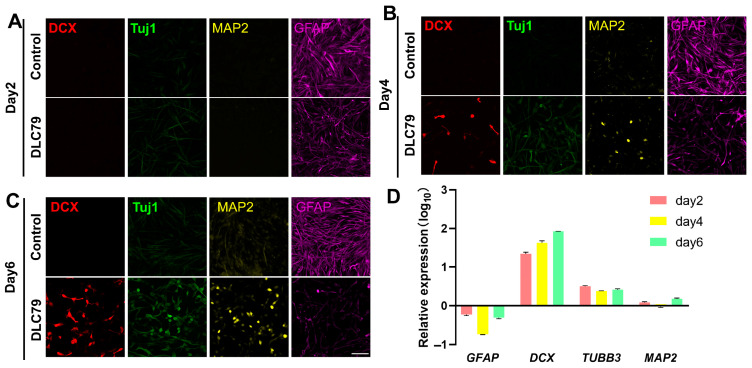 Figure 5
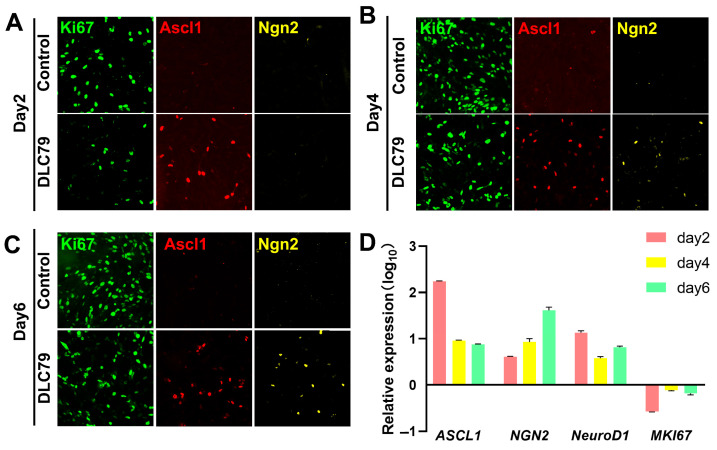 Figure 6
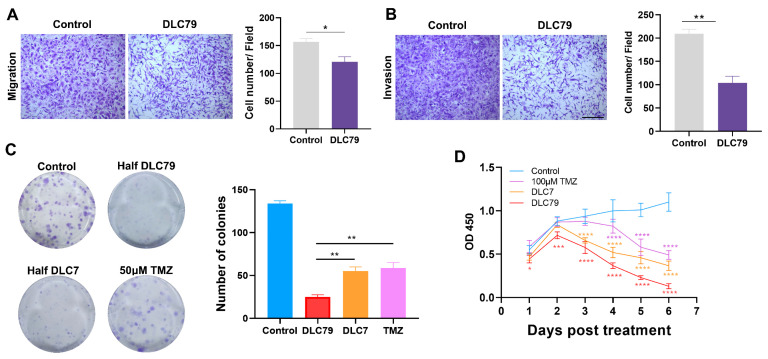 Figure 7
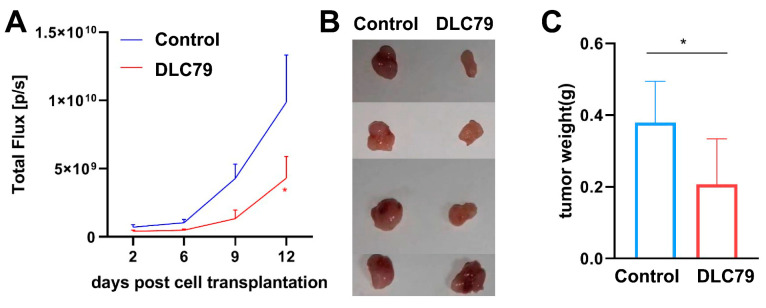 Figure 8
 Figure 9
 Figure 10
 Figure 11
 Figure 12
 Figure 13
- —Guangzhou Key Projects of Brain Science and Brain-Like Intelligence Technology
- —Program for Guangdong Introducing Innovative and Entrepreneurial Teams
- —Science and Technology Project in Guangzhou
- —Guangdong Province Science and Technology Project of China
- —National Natural Science Foundation of China
- —Natural Science Foundation of Guangdong Province of China
- —Jinan University Education Development Foundation
Peer Reviews
No public reviews on file for this paper yet. If you reviewed it on a platform where reviews are public (OpenReview, ICLR, NeurIPS, ICML), you can paste yours below so the community can read it here.
Videos
No videos yet. Explain this paper in a talk, walkthrough, or lecture? Add one.
Taxonomy
TopicsPluripotent Stem Cells Research · Neurogenesis and neuroplasticity mechanisms · Nuclear Receptors and Signaling
1. Introduction
Glioblastoma (GBM) is the most common and malignant primary brain tumor in adults, characterized by relentless proliferation, diffuse infiltration into surrounding brain tissue, and profound resistance to conventional therapies. The current standard treatment, which includes maximal safe surgical resection followed by radiotherapy and concomitant and adjuvant temozolomide (TMZ) chemotherapy, provides only a marginal survival benefit, with a median survival of approximately 15–17 months [1,2]. The inherent cellular and molecular heterogeneity of GBM, along with the presence of a robust blood–brain barrier, contributes significantly to treatment failure and the inevitable recurrence of the tumor [3]. The conventional approach to glioma management aims to kill or remove tumor cells. This strategy often results in damage to healthy brain tissue and is associated with severe side effects [4,5].
Pharmacological reprogramming has emerged as a paradigm-shifting alternative approach. By exploiting tumor cells’ plasticity, this strategy aims to pharmacologically convert malignant cells into non-proliferative, neuron-like cells—thereby ablating oncogenicity while potentially restoring neural architecture [6,7,8]. This concept builds upon studies demonstrating that the forced expression of neural transcription factors (TFs), such as Ascl1, Neurog2, NeuroD1, and NeuroD4, can induce glioma cell differentiation and suppress proliferation [9,10,11,12,13]. These TFs remodel cell fate through epigenetic modifications and the modulation of key developmental pathways like Notch, Wnt, and BMP [14,15,16,17,18,19]. Critically, small molecules present distinct pharmacological advantages over genetic TF delivery, offering precise temporal control, tunable dosing, multi-target engagement, and reduced immunogenicity [20,21]. We previously demonstrated that multi-target pharmacological agents can effectively convert astrocytes into neurons by modulating similar signaling pathways such as Notch, Wnt, and BMP [22,23]. Here, we extend this pharmacological approach to GBM, hypothesizing that modulating gliomagenic pathways with small molecules could induce therapeutic reprogramming.
This study identifies the multi-target small-molecule cocktail DLC79 (DAPT, LDN193189, CHIR99021, I-BET762, and Isx9), which pharmacologically reprograms glioma cells into GABAergic neurons through the activation of endogenous neural transcription factors such as Ascl1. DLC79 concurrently suppresses malignant phenotypes such as proliferation, migration, invasion, and clonogenicity, establishing a dual mechanism strategy with significant implications for GBM treatment.
2. Materials and Methods
2.1. Glioma Cell Culture and Neuronal Cell Induction
Human glioblastoma cell line U-251 MG (RRID: CVCL_0021, U251) was purchased from Wuhan Procell Life Science & Technology Co., Ltd. (Wuhan, China). U-87 MG-Luc (RRID: CVCL_C8WM, U87-Luci) was purchased from the German Collection of Microorganisms and Cell Cultures GmbH (DSMZ, Braunschweig, Germany). They were cultured in DMEM medium supplemented with 10% fetal bovine serum (FBS; Gibco/Thermo Fisher Scientific, Waltham, MA, USA), passaged at 90% confluence using 0.05% trypsin (Life Technology/Thermo Fisher Scientific, Waltham, MA, USA) and reseeded at a 1:5 ratio.
For neuronal induction, cells were plated on 0.1% gelatin-coated coverslips (10,000 cells/coverslip). At 80% confluence, the medium was replaced with induction medium (DMEM/F12, 0.4% B27, 0.8% N2) with small molecules (all the screened small molecules are in Table S2) or 0.05% Dimethylsulfoxide (DMSO) vehicle control for 6 days, then switched to neuronal differentiation medium (NDM) with DMEM/F12, 0.8% N2, 0.4% B27, 0.5% FBS, 1 μM Y-27632, 5 μg/mL vitamin C, 0.2% penicillin/streptomycin, 10 ng/mL Brain-Derived Neurotrophic Factor (BDNF), Glial cell line-Derived Neurotrophic Factor (GDNF), Neurotrophin-3 (NT3), and 20 ng/mL Insulin Growth Factor 1 (IGF-1). The concentrations of individual small molecules were selected based on previously reported effective doses in neural reprogramming studies and further optimized empirically during the screening process to maximize reprogramming efficiency while maintaining cell viability.
For extended culture experiments (up to 40 days), after the initial 6-day induction with small molecules or DMSO, cells were maintained in the differentiation medium with medium changes every 3–4 days.
2.2. Immunofluorescence Staining and Imaging
Cells were fixed in 4% Paraformaldehyde (PFA, LEAGENE, Beijing, China) for 15 min, permeabilized with 0.2% Triton X-100, blocked 3% bovine serum albumin (BSA) in phosphate-buffered saline (PBS), and incubated with primary antibodies at 4 °C overnight. After washing three times with 0.2% PBS containing Tween 20 (PBS-T), cells were incubated with fluorescence-conjugated secondary antibodies for 1 h at room temperature in the dark. The details of all the antibodies are listed in Table S1. Finally, the samples were mounted with an anti-fade mounting solution (Sigma-Aldrich, St. Louis, MO, USA) and imaged using Zeiss (Jena, Germany) confocal fluorescence microscopy.
The reprogramming efficiency, expressed as the percentage of Doublecortin (DCX)-positive (DCX^+^) cells, was quantified by the manual counting of DCX immunopositive cells and total DAPI-labeled nuclei from at least 20 randomly selected fields per condition across n ≥ three independent replicates. The percentage was calculated as (number of DCX^+^ cells/total number of DAPI^+^ cells) × 100%.
2.3. RNA Isolation, Reverse Transcription, and RT-qPCR
The total RNA of U251 cells was isolated using the TRIzol (Thermo Fisher Scientific, Waltham, MA, USA) method following the manufacturer’s protocols at day 2, 4, and 6. The RNA of each sample was reverse transcribed by the 1st Strand cDNA Synthesis Kit (Roche, Basel, Switzerland). Then, 2× SYBR Green PCR Master Mix (QIAGEN, Hilden, Germany) was used for RT-PCR. Each sample had three replicates. The primer sequences are listed as below (Table 1).
2.4. Cell Proliferation Assay
Cell proliferation was measured using a Cell Counting Kit-8 (CCK-8) assay. The cells were seeded in 96-well plates (4000 cells/well), treated with DLC79 or DMSO control for the indicated times (n = five replicates per group), and then incubated with CCK-8 reagent (GLPBIO, Montclair, CA, USA) for 1 h at 37 °C. The absorbance at 450 nm was measured using a microplate reader (Bio Tek, Winooski, VT, USA). The proliferation curve was plotted using GraphPad Prism (version 8.2.1, GraphPad Software, San Diego, CA, USA).
2.5. Cell Apoptosis Analysis by Annexin V/PI Staining
Cells were seeded in six-well plates and treated with indicated compounds. After 48 h, the cells were harvested with trypsin, washed twice with cold PBS, and resuspended in 100 μL of Annexin V binding buffer. The cell suspensions were incubated with 5 μL of Annexin V-FITC and 5 μL of propidium iodide (PI, 50 μg/mL) for 15 min at room temperature in the dark. Following incubation, 400 μL of binding buffer was added, and the samples were immediately analyzed by flow cytometry (Accuri C6, BD Biosciences, San Jose, CA, USA). The percentages of early apoptotic (Annexin V^+^/PI^−^) and late apoptotic/necrotic (Annexin V^+^/PI^+^) cells were quantified using FlowJo software (version 10.8.1).
2.6. Cell Cycle Analysis by PI Staining
Cells were plated and treated as described above. After harvesting, the cells were washed with PBS and fixed in 70% ice-cold ethanol dropwise while vortexing gently. The fixed cells were stored at −20 °C overnight, then washed and resuspended in PBS containing 50 μg/mL PI and 100 μg/mL RNase A. The samples were incubated for 30 min at 37 °C in the dark and analyzed by flow cytometry. Cell cycle distribution (G_0_/G_1_, S, and G_2_/M phases) and the sub-G_1_ apoptotic fraction were determined using FlowJo software (version 10.8.1).
2.7. Trans-Well Assay
Cells pretreated for 4 days were seeded in Matrigel-coated (invasion) or uncoated (migration) trans-well chambers (Corning Costar, Kennebunk, ME, USA; 8.0 μm pore size). After 24 h, the cells were fixed, stained with crystal violet, and counted (ImageJ v1.54). Triplicate experiments were performed.
2.8. Clonogenic Assay
The cells (300/well) were treated with half-concentration DLC79 or DMSO for 6 days, then cultured in DMSO for 4 days, and each group had three replicates. When visible colonies were formed, the cells were fixed with 4% PFA and stained with crystal violet solution. The numbers of colonies were counted using ImageJ version 1.54.
2.9. Single-Cell Sequencing
U251 cells treated with DLC79 or DMSO for 4 days were processed by SeekGene BioSciences (Beijing, China). Single-cell RNA-Seq libraries were prepared using SeekOne^®^ Digital Droplet Single Cell 3′ library preparation Kit (SeekGene, Beijing, China). Data were aligned to human GRCh38, analyzed with Seurat (version 4.1.1, clustering resolution: 0.3), and visualized via Uniform Manifold Approximation and Projection (UMAP). The lineage differentiation was assessed with Monocle 2 (version 2.26.0) for pseudotime trajectory analysis, employing default settings. The singleR package (version 1.8.1), with CellDex’s Human Primary Cell Atlas Data as the reference dataset. Identified differentially expressed genes (DEGs) were then subjected to Gene Ontology (GO) enrichment analysis for biological processes via Over-Representation Analysis (ORA).
2.10. Animals
BALB/c nude mice (aged 5–7 weeks) were procured from Guangdong Jicui Yaokang Biotechnology Co., Ltd. (Guangzhou, China). The mice were housed under specific pathogen-free (SPF) conditions (25 °C, 40–60% humidity, and 12 h light/dark cycle).
2.11. Subcutaneous Tumor Model Establishment
The U-87 MG-Luc cells (1.2 × 10^7^ cells/mL) were pretreated with DLC79 or 0.5% DMSO for 6 days. The mice were anesthetized with 2% isoflurane and 100 μL cell suspension was injected subcutaneously. The mice were monitored daily and euthanized upon reaching ethical limits (tumor volume ≤ 2000 mm^3^).
2.12. In Vivo Bioluminescence Imaging (BLI)
The mice received intraperitoneal D-luciferin potassium salt (150 mg/kg; GoldBio, St. Louis, MO, USA) and were imaged every 3–4 days using IVIS Spectrum (PerkinElmer, Waltham, MA, USA). The bioluminescent intensity (photons/second) within the tumor regions of interest (ROIs) was quantified using Living Image software (version 4.8.1).
2.13. Data and Statistics Analysis
Data analysis was performed using GraphPad Prism (version 8.2.1, GraphPad Software, San Diego, CA, USA). Data are represented as mean ± SEM (standard error of the mean). Student’s t-test and a one-way ANOVA were employed to assess the significance of differences between groups. A p-value of less than 0.05 was considered to indicate a statistically significant difference.
3. Results
3.1. Phenotype-Driven Discovery of DLC79: A Multi-Target Reprogramming Cocktail
Building on our prior work converting astrocytes to neurons [24], we hypothesized that glioma cells, sharing glial lineage plasticity, might be pharmacologically reprogrammed into neuron-like cells by using the small-molecule approach. Based on the core rationale of simultaneously modulating key signaling pathways, including transforming growth factor beta (TGF-β), bone morphogenetic protein (BMP), Notch, Wnt, and Hedgehog, involved in neural development and cell fate determination, we constructed a small-molecule cocktail using the Core drug consisting of SB431542, DAPT, CHIR99021, and LDN193189 [24]. We subsequently screened 14 neurogenic or anti-tumor compounds (Table S2) using the process illustrated in Figure 1A. The selection of candidates for the initial screening was based on their ability to target pathways complementary to the Core. The results show that I-BET151 [25,26,27] (BET inhibitor) significantly enhanced DCX (a marker for early neuronal development)-positive cells with higher conversion efficiency compared to the Core drug (2.58% vs. 1.15%; Figure 1B,C).
In order to further improve the conversion efficiency, subsequent optimization based on cocktail Core + I-BET151 (Core151) revealed that the addition of Isx9 [28] nearly doubled the induction efficiency of DCX-positive cells (as shown in Figure 1D–F). Interestingly, the exclusion of SB431542 increased the efficiency by 2.4-fold (Figure 1D,E). Few DCX signals could be detected after the removal of LDN193189 (Figure 1D), suggesting that LDN193189 may be a critical component in the glioma cell to neuron reprogramming. Compared to I-BET151, I-BET762 [29] (advanced BET inhibitor) further elevated the conversion efficiency to 5.84% with 4 days of treatment (Figure 1G). Together, the optimized cocktail comprises the following: DAPT (5 μM), LDN193189 (1 μM), CHIR99021 (1.5 μM), I-BET762 (1 μM), and Isx9 (5 μM), briefly called DLC79 hereafter (detailed in Table 2). This represents a rationally designed, multi-target pharmacological strategy to reprogram glioma cells into neurons.
3.2. Essentiality of DLC79 Components for Reprogramming Efficacy
Component exclusion assays demonstrated non-redundant roles in DLC79. The omission of the BMP pathway inhibitor LDN193189 or the BET protein inhibitor I-BET762 abolished reprogramming (Figure 2D,F). The removal of DAPT or CHIR99021 reduced DCX^+^ cells by 64% and 77%, respectively (Figure 2C,E,H). The omission of Isx9 increased the DCX^+^ cells, while the total glioma cell number also increased compared to the control group (Figure 2G,H). Ultimately, we concluded that the optimal combination remains as DLC79, which achieves 88 DCX-positive cells per mm^2^ (Figure 2H). Although the conversion number appeared to be low, the other non-converting glioma cells were affected by the small molecules as well; see the further investigation below.
3.3. DLC79 Drives Pharmacological Reprogramming of Neuronal Identity
Next, we further examined the cell identity after DLC79 treatment using a series of neuronal markers. After six days of DLC79 treatment, the induced DCX-positive cells exhibited a bipolar neuron-like morphology and lacked co-labeling with the glial cell marker GFAP and the epithelial–mesenchymal transition (EMT) marker Vimentin (Figure 3A). Subsequently, upon switching to a neural differentiation medium, an increased number of DCX-positive neuron-like cells were observed by Day 10, which co-expressed with the neuronal markers Tuj1 and MAP2 (Figure 3B,D).
In comparison to the initial Core drug cocktail, our refined multi-target cocktail, DLC79, markedly enhanced the number and induction efficiency of DCX-positive neuron-like cells. DLC79 treatment for 6 days achieved a peak conversion efficiency of approximately 9.09% for DCX^+^ neuron-like cells. Even after switching to the factor-enriched neuronal differentiation medium (NDM) from day 6, the conversion efficiency driven by DLC79 was not significantly enhanced (Figure 3C). This result demonstrates that, unlike the Core cocktail, DLC79 exhibits a lower dependency on exogenous differentiation cues for inducing neuronal conversion.
3.4. Single-Cell Transcriptomics Reveals Reprogramming Trajectories
To elucidate the mechanism underlying DLC79-induced neuronal reprogramming, we performed single-cell RNA sequencing on U251 cells after 4 days of treatment. UMAP analysis partitioned 32,133 cells into 11 distinct clusters (Figure 4A). DLC79 treatment markedly reduced tumor-related clusters (cluster 0, 2, and 3), which expressed genes linked to the tumor immune microenvironment (e.g., NPY1R and MEST), extracellular matrix (CCN1 and RUNX2), and proliferation-associated histones (HIST1H4C). Conversely, clusters 1 and 8 were substantially expanded. Cluster 1, from 1511 to 4211, showed enrichment for neurodevelopmental genes (RGS16 and SCG2), while cluster 8—increasing 37-fold after treatment—displayed strong induction of neuronal markers DCX, DLX1, and NRCAM (Figure 4B,C and Table S3). Additionally, high expression levels of SOX2-OT (SOX2 overlapping transcript, lncRNA) and LMO4 (LIM domain-only 4) related to neurogenesis and neuron development were observed in these cells (Figure 4C).
Gene Ontology (GO) analysis within cluster 1 confirmed enrichment in nervous system development, neuron migration, and axon projection (Figure 4D). This analysis revealed that the DEGs are predominantly associated with key biological processes such as nervous system development, intracellular signal transduction, protein phosphorylation, translation, cytoplasmic translation, neuron migration, and the positive regulation of neuron projection development (Figure 4D).
Pseudotime trajectory analysis further revealed two divergent cell fates: one progressing toward a neuron-like state (cell fate 1), and the other retaining glial identity (cell fate 2, Figure 4E). The heatmap of DEGs at branch point 2 highlighted the gene expression patterns distinguishing these two fates, with neuro-related genes such as DCX, MAP2, and DLX1 being highly expressed in the neuron-like cells, and GFAP expression being low (Figure 4F). These results demonstrate that DLC79 drives transcriptional remodeling toward a neuronal gene program, effectively suppressing glioma cell identity.
3.5. Pharmacodynamic Profile of DLC79-Induced Reprogramming
We assessed neuronal reprogramming over the short-term (days 2, 4, and 6) and extended (up to day 40) the culture periods by immunofluorescence for Tuj1, MAP2, DCX, and GFAP. DCX^+^ cells emerged at day 4 and increased markedly by day 6 (Figure 5A–C). Tuj1 and MAP2 expression also intensified over time, while GFAP declined. At day 24, a subset of MAP2^+^ cells co-expressed GABA, suggesting an inhibitory neuronal phenotype; other subtype markers were undetected (Figure S1A).
The qPCR analysis revealed rapid upregulation of neuronal genes: DCX increased nearly 20-fold by day 2 and over 80-fold by day 6; TUBB3 peaked at 3-fold on day 2 and remained elevated. MAP2 showed modest increase (1.5-fold) only on day 6. In contrast, GFAP expression dropped sharply to less than 0.2 times of the control by day 4 and partially recovered by day 6 (Figure 5D). These results, consistent with the protein expression patterns, underscore the upregulation of neural-related genes and the downregulation of glia-related genes during DLC79 treatment.
After 24 days, many cells retained DCX expression with elongated neurites and enhanced MAP2/Tuj1 co-localization, but NeuN remained undetected (Figure S1B). By day 40, RT–qPCR showed that NeuroD1 and Neurog2 had been downregulated to levels comparable to the control, while ASCL1 remained elevated (nearly 10-fold). The expression of MAP2, which had shown only a modest (1.5-fold) increase at day 6 of induction, gradually amplified to approximately 3-fold relative to the control. NEUN was undetectable in both groups, indicating incomplete neuronal maturation under these culture conditions (Figure S1C).
3.6. DLC79 Triggered the Activation of Neuronal Transcription Factors
To investigate the transcriptional mechanisms underlying DLC79-induced neuronal reprogramming in glioma cells, we performed single-cell regulatory network inference and clustering (SCENIC) analysis [30]. This revealed altered activity of key transcription factors (TFs): POU3F2, SOX9, and STAT2 were downregulated, while RUNX1, SOX4, and KLF12 were upregulated in DLC79-treated cells (Figure S2A), which was consistent with the RT–qPCR results (Figure S2B). Notably, DLC79 activated the DLX family (DLX1 and DLX6) and bHLH family (Ascl1) TFs.
KI67 protein levels were downregulated during treatment with DLC79, with the most pronounced suppression observed on day 2, after which KI67-positive cell counts gradually returned to levels comparable to the control group (Figure 6A–C). This could be attributed to contact inhibition. Notably, the neural transcription factor Ascl1 was activated on day 2 (Figure 6A). On day 4, a subset of cells expressed the neural transcription factor Neurog2 (Figure 6B), with a higher expression on day 6 (Figure 6C).
The gene expression pattern of MKI67 in the DLC79-treated group mirrored the staining results, with expression being suppressed relative to the control group (Figure 6D). Notably, MKI67 expression showed a transient suppression at day 2 followed by a recovery towards baseline by day 6, suggesting a dynamic or heterogeneous response to the reprogramming cue. Ascl1 exhibited the most profound upregulation, peaking at over 170-fold on day 2 before declining to 8-fold by day 6. Neurog2 expression rose steadily, reaching 42-fold by day 6. This rapid, potent induction of Ascl1 aligns with its established role as a master regulator capable of driving neuronal conversion, suggesting it is a key pharmacological mediator of DLC79′s effects (Figure 6D).
3.7. DLC79 Reduces Malignant Phenotypes of Glioma Cells In Vitro
We evaluated the anti-tumor effects of DLC79 using functional assays. Trans-well experiments showed that DLC79 significantly impeded the migration and invasion of U251 and U87-Luci cells (Figure 7A,B and Figure S3A,B). DLC79 decreased migrating, from 156.6 ± 8. 5 in the control group to 120.5 ± 13.4 in the group. Similarly, the total number of invading cells was reduced from 209.5 ± 13.2 to 103.8 ± 20.4 cells in the DLC79 group. Colony formation was also strongly inhibited: DLC79 reduced the number of U251 colonies by over 75% compared to the controls (25.0 ± 3.6 vs. 134.0 ± 4.3 in control), an effect dependent on the full combination, outperforming both the incomplete cocktail (DLC7) and temozolomide (Figure 7C). A similar suppressive effect was observed in U87-Luci cells (Figure S3C).
CCK-8 assays revealed that DLC79 strongly inhibited proliferation, with a 38.4% reduction by 48 h and 88.2% suppression on day 6, outperforming 100 μM TMZ (55.5% inhibition) (Figure 7D). Proliferation arrest was associated with the downregulation of MKI67 (Figure 6D). U87-Luci cells also exhibited sustained proliferation arrest under DLC79 treatment (Figure S3D).
Together, these data demonstrate that DLC79 effectively curbs glioma aggressiveness by inhibiting migration, invasion, clonogenicity, and proliferation, with converted cells exhibiting immature neuronal features.
3.8. DLC79 Treatment Attenuates Tumor Growth In Vivo
To evaluate the persistent, cell-intrinsic effect of DLC79 on the tumor-initiating capacity, we subcutaneously implanted U87-Luci cells that had been pretreated in vitro with DLC79 or DMSO for 6 days into nude mice. Quantitative analysis showed a 56% reduction in BLI signal intensity in the DLC79 group (4.3 × 10^9^ p/s vs. 9.9 × 10^9^ p/s in controls) by day 12 (Figure 8A). The excised tumors from the DLC79 group were visibly smaller and demonstrated a 47.4% reduction in average weight (0.20 g vs. 0.38 g in controls) (Figure 8B,C). No significant body weight loss or systemic toxicity was observed. These results indicate that brief preconditioning with DLC79 effectively attenuates the tumorigenic potential of glioblastoma cells in vivo. Furthermore, the pretreated cells were not overtly toxic, as evidenced by the absence of significant body weight loss or systemic illness in mice compared to the controls.
4. Discussion
Building upon our demonstration of pharmacological reprogramming in astrocytes, this study establishes that glioma cells are similarly amenable to small molecule-induced neuronal conversion. We identified the multi-target cocktail DLC79—comprising DAPT, LDN193189, CHIR99021, I-BET762, and Isx9—as a potent multi-target inducer of neuronal reprogramming in human glioma cells. LDN193189 proved essential for reprogramming efficacy, while SB431542 reduced efficiency. SB432542, a TGF-β pathway inhibitor targeting the Alk 4, Alk 5, and Alk 7 receptors, is often paired with LDN193189, which targets the Alk 2 and Alk 3 receptors, to serve as dual SMAD inhibitors [18,31,32,33]. It has been shown that these two molecules may elicit opposing serotonergic differentiation effects during the in vitro induction of mouse embryonic stem cells [34]. This divergence may result from their complex interactions with additional pathways or kinases [35], reflecting complex pathway interactions during glial-to-neuronal transition. Isx9 was retained despite decreasing the DCX^+^ cell number due to its critical neuro-inductive properties [36], exemplifying rational polypharmacology optimization.
4.1. Strengths
DLC79 triggered Ascl1-dependent transcriptional remodeling, upregulating neuronal markers (DCX increased 80-fold) while suppressing glial identity (GFAP decreased 80%). Single-cell RNA sequencing confirmed the induction of a GABAergic neuronal trajectory, consistent with ASCL1′s role in inhibitory neuron development. With extended culture, the induced neuron-like cells exhibited continuous neurite elongation and expressed the inhibitory neuronal marker GABA, aligning with the finding that Ascl1 predominantly promotes the generation of GABAergic neurons in the reprogramming of human glioma cells [37]. The resulting neuron-like cells exhibited extended neurites and expressed GABA, supporting a functional shift toward a neuronal phenotype.
Functionally, DLC79 suppressed malignant behaviors—proliferation, migration, invasion, and clonogenicity—in glioma models. Notably, DLC79 treatment reduced in vivo tumor growth by 56%, indicating a reduction in tumorigenicity through pharmacological reprogramming.
4.2. Limitations and Future Directions
This study has several limitations that should be considered. First, while systemic administration after tumor transplantation represents the gold standard for evaluating therapeutic efficacy, our subcutaneous model involving the implantation of pretreated cells was primarily designed to assess the intrinsic and persistent changes induced by DLC79, rather than to directly simulate a clinical treatment regimen. Second, this work serves as a proof-of-concept study to establish the initial efficacy and potential mechanism of DLC79. The use of established cell lines, rather than patient-derived cells or orthotopic models, limits the generalizability of our findings, and validation in more representative and clinically relevant models is warranted. Third, the observation of incomplete tumor ablation suggests that a subpopulation of cells may exhibit intrinsic resistance, or that the drug-induced suppression of the oncogenic phenotype is not fully sustained in vivo. Fourth, while our single-cell RNA sequencing data revealed a transcriptional shift towards a neuronal program, the absence of complementary epigenomic data (e.g., ATAC-seq) limits our ability to fully characterize the chromatin remodeling dynamics underlying this reprogramming. Future work integrating multi-omics approaches will provide a more comprehensive understanding of the epigenetic remodeling driven by DLC79. The initial interpretation of DLC79′s mechanism was limited by the lack of direct analysis of the cell cycle and apoptosis. To address this, we performed the recommended flow cytometry analyses. The results confirmed that DLC79 treatment induced significant apoptosis (increased Sub-G1 and Annexin V+ populations) in the treated cells (Figure S4). This demonstrates that the suppression of malignancy involves not only phenotypic modulation but also the direct induction of cell death in a subset of the population. Future studies should investigate the molecular pathways linking the activated neurogenic program (e.g., ASCL1 induction) to the cell fate decision across glioma models with different genetic backgrounds.
Furthermore, the observed transient suppression of the proliferation marker Ki-67 (MKI67) in vitro, which recovered partially by day 6 (Figure 6D), may appear contradictory to the sustained 56% reduction in tumor growth in vivo. This apparent discrepancy can be reconciled by considering several non-exclusive mechanisms. First, the initial potent arrest likely reflects the direct anti-proliferative effect of the cocktail, captured by the CCK-8 assay (Figure 7D). The subsequent recovery may stem from cellular heterogeneity, where a subpopulation adapts or resists full cell cycle exit, and from contact inhibition in confluent cultures. Crucially, the in vivo tumorigenicity assay measured the functional outcome of a 6-day pretreatment. This pretreatment establishes a persistent reprogrammed transcriptional state (Figure 4) that compromises the long-term tumor-initiating capacity, independent of the instantaneous Ki-67 level at the implantation timepoint. Thus, the in vivo efficacy reflects a stable impairment of oncogenic potential induced by the reprogramming event, rather than a mere continuation of the acute cytostatic state observed in vitro. This also explains that while the in vitro neuronal conversion efficiency of DLC79 is ~9%, the observed 56% reduction in in vivo tumor growth is likely a composite effect. This includes the direct loss of proliferative capacity in the converted neuron-like subset, coupled with a broader DLC79-induced suppression of oncogenic behaviors (proliferation, migration, etc.) across the treated cell population, as demonstrated by our functional assays. This suggests that DLC79 may induce a stable, less aggressive cellular state, which in itself constitutes a valuable therapeutic strategy.
Future studies aimed at in vivo therapeutic application will need to address BBB (blood–brain barrier) penetration [38] and potential systemic toxicity. Reformulation (e.g., using nanocarriers) and the identification of the minimal effective component combination [38,39,40] will be critical next steps. To enhance efficacy, future studies could explore combining DLC79 with established clinical modalities. Finally, despite the translational challenges related to blood–brain barrier penetration and sustained drug delivery, these may be addressed by integrating DLC79 with advanced carriers (e.g., liposomes, exosomes, or novel nanocarriers) or through specific chemical modifications to improve its pharmacokinetic profile. These approaches represent the key foci for future optimization.
5. Conclusions
In conclusion, our research demonstrates that the DLC79 multi-target pharmacological agent effectively induces glioma cells to adopt neuronal characteristics and reduces their oncogenic behavior, primarily through the chemical activation of the key neural transcription factor Ascl1. The DLC79 effectively reduces the tumorigenicity of U87-Luci glioblastoma cells in vivo, highlighting the potential of pharmacological reprogramming as a paradigm-shifting anti-glioblastoma therapy. This work opens avenues for targeting cellular plasticity in glioma through small molecule-driven transcriptional remodeling.
6. Patents
A patent application related to the cocktail of small molecule compounds and their use in glioma treatment in this manuscript has been filed in China by Gong Chen, Chuxiao Mao, Qingsong Wang, and Zhuming Chen, Jinan University. The allocation number is 202410742908.3.
The reference list from the paper itself. Each links out to its DOI / PubMed record.
- 1Stupp R. Mason W.P. van den Bent M.J. Weller M. Fisher B. Taphoorn M.J.B. Belanger K. Brandes A.A. Marosi C. Bogdahn U. Radiotherapy plus concomitant and adjuvant temozolomide for glioblastoma N. Engl. J. Med.200535298799610.1056/NEJ Moa 04333015758009 · doi ↗ · pubmed ↗
- 2Hegi M.E. Diserens A. Gorlia T. Hamou M.-F. De Tribolet N. Weller M. Kros J.M. Hainfellner J.A. Mason W. Mariani L. MGMT gene silencing and benefit from temozolomide in glioblastoma N. Engl. J. Med.2005352997100310.1056/NEJ Moa 04333115758010 · doi ↗ · pubmed ↗
- 3Dewdney B. Jenkins M.R. Best S.A. Freytag S. Prasad K. Holst J. Endersby R. Johns T.G. From signalling pathways to targeted therapies: Unravelling glioblastoma’s secrets and harnessing two decades of progress Signal Transduct. Target. Ther.2023840010.1038/s 41392-023-01637-837857607 PMC 10587102 · doi ↗ · pubmed ↗
- 4Jain K.K. A Critical Overview of Targeted Therapies for Glioblastoma Front. Oncol.2018841910.3389/fonc.2018.0041930374421 PMC 6196260 · doi ↗ · pubmed ↗
- 5Gritsch S. Batchelor T.T. Gonzalez Castro L.N. Diagnostic, therapeutic, and prognostic implications of the 2021 World Health Organization classification of tumors of the central nervous system Cancer 2022128475810.1002/cncr.3391834633681 · doi ↗ · pubmed ↗
- 6Bhat G.R. Sethi I. Sadida H.Q. Rah B. Mir R. Algehainy N. Albalawi I.A. Masoodi T. Subbaraj G.K. Jamal F. Cancer cell plasticity: From cellular, molecular, and genetic mechanisms to tumor heterogeneity and drug resistance Cancer Metastasis Rev.20244319722810.1007/s 10555-024-10172-z 38329598 PMC 11016008 · doi ↗ · pubmed ↗
- 7Wu Z. Lee Y.F. Yeo X.H. Loo S.Y. Tam W.L. Shifting the Gears of Metabolic Plasticity to Drive Cell State Transitions in Cancer Cancers 202113131610.3390/cancers 1306131633804114 PMC 7999312 · doi ↗ · pubmed ↗
- 8Hu Y.N. Liu J.M. Tu J. Yang M. He Q. Li F. Xu X. Ji Z. Xu J. Zhong W. Rapid and Effective Neuronal Conversion of Human Glioblastoma In Vitro and In Vivo Using Potent Small Molecules Cell Proliferat 202558 e 7001310.1111/cpr.70013 PMC 1233645740070092 · doi ↗ · pubmed ↗