BCAR3 Hypomethylation as a Potential Diagnostic Marker for Thyroid Cancer and Its Mechanism via Promoting EMT and AKT/mTOR Pathway
Wenkang Yu, Yizhu Mao, Yifei Yin, Jiacheng Yang, Yi Zhang, Xuandong Huang, Yifen Zhang, Chenxia Jiang, Rongxi Yang

TL;DR
This study shows that BCAR3 hypomethylation helps identify thyroid cancer and promotes cancer growth through specific pathways, suggesting it could be a new diagnostic tool and treatment target.
Contribution
The study identifies BCAR3 hypomethylation as a novel diagnostic biomarker and functional driver in thyroid cancer via AKT/mTOR and EMT mechanisms.
Findings
BCAR3 is hypomethylated in thyroid cancer compared to benign nodules, with CpG_6 strongly linked to cancer risk.
BCAR3 promotes cancer cell growth, migration, and invasion through AKT/mTOR activation and EMT.
Rescue experiments with a PI3K activator partially restored BCAR3-induced effects.
Abstract
Distinguishing malignant from benign thyroid nodules preoperatively remains a significant diagnostic challenge. This study investigated the role of a gene called BCAR3 in thyroid cancer. Using a large cohort of 793 clinical samples and cell experiments, we discovered that BCAR3 loses a specific regulatory mark (DNA methylation) in thyroid tumors, and we demonstrated that BCAR3 promotes tumor cell growth, migration, and invasion through the AKT/mTOR pathway and epithelial–mesenchymal transition. Therefore, measuring BCAR3 methylation has the potential to serve as a novel diagnostic biomarker, and BCAR3 itself represents a promising future therapeutic target for thyroid cancer. Background: BCAR3 has been implicated in various cancers, yet its role in thyroid cancer (TC) remains unclear. This study aimed to investigate the methylation status, functional effects, and underlying mechanisms…
Genes, proteins, chemicals, diseases, species, mutations and cell lines named across the full text — each resolved to its canonical identifier and authoritative record.
Click any figure to enlarge with its caption.
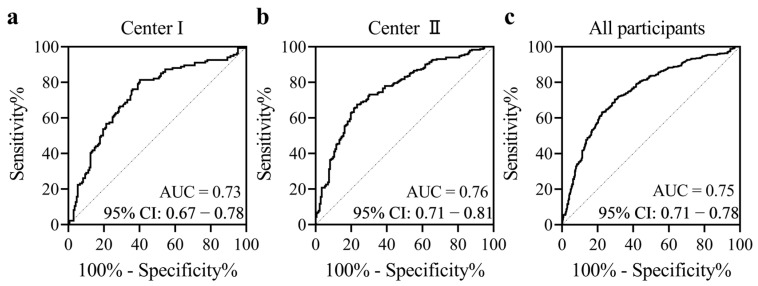 Figure 1
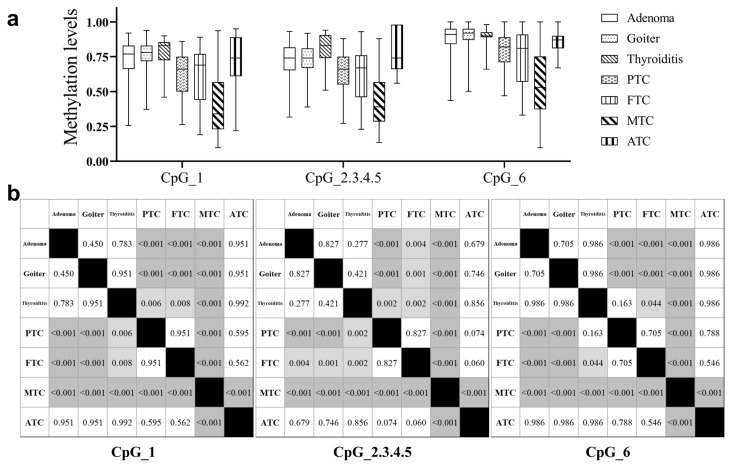 Figure 2
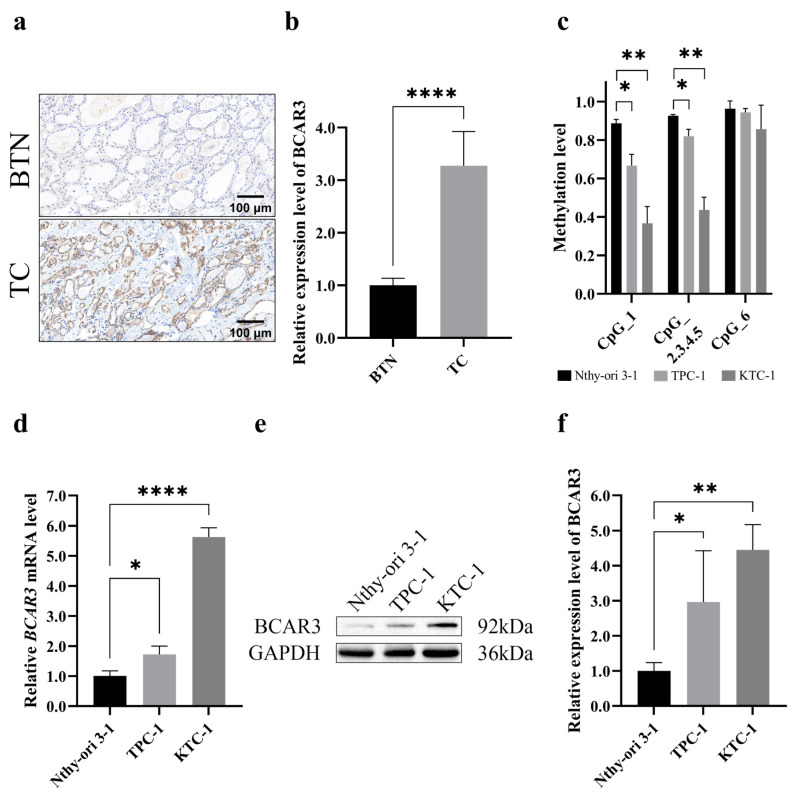 Figure 3
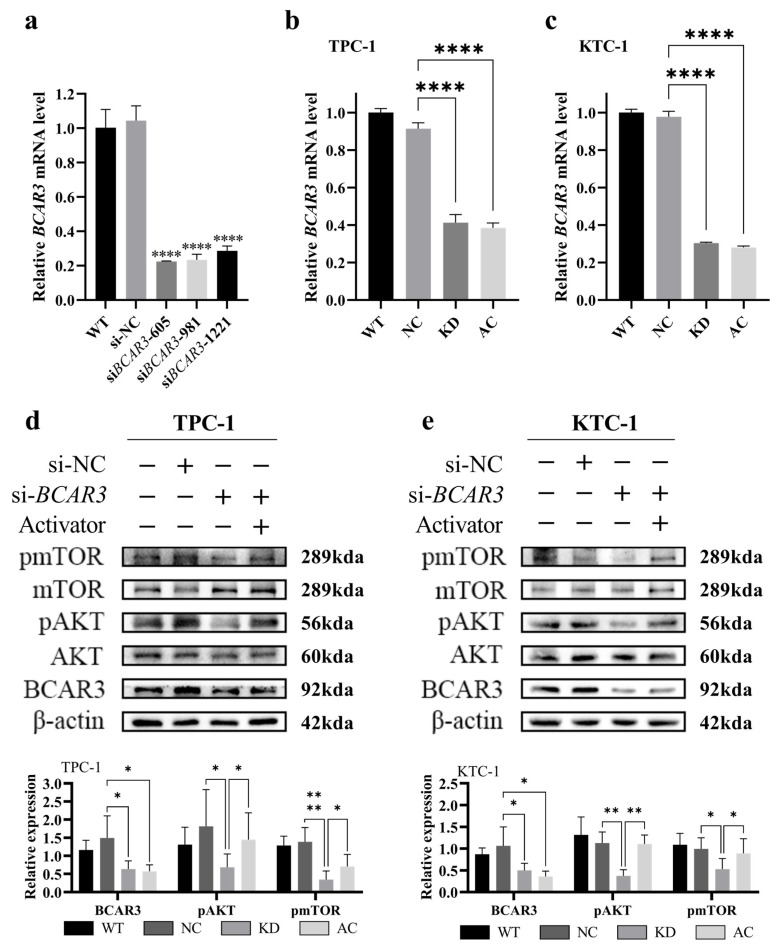 Figure 4
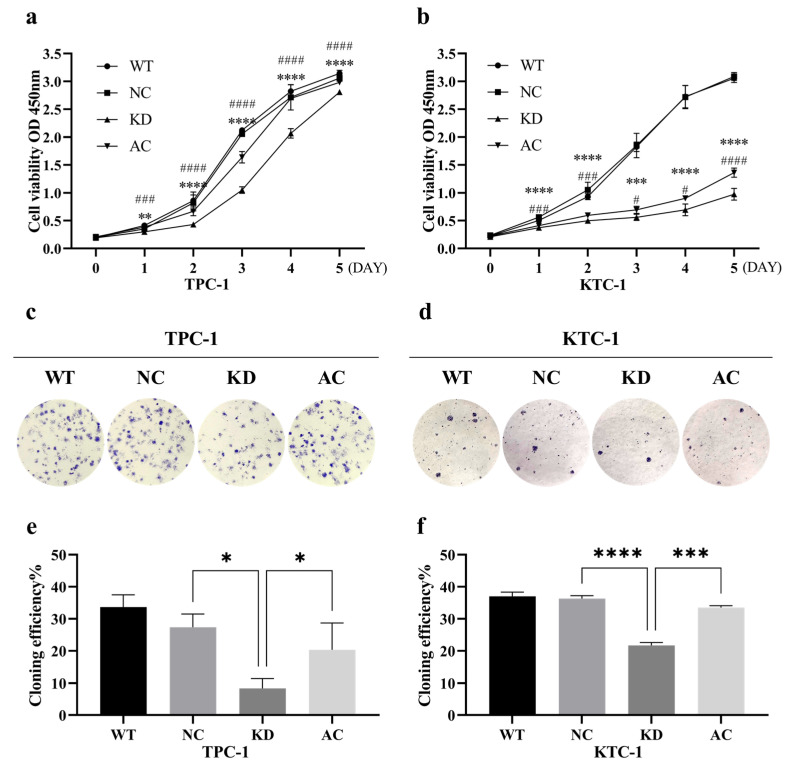 Figure 5
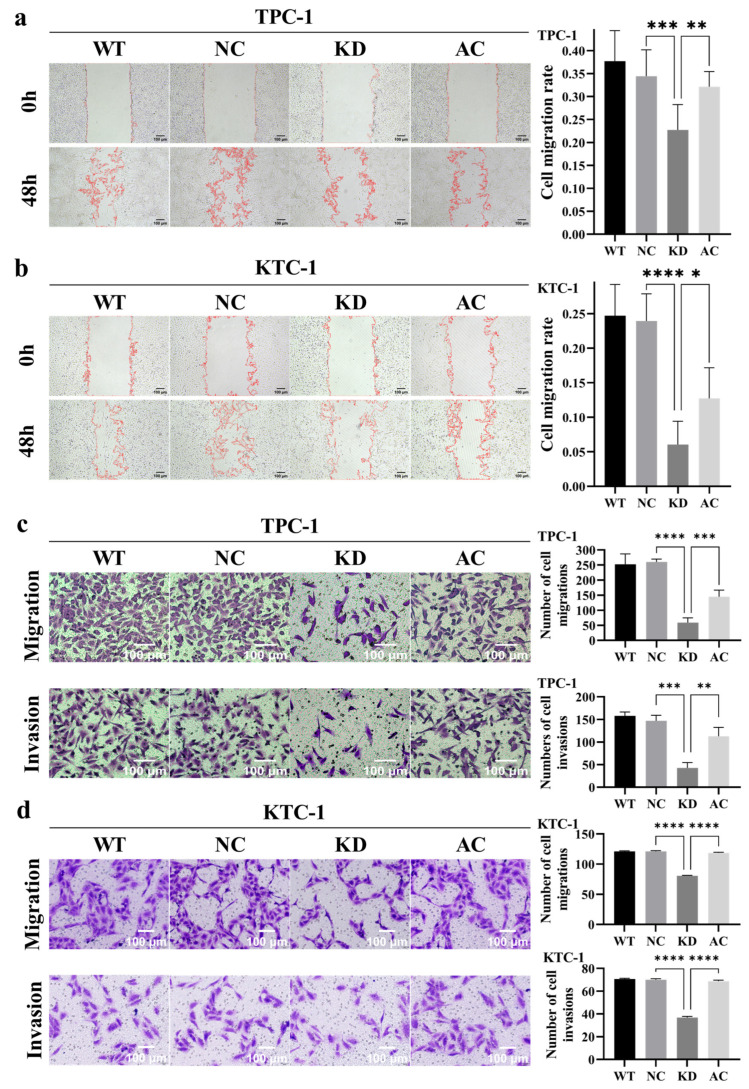 Figure 6
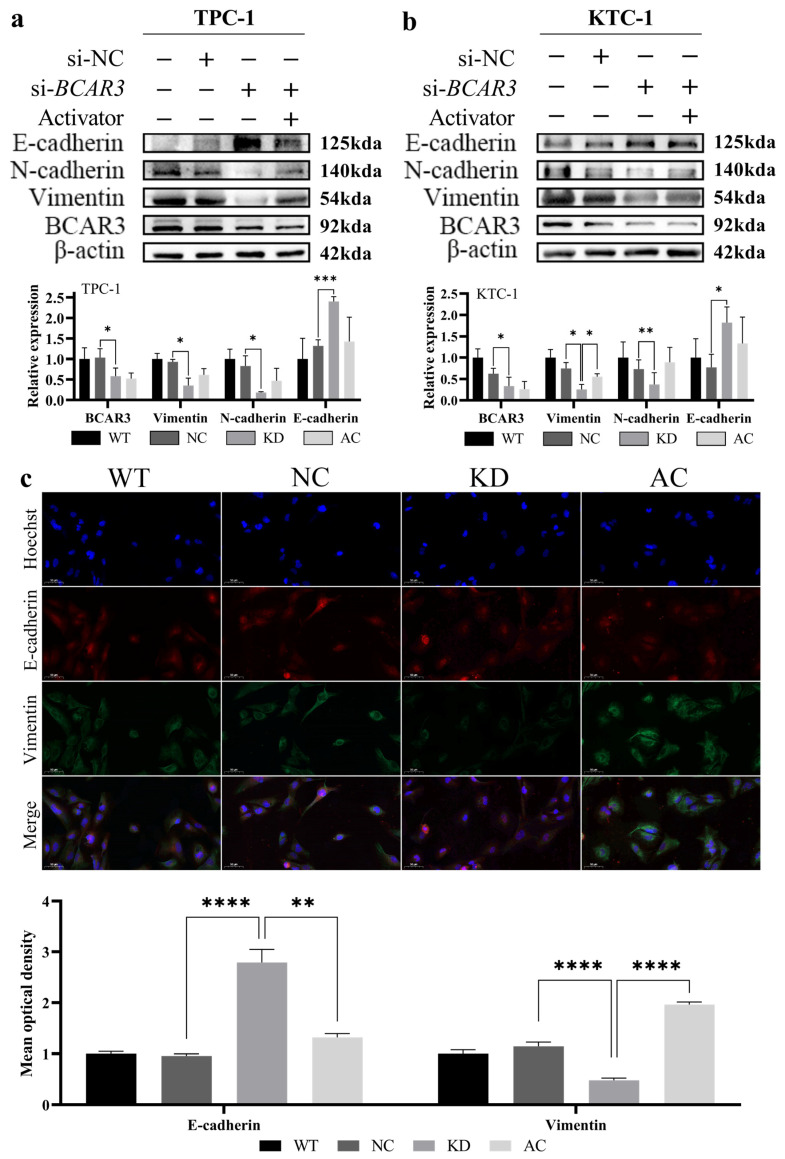 Figure 7
- —Nanjing Medical University
- —Natural Science Foundation of Huai’an
- —Wu Jieping Medical Foundation Special Fund for Tumor Targeted Research
Peer Reviews
No public reviews on file for this paper yet. If you reviewed it on a platform where reviews are public (OpenReview, ICLR, NeurIPS, ICML), you can paste yours below so the community can read it here.
Videos
No videos yet. Explain this paper in a talk, walkthrough, or lecture? Add one.
Taxonomy
TopicsThyroid Cancer Diagnosis and Treatment · Wnt/β-catenin signaling in development and cancer · Cancer-related gene regulation
1. Introduction
Thyroid cancer (TC) represents the most common endocrine malignancy [1]. Its global incidence has risen steadily over the past few decades [2,3], Recent epidemiology shows that its prevalence in China has eclipsed that of many Western countries, making it a significant public health concern [4,5]. This trend establishes TC as a considerable public health issue and underscores the growing challenges in clinical decision-making [6].
Fine-needle aspiration biopsy (FNAB) serves as the primary diagnostic tool for the definitive evaluation of thyroid nodules [7]. While FNAB is a minimally invasive and highly effective method for distinguishing between benign and malignant nodules, it is not without limitations. The diagnostic accuracy of FNAB may be compromised by indeterminate results, which occur in 20–30% of cases and are classified within the Bethesda system as categories III–IV [8]. These indeterminate results can lead to diagnostic uncertainty, requiring additional invasive procedures or even surgery, thereby increasing patient anxiety and healthcare costs [9]. To address these limitations, molecular testing has emerged as a valuable adjunct, enabling more precise differentiation between benign and malignant thyroid nodules through the analysis of mutations in genes. Yet these molecular markers have inherent limitations: lack sufficient sensitivity (BRAF) [10], compromise specificity due to presence in both benign and malignant lesions (RAS) [11], or too rare for routine diagnostic use (TERT) [12]. Therefore, there is an urgent clinical need for more robust and standardized diagnostic biomarkers. The identification of such markers is crucial not only for accurate diagnosis but also for guiding personalized therapeutic strategies [13,14].
DNA methylation is a fundamental and widespread epigenetic mechanism that regulates gene expression in living organisms [15]. Numerous studies have confirmed that changes in DNA methylation are early and frequent events in the development of cancer [16]. The stability of the DNA methylation process allows for quantitative analysis, with simple sample processing, reliable detection methods, low detection dosage, and excellent reproducibility [17]. In TC, both global hypomethylation and site-specific hypermethylation events have been observed, indicating the significant role of epigenetic alterations in this malignancy [18]. Given the critical role of DNA methylation in gene regulation and its early involvement in carcinogenesis, methylation markers are emerging as promising diagnostic and prognostic tools, offering valuable insights into tumor behavior and patient outcomes in TC.
The BCAR3 (Breast Cancer Anti-Estrogen Resistance 3) gene was initially identified in breast cancer, where it plays a role in anti-estrogen resistance [19]. The BCAR3 protein contains an N-terminal Src-homology 2 (SH2)-like domain, which enables it to interact with tyrosine-phosphorylated residues on various signaling proteins, including Src family kinases [20,21]. Through interaction with p130Cas (BCAR1), a key adaptor protein involved in focal adhesion dynamics, BCAR3 facilitating tumor cell migration, invasion, and adhesion disassembly [22,23,24,25]. Additionally, BCAR3 has been implicated in the activation of the AKT/mTOR signaling pathway, promoting cancer cell proliferation and survival [26]. Notably, emerging evidence suggests that BCAR3 may promote epithelial–mesenchymal transition (EMT), a critical process in cancer metastasis [27,28]. Recent studies have reported aberrant BCAR3 expression in multiple malignancies, suggesting its potential role in oncogenesis [29,30]. Our pilot study on 7 TC and 11 benign thyroid nodules (BTNs) using Illumina 850K assay and RNA-seq showed differential methylation and expression in BCAR3 (Figure S1), which was not reported in TC previously. Here we investigate the methylation status of BCAR3 in thyroid tumors in a substantial clinical cohort and evaluate its potential as a diagnostic biomarker, while also exploring the functional consequences of BCAR3 dysregulation in TC. While DNA methylation alterations frequently contribute to gene dysregulation in cancer, the relationship between BCAR3 methylation and cancer remains poorly characterized. Here we investigate the methylation status of BCAR3 in thyroid tumors and evaluate its potential as a diagnostic biomarker, while also exploring the functional consequences of BCAR3 dysregulation in TC.
2. Materials and Methods
2.1. Study Design and Patients
This study included a total of 793 patients from three participating medical centers: Huai’an Hospital of Xuzhou Medical University (Center I, 169 BTNs and 136 TC cases), the Affiliated Hospital of Nantong University (Center II, 173 BTNs and 233 TC cases), and Jiangsu Province Hospital of Chinese Medicine (29 BTNs and 65 TC cases). The cohort comprised 371 BTN cases and 422 TC cases. Baseline characteristics of the study participants from Center I and Center II are summarized in Table 1, while the complete characteristics of all included subjects are provided in Table S1. All diagnoses were confirmed by two independent pathologists according to the eighth edition of the American Joint Committee on Cancer (AJCC) Staging System. Formalin-fixed paraffin-embedded (FFPE) samples were collected prior to any treatment. This retrospective study was conducted in accordance with the Declaration of Helsinki and was approved by the Institutional Review Boards of Nanjing Medical University (protocol code [2020] 528) and the Medical Ethics Committee of Huai’an Second People’s Hospital (protocol code HEYLL202315). Informed consent was obtained from all participants.
2.2. Methylation Analysis by MALDI-TOF Mass Spectrometry
The CpG sites within the BCAR3 gene were selected based on two criteria: (1) annotation in the Genome Browser (University of California, Santa Cruz (UCSC), build GRCh38/hg38); and (2) location within the predicted promoter-like signature region. The CpG site designated as cg10546447 was selected for further investigation. Subsequently, an amplicon of 140 base pairs and within the promoter region was designed to encompass cg10546447 (referred to as CpG_2 in the amplicon) and five quantifiable flanking CpG sites for mass spectrometry analyses (Table S2). CpG_2.3.4.5 represents the four CpG sites located within the same fragment, and their methylation levels are presented as an average. Schematic of the BCAR3 amplicon for methylation analysis is shown in Figure S2.
DNA methylation levels were assessed by semiquantitative analysis using the Agena MassARRAY system (Agena Bioscience, San Diego, CA, USA), which is based on MALDI-TOF mass spectrometry, following a previously established protocol [31]. Briefly, PCR amplification was carried out using bisulfite-converted DNA, followed by shrimp alkaline phosphatase treatment and T-cleavage reaction. The products were dispensed onto a 384 SpectroCHIP and analyzed using a MassARRAY system (Agena Bioscience). Methylation ratios were generated using EpiTyper v1.3 software. The reliability and accuracy of the matrix-assisted laser desorption/ionization–time-of-flight (MALDI-TOF) MS platform (EpiTyper) for DNA methylation quantification have been demonstrated in a large-scale benchmarking study, which showed it performs with high accuracy and excellent concordance with bisulfite sequencing and pyrosequencing [32]. In addition, our MALDI-TOF MS data was replicated by Illumina 850K (Illumina, San Diego, CA, USA) showing similar methylation levels with the same 7 TC and 11 BTN samples (Figure S3).
2.3. Immunohistochemistry (IHC)
FFPE sections (4-μm) were deparaffinized, rehydrated, and subject to antigen-retrieved in citrate buffer (pH 6.0). After peroxidase blocking with 3% H_2_O_2_, sections were incubated with 5% BSA and then with anti-BCAR3 antibody (1:100, Abmart, TD3048, Shanghai, China) at 4 °C overnight. Detection was performed with an HRP-conjugated secondary antibody, followed by DAB development and hematoxylin counterstaining. Protein expression was quantified using a color deconvolution algorithm in ImageJ (Fiji, version 1.54p) to isolate the DAB channel. Two independent pathologists, blinded to the clinical data and working in consensus, first defined the region of interest (ROI) around tumor cells. A consistent intensity threshold for positive signal was pre-determined on a set of training images and applied uniformly to all subsequent analyses. The percentage of positive cells was automatically calculated by the software within each ROI. Inter-observer agreement was assessed across all samples, demonstrating unanimous agreement in 94.4%.
2.4. Cell Culture and Transfection
All Human thyroid cell lines (KTC-1, TPC-1, and Nthy-ori3-1) were obtained from the Chinese Academy of Sciences (Shanghai, China), and routinely maintained in complete RPMI 1640 (10% FBS) at 37 °C and 5% CO_2_. Gene silencing was achieved by transfecting cells with BCAR3-specific siRNA or a control siRNA using Lipofectamine 3000 (Thermofisher, L3000075, Shanghai, China). The sequences of all siRNA constructs used are provided in Table S3. Knockdown efficiency and phenotypic effects were verified for all three siRNAs. The most efficient siRNA (siBCAR3-605, GenePharma, Suzhou, China) was selected for subsequent functional and rescue experiments. For rescue experiments, cells were treated with 10 μM PI3K activator 1,3-dicaffeoylquinic acid (MCE, HY-N1412, Shanghai, China) [33,34].
2.5. RNA Extraction and Quantitative PCR
Total RNA was isolated from cells using Trizol extraction kit (Invitrogen, 15596018, Shanghai, China), reverse-transcribed, and quantified using SYBR Green mix (Vazyme, R222-01, Nanjing, China) on an ABI 7500 system. Gene expression levels were normalized to GAPDH as an internal control, and relative quantification was determined via the 2^−ΔΔCT^ method. All primer sequences are provided in Table S4.
2.6. Western Blot
Total protein was extracted from cells using RIPA lysis buffer (Beyotime, P0013B, Shanghai, China) supplemented with 1% protease inhibitors (RUIBIO, BP2655, Guangzhou, China). Protein concentration was quantified with a BCA assay kit (Biosharp, BL521A, Hefei, China). Subsequently, equal amounts of protein (25 μg) were electrophoretically resolved on 10% SDS-PAGE gels and transferred onto PVDF membranes (Millipore, IPVH00010, Shanghai, China). The membranes were blocked with 5% non-fat milk and then probed with primary antibodies at 4 °C overnight (anti-BCAR3, 1:1000, Abmart, TD30488, Shanghai, China; anti-GAPDH, 1:10,000, Proteintech, 60004-1-Ig, Wuhan, China; anti-β-actin, 1:5000, Proteintech, 66009-1-Ig; anti-Vimentin, 1:2000, Abclonal, A19607, Wuhan, China; anti E-cadherin, 1:20,000, Proteintech, 20874-1-AP; anti-N-cadherin, 1:1000, Abmart, T55015; anti-AKT, 1:5000, Abclonal, A18675; anti-pAKT, 1:1000, Abclonal, AP1068; anti-mTOR, 1:5000, Proteintech, 66888-1-Ig; anti-pmTOR, 1:2000, Proteintech, 67778-1-Ig), followed by HRP-conjugated secondary antibodies (HRP-Goat Anti-Mouse IgG, 1:5000, Proteintech, RGAM001; HRP-Goat Anti-Rabbit IgG, 1:5000, Proteintech, RGAR001) at 37 °C for 1 h. Signals were detected using ECL reagent (Vazyme, E423), and band densities were quantified using ImageJ software (Fiji, version 1.54p).
2.7. Cell Function Assays
2.7.1. Cell Viability Assay
Cell viability was measured daily from Day 0 to Day 5 using the CCK-8 assay in 96 well plates. In Day 0, cells were seed in six 96 well plates: four experimental group in each plate, and each group were replicated in 6 parallel wells with 5 × 10^3^ cells in each well. From Day 0 on, one 96 well plate was measured by the CCK-8 assay every 24 h, till Day 5. For each measurement, 10 μL of CCK-8 solution was added to the well, followed by 3 h’ incubation and the absorbance was measured at 450 nm. The Statistical comparisons between groups at each time point were performed on the raw OD values using unpaired t-tests.
2.7.2. Colony Formation Assay
Cells were seeded in 6-well plates (200 cells/well) and cultured for 2 weeks. The resulting colonies were fixed with 4% paraformaldehyde, stained with 0.1% crystal violet, and counted. The cloning efficiency was calculated for each group using the formula: (numbers of colonies/number of cells seeded) × 100%.
2.7.3. Wound Healing Assay
Cells were cultured in 6-well plates until confluent (10% FBS). Then, three parallel scratches were created by pipette tips per well, and the medium for cell culture were changed to low-serum (1% FBS). Wound areas were imaged at 0 and 48 h under a phase-contrast microscope. The cell migration rate was quantified using ImageJ software and calculated as: (Wound Area at 0 h–Wound Area at 48 h)/Wound Area at 0 h × 100%, with normalization to the 0-h time point of each experimental group. Data are presented as the cell migration rate.
2.7.4. Transwell Migration and Invasion Assay
Cell migration and invasion were assessed using 24-well Transwell chambers. For invasion assays, chambers were pre-coated with Matrigel (1:8 dilution); uncoated chambers were used for migration. Cells (3 × 10^5^ in serum-free medium) were seeded into the upper chamber, with complete medium as a chemo-attractant in the lower chamber. After 24 h, cells on the upper surface were removed, and cells that migrated to the lower surface were fixed and stained with 0.1% crystal violet. The number of invaded cells was determined by counting the stained cells in three random microscopic fields. The average count per field for each experimental group was then directly compared for statistical analysis using the unpaired t-test.
2.8. Immunofluorescence Staining (IF)
Cells were subjected to fixation with 4% paraformaldehyde and permeabilization with 0.1% Triton X-100 (Beyotime, P0096), followed by blocking with 5% FBS. Samples were incubated overnight at 4 °C, with primary antibodies against E-cadherin (1:100, Abcam, Ab40772, Shanghai, China) and Vimentin (1:500, Abclonal, A19607). After washing, the samples were probed with Cy3- or FITC-conjugated secondary antibodies (Cy3–conjugated Affinipure Goat Anti-Rabbit, Proteintech, SA00009-2; FITC–conjugated Affinipure Goat, Proteintech, SA00003-1). Nuclei were counterstained with Hoechst dye (Beyotime, C1017) dye for 15 min at room temperature in the dark. Finally, images were captured using a fluorescence microscope.
2.9. Statistical Analyses
Continuous variables are summarized as median with interquartile range (IQR). Group differences in BCAR3 methylation levels were analyzed using the Mann–Whitney U test for two-group comparisons and the Kruskal–Walli’s test for multi-group comparisons. Where the Kruskal–Walli’s test was significant, post hoc pairwise testing was performed using the Dunn’s test, and p values were adjusted by the Bonferroni method (multiplying the raw p value by the number of comparisons, n = 3). All statistical analyses were conducted using SPSS (version 28.0; IBM Corp., Armonk, NY, USA).
3. Results
3.1. BCAR3 Hypomethylation in TC Cases Compared to BTN Subjects
We compared the methylation levels between the TC cases and subjects with benign thyroid nodules using a logistic regression model adjusted for age and sex, and found that the methylation levels of all six CpG loci in BCAR3 amplicon were significantly lower in the TC group than in the BTN group. Specifically, the methylation values for CpG_1, CpG_2.3.4.5, and CpG_6 in TC were 0.65, 0.65, and 0.81, respectively, compared to 0.78, 0.74, and 0.92 in BTN (Table 2). Furthermore, our analysis revealed a significant association between BCAR3 hypomethylation and TC. After adjusting for age and sex, the odds ratios (ORs) per 10% reduction in methylation for all CpG sites were 1.68 for CpG_1, 1.54 for CpG_2.3.4.5, and 1.73 for CpG_6, indicating an increased risk of TC (95% CI: 1.51–1.86, 1.39–1.70, 1.53–1.96 respectively; all p < 0.001 after Bonferroni adjustment; Table 2). This association was consistently observed in both participating centers, with Center I showing ORs ranging from 1.40 to 1.53 and Center II from 1.55 to 1.87 per 10% reduction in methylation (all adjusted p < 0.001; Table S5). To evaluate the diagnostic potential of BCAR3 methylation, we performed ROC analysis. The overall model achieved an area under the curve (AUC) of 0.75 (95% CI: 0.71–0.78), with a sensitivity of 63.2% and a specificity of 59.8% referred to the maximum likelihood estimation. This diagnostic performance was consistently observed in both independent case–control populations, with Center I achieving an AUC of 0.73 (sensitivity 81.3%, specificity 59.8%) and Center II an AUC of 0.76 (sensitivity 67.5%, specificity 76.7%) (Figure 1).
We further evaluated the correlation between BCAR3 methylation levels and key clinical characteristics in TC patients. Hypomethylation of BCAR3 was enhanced in TC with aggressive clinicopathological features. Lower methylation levels at CpG_1 and CpG_6 were observed in TCs with larger tumor sizes (T2–4) and with involved lymph nodes compared to the one with T1 tumors and without lymph nodes involvement (all p < 0.01, Table 3). Notably, the methylation levels of all six BCAR3 CpG sites decreased significantly with increasing tumor stage (p ≤ 0.006), and showed the lowest methylation in Stage III-IV diseases (Table 3). Analysis of BCAR3 methylation across thyroid tumor subtypes revealed distinct patterns. No significant differences were observed among the three benign subtypes (adenoma, goiter, and thyroiditis) or between any benign subtype and anaplastic thyroid cancer (ATC) in pairwise comparisons (all p > 0.05). Papillary (PTC) and follicular thyroid carcinomas (FTC) exhibited similar methylation levels (PTC vs. FTC, p > 0.05), but were both significantly low than BTNs (all p < 0.005). Notably, medullary thyroid carcinoma (MTC) showed the lowest methylation values among all subtypes, with a reduction of approximately 35% to 48% compared to PTC and FTC (all Bonferroni-adjusted p < 0.05; Figure 2, Table S6).
3.2. BCAR3 Highly Expressed in Cancerous Thyroid Tissues and Cells
Next, we examined the expression of BCAR3 in TC using thyroid tissue sections from TC cases and BTN subject. Compared to BTN, TC tissues exhibited significantly stronger immunohistochemical staining for BCAR3 (p < 0.001; Figure 3a,b). BCAR3 methylation levels in cell lines mirrored the results of that in tissues: five of the six CpG sites at BCAR3 promotor region hypomethylated in two TC cell lines (TPC-1 and KTC-1) compared to the normal thyroid cell line (Nthy-ori 3-1) (p < 0.05 for CpG_1 and CpG_2.3.4.5; Figure 3c). Consistently, quantitative PCR revealed a significant upregulation of BCAR3 mRNA levels in two TC cell lines compared to the normal thyroid cell line (p < 0.05; Figure 3d), while Western blot analysis confirmed a marked increase in BCAR3 protein expression in two TC cell lines compared to normal thyroid cell line (p < 0.05; Figure 3e,f).
3.3. Downregulation of BCAR3 Suppressed the Proliferation, Invasion and Migration of Thyroid Cancerous Cells via Regulating AKT/mTOR Pathway
We next aimed to investigate the role of upregulated BCAR3 in TC development by knocking down BCAR3 in cell lines using siRNA. The knockdown efficiency was examined by quantitative real-time PCR. As shown in Figure 4a, three siRNA sequence (siBCAR3-605, siBCAR3-981 and siBCAR3-1221) showed efficient knock down of BCAR3 in KTC-1 cell line, and the best performed siBCAR3-605 was selected for subsequent studies.
To explore the potential function of BCAR3 and its role in the PI3K/AKT signaling pathway in TC, we conducted experiments involving BCAR3 knockdown alone (KD group) and in combination with 1,3-dicaffeoylquinic acid, a PI3K activator (AC group). BCAR3 was successfully downregulated in both TPC-1 and KTC-1 cell lines across the KD and AC groups when compared to the negative control (NC groups) (p < 0.001, KD vs. NC, AC vs. KD; Figure 4b,c). Western blot analysis indicated that BCAR3 knockdown significantly reduced the phosphorylation of AKT and mTOR in both cell lines (p < 0.05, KD vs. NC; Figure 4d,e).
Both the CCK-8 cell proliferation assay and the clonogenic assay revealed that silencing BCAR3 significantly inhibited the proliferation in both TPC-1 and KTC-1 cell lines when compared to the NC groups (p < 0.05; Figure 5). Additionally, wound healing assays showed that the wound closure rate in the BCAR3 KD group was significantly lower than that in the wild-type (WT) and NC groups in both cell lines (p < 0.05; Figure 6a,b). Moreover, BCAR3 knockdown led to a significant reduction in both cell migration and invasion (p < 0.001; Figure 6c,d).
Furthermore, the activation of the PI3K/AKT pathway in BCAR3 knockdown cells using 1,3-dicaffeoylquinic acid partially but significantly restored cell proliferation, migration, and invasion, thereby partially reversing the effects of BCAR3 knockdown (p < 0.05 AC vs. KD; Figure 5 and Figure 6). However, the restored levels remained statistically lower than those in the WT and NC groups, indicating a partial functional rescue.
Importantly, the inhibitory effects on cell proliferation, migration, and invasion were consistently observed not only with the selected siBCAR3-605 but also with the two additional siRNAs (siBCAR3-981 and siBCAR3-1221), confirming the specificity of these phenotypes to BCAR3 knockdown (Figures S4 and S5).
3.4. BCAR3 Promotes the Invasion of Thyroid Cancerous Cell Through EMT
We subsequently investigate the involvement of EMT, a pivotal mechanism in cancer metastasis, in the regulation of invasion and migration by BCAR3 in TC. Western blot analysis of EMT markers revealed that silencing BCAR3 significantly elevated E-cadherin expression while reducing levels of Vimentin and N-cadherin in both TPC-1 and KTC-1 cell lines (p < 0.05, KD vs. NC; Figure 7a,b). To further validate BCAR3’s role in EMT, we performed immunofluorescence staining in KTC-1 cells, which confirmed a marked increase in E-cadherin and a concurrent decrease in Vimentin upon BCAR3 knockdown (p < 0.001, KD vs. NC; Figure 7c). These findings indicate that BCAR3 knockdown altered the expression of EMT markers, which may be linked to its effects on cell proliferation, migration, and invasion. Moreover, activation of the PI3K/AKT pathway via 1,3-dicaffeoylquinic acid significantly attenuated the impact of BCAR3 knockdown on EMT markers, as evidenced by decreased E-cadherin and increased Vimentin expression in the AC group compared to the KD group (p < 0.001, AC vs. KD; Figure 7). Notably, the expression levels of these markers in the AC group were intermediate between the KD and NC groups, consistent with a partial reversal of the EMT phenotype.
4. Discussion
The increasing detection of thyroid nodules and the overlap in clinical characteristics between benign and malignant nodules underscore the need for efficient, objective molecular markers to improve diagnosis and management [35]. Altered DNA methylation represents a significant event in cancer development and progression [16]. The straightforward detection of tissue DNA methylation levels in pathological biopsy samples at a low cost makes it feasible for DNA methylation to be used in clinical diagnosis or as a companion diagnostic tool [36,37]. In this study, we identified significant hypomethylation at six CpG sites in the 5′-UTR region of the BCAR3 gene in TC samples compared to BTN samples. Logistic regression analysis further indicated that BCAR3 hypomethylation is associated with an increased risk of TC. Although CpG_1 of this BCAR3 amplicon is overlapped with rs11164983 (G-A), it presented similar OR comparing the TCs and BTNs as the other 5 CpG sites, suggesting the frequency of this SNP may have no significant difference between TC and BTN groups. Nevertheless, future studies should be cautions to the potential influence of SNPs via either avoiding SNP overlapped CpG sites or examining the frequency of SNPs in parallel. We also investigated the methylation status of the BCAR3 in the Illumina 450K array based Cancer Genome Atlas (TCGA) thyroid cancer (THCA) dataset, and found available data for only one CpG site (cg04258676) in the 1kb flanking region of the analyzed amplicon (Figure S6a). It is noteworthy that the slightly opposite hypermethylation of cg04258676 in TC than the adjacent normal tissue (p = 0.083, Figure S6b) showed the regional specific DNA methylation regulation as has been reported in our previous studies [38,39,40], where different CpG sites/region within the same gene can present variant diseased related methylation patterns, and thus, could be moderated by distinct regulatory elements (e.g., enhancers, transcription factors) leading to divergent patterns in diseases [41]. Moreover, the observed correlation between progressive hypomethylation and aggressive clinicopathological features, including larger tumor size, lymph node metastasis, and advanced tumor stage, suggests that BCAR3 may play a role in tumor aggressiveness. Differed from our previously reported lowest gene methylation in ATC [42], current study found the lowest BCAR3 methylation detected in MTC. While subtyping PTC is relatively straightforward in surgical specimens, its accuracy is still limited when based solely on cytology [43,44]. Although the rare TC subtypes are limited at sample size, our study still highlighted the potential of methylation profiles may assist the traditional strategy to improve the diagnosis and classification of variant TC subtypes. Since PTC attribute to more than 90% of TCs, future multi-center collaborations are needed to accumulate larger series for the investigation and validation of subtype-specific methylation as well as its clinical application. Meanwhile, the TC and subtype specific methylation could provide novel insight into the initiation and progression of cancer, the biological mechanism for these methylation genes or epigenetic driving force would be meaningful to explore. Collectively, our results suggest that BCAR3 hypomethylation may serve as a diagnostic biomarker, though further validation in larger, prospective cohorts is necessary for potential translational applications. Future studies combining the overexpression of BCAR3 as well as multiple markers may further improve diagnostic accuracy.
The regulation of gene expression by DNA methylation is well-established [45]. In our study, we suggest that the upregulation of BCAR3 in TC may be regulated by epigenetic mechanisms, particularly promoter hypomethylation—a well-known process in oncogene activation [46,47]. Our methylation analysis showed hypomethylation in TC tissues, which was consistent with increased BCAR3 protein expression, as confirmed by immunohistochemistry. This is in line with findings in other malignancies, such as breast cancer and head and neck cancer, where BCAR3 has been implicated in tumor progression [27,48]. Notably, we observed that the changes in BCAR3 methylation and protein expression at the tissue level were mirrored at the cellular level. This series of experiments supports the hypothesis that methylation-driven BCAR3 expression plays a key role in thyroid carcinogenesis. It is also important to note that no methylation editing experiments (e.g., using dCas9-DNMT3A or dCas9-TET1 tools) or luciferase reporter assays were performed in our study to prove the causally link between methylation to BCAR3 and expression. Such experiments should be considered in the future for the better understanding of mechanism of methylation.
Our phenotypic studies further revealed that BCAR3 knockdown in TPC-1 and KTC-1 cells significantly reduced cellular proliferation, migration, invasion, and colony formation, underscoring its critical role in promoting aggressive tumor behavior. Additionally, silencing BCAR3 led to the downregulation of mesenchymal markers, such as Vimentin and N-cadherin, along with upregulating the epithelial marker E-cadherin, reinforcing BCAR3’s role as a key regulator of EMT in TC. EMT is a key process in tumor progression, enabling epithelial cells to acquire a mesenchymal phenotype that enhances migration, invasion, and resistance to therapy [49,50]. This process is observed in various cancers, including TC [51,52,53]. The reversal of EMT markers upon BCAR3 depletion suggests its involvement in modulating cytoskeletal dynamics and cell adhesion, thereby facilitating tumor cell invasion and potentially metastasis.
Beyond its role in EMT, BCAR3 promotes tumor progression through the activation of multiple signaling pathways. Structurally, BCAR3 contains an N-terminal SH2-like domain, allowing interactions with phosphorylated tyrosine residues, and a C-terminal RasGEF-like domain, which lacks classical GEF activity [24,26,54]. Instead, BCAR3 binds BCAR1 at the C-terminus, forming a complex that recruits and activates Src kinase, leading to BCAR1 phosphorylation and downstream signaling activation [30,54,55]. Our results showed that BCAR3 knockdown reduced pAKT and pmTOR levels, suggesting that BCAR3 promotes PI3K/AKT/mTOR signaling. Given that Src activation is an upstream driver of AKT phosphorylation, the BCAR3-BCAR1-Src complex likely facilitates this pathway in TC. Due to the unavailability of fresh-frozen tissue for optimal phospho-protein analysis, our study is limited by the absence of pAKT and pmTOR level assessment in the patient cohorts. Such validation in tissue should be considered in future studies. Although the PI3K activator (1,3-dicaffeoylquinic acid) successfully rescued the phenotypic effects of BCAR3 knockdown, supporting the involvement of the PI3K/AKT pathway, we note that the use of a single activator is a limitation. Future studies employing alternative or more specific PI3K/AKT pathway modulators would be valuable to further confirm the specificity of the observed effects and rule out potential off-target actions. It is also noteworthy that PI3K/AKT pathway activation only partially rescued the phenotypic consequences of BCAR3 knockdown, suggesting the involvement of additional signaling mechanisms. As a multi-domain adaptor protein, BCAR3 may engage other key signaling nodes beyond PI3K/AKT, such as the MAPK/ERK or TGF-β/SMAD pathways, which could collectively contribute to its oncogenic functions [21,56]. Furthermore, BCAR3 depletion reversed EMT in TC cells, highlighting the importance of Src/AKT/mTOR signaling in driving aggressive tumor phenotypes. These findings position BCAR3 as a regulator of invasive capabilities and tumor progression in TC and a potential candidate for therapeutic targeting, a concept that will require future functional validation in vivo. Furthermore, while our data support BCAR3’s role in tumor progression, future gain-of-function experiments through BCAR3 overexpression would be valuable to definitively establish causality and further strengthen our conclusions.
5. Conclusions
In conclusion, this study associates BCAR3 hypomethylation with TC progression, potentially through its regulation of the AKT/mTOR pathway and EMT progress. BCAR3 knockdown was found to suppress multiple malignant behaviors in vitro, highlighting its significant role in thyroid cancer pathogenesis. These findings suggest BCAR3 methylation status as a potential diagnostic biomarker and indicate BCAR3 as a possible therapeutic target worthy of further investigation.
The reference list from the paper itself. Each links out to its DOI / PubMed record.
- 1Chen D.W. Lang B.H.H. Mc Leod D.S.A. Newbold K. Haymart M.R. Thyroid cancer Lancet 20234011531154410.1016/S 0140-6736(23)00020-X 37023783 · doi ↗ · pubmed ↗
- 2Kim J.S. Kim B.G. Stybayeva G. Hwang S.H. Diagnostic Performance of Various Ultrasound Risk Stratification Systems for Benign and Malignant Thyroid Nodules: A Meta-Analysis Cancers 20231542410.3390/cancers 1502042436672373 PMC 9857194 · doi ↗ · pubmed ↗
- 3Ying T. Wang X. Yao Y. Yuan J. Chen S. Wen L. Chen Z. Wang X. Luo C. Sheng J. Integrative Methylome and Transcriptome Characterization Identifies SERINC 2 as a Tumor-Driven Gene for Papillary Thyroid Carcinoma Cancers 20221524310.3390/cancers 1501024336612238 PMC 9818177 · doi ↗ · pubmed ↗
- 4Chen W. Zheng R. Baade P.D. Zhang S. Zeng H. Bray F. Jemal A. Yu X.Q. He J. Cancer statistics in China, 2015 CA A Cancer J. Clin.20166611513210.3322/caac.2133826808342 · doi ↗ · pubmed ↗
- 5Wang J. Yu F. Shang Y. Ping Z. Liu L. Thyroid cancer: Incidence and mortality trends in China, 2005–2015 Endocrine 20206816317310.1007/s 12020-020-02207-632002755 · doi ↗ · pubmed ↗
- 6Li G. Li R. Zhong J. Chen W. Shuai J. Chen M. Deng F. Wei T. Tang H. Li Z. A multicenter cohort study of thyroidectomy-related decision regret in patients with low-risk papillary thyroid microcarcinoma Nat. Commun.202516231710.1038/s 41467-025-57627-740057484 PMC 11890561 · doi ↗ · pubmed ↗
- 7Alexander E.K. Doherty G.M. Barletta J.A. Management of thyroid nodules Lancet Diabetes Endocrinol.20221054054810.1016/S 2213-8587(22)00139-535752201 · doi ↗ · pubmed ↗
- 8Haugen B.R. Alexander E.K. Bible K.C. Doherty G.M. Mandel S.J. Nikiforov Y.E. Pacini F. Randolph G.W. Sawka A.M. Schlumberger M. 2015 American Thyroid Association Management Guidelines for Adult Patients with Thyroid Nodules and Differentiated Thyroid Cancer: The American Thyroid Association Guidelines Task Force on Thyroid Nodules and Differentiated Thyroid Cancer Thyroid Off. J. Am. Thyroid Assoc.201626113310.1089/thy.2015.002026462967 PMC 4739132 · doi ↗ · pubmed ↗