[18F]FDG PET/MRI in Endometrial Cancer: Prospective Evaluation of Preoperative Staging, Molecular Characterization and Prognostic Assessment
Carolina Bezzi, Gabriele Ironi, Tommaso Russo, Giorgio Candotti, Federico Fallanca, Carlotta Sabini, Ana Maria Samanes Gajate, Samuele Ghezzo, Alice Bergamini, Miriam Sant’Angelo, Luca Bocciolone, Giorgio Brembilla, Paola Scifo, GianLuca Taccagni, Onofrio Antonio Catalano

TL;DR
This study shows that [18F]FDG PET/MRI is highly accurate for staging endometrial cancer and predicting tumor aggressiveness and recurrence.
Contribution
Demonstrates the novel use of hybrid [18F]FDG PET/MRI for molecular characterization and risk stratification in endometrial cancer.
Findings
PET/MRI achieved 98.75% accuracy for primary tumor detection and 92.41% for lymph node detection.
PET/MRI parameters predicted molecular alterations like p53 abnormalities and MMR deficiency.
Tumor size and metabolic volume were linked to higher recurrence risk (p < 0.001).
Abstract
This prospective study evaluated the value of hybrid [18F]FDG PET/MRI in supporting risk stratification of endometrial cancer (EC). The cohort included 80 women with newly diagnosed EC, who underwent [18F]FDG PET/MRI before surgery and were followed for recurrence. PET/MRI showed excellent diagnostic accuracy for both primary tumor detection and lymph node assessment. Multiparametric PET/MRI features were analyzed and predicted several indicators of tumor aggressiveness such as the molecular alterations of p53 abnormalities and MMR deficiency recently introduced in the updated FIGO staging system and the clinical indicators of relapse risk and need for adjuvant therapy. Overall, PET/MRI demonstrated meaningful potential for predicting tumor behavior and improving risk stratification and personalized treatment planning in endometrial cancer patients. Background/Objectives: Early and…
Genes, proteins, chemicals, diseases, species, mutations and cell lines named across the full text — each resolved to its canonical identifier and authoritative record.
Click any figure to enlarge with its caption.
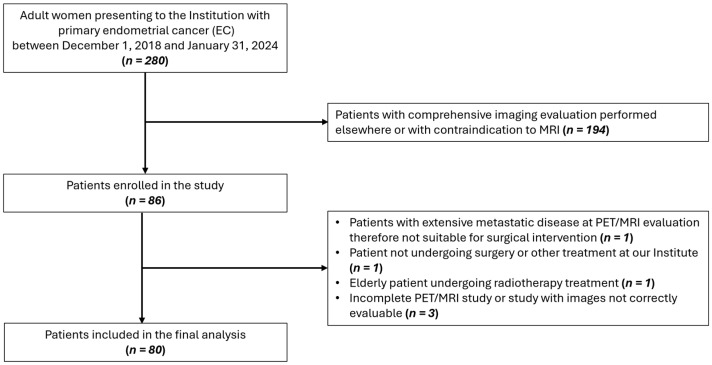 Figure 1
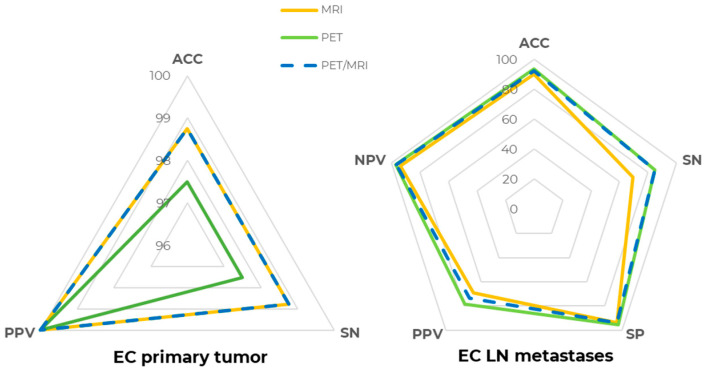 Figure 2
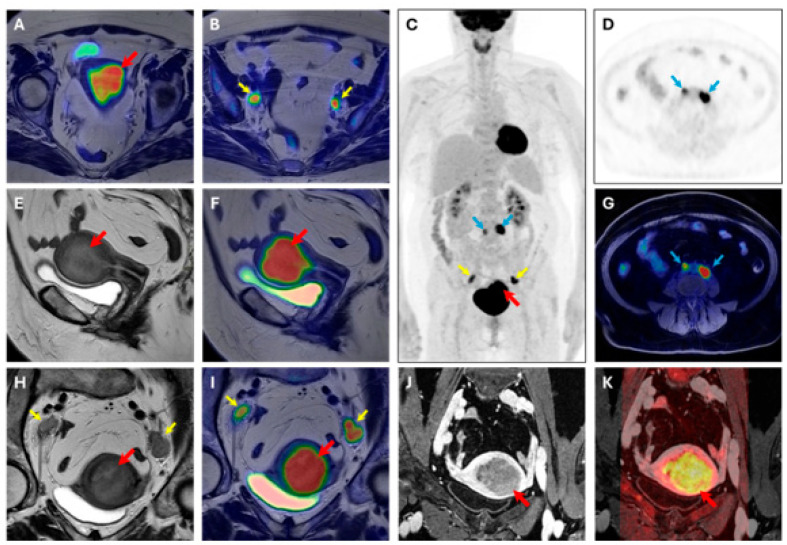 Figure 3
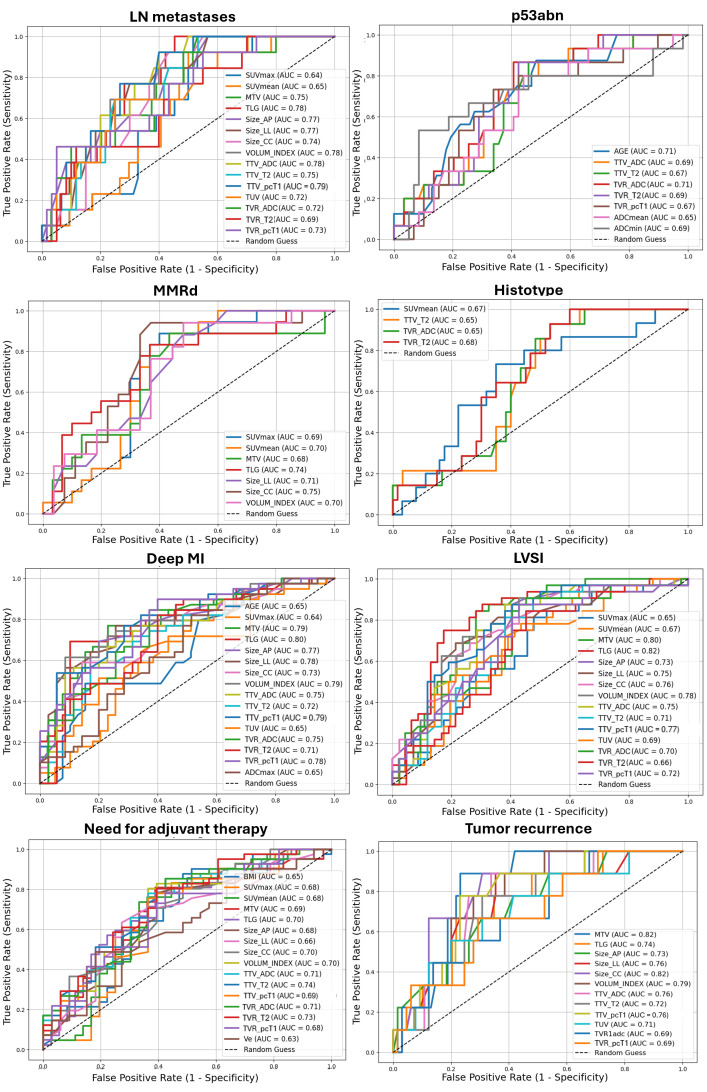 Figure 4
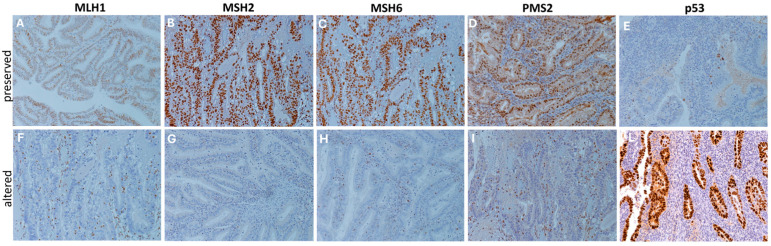 Figure 5
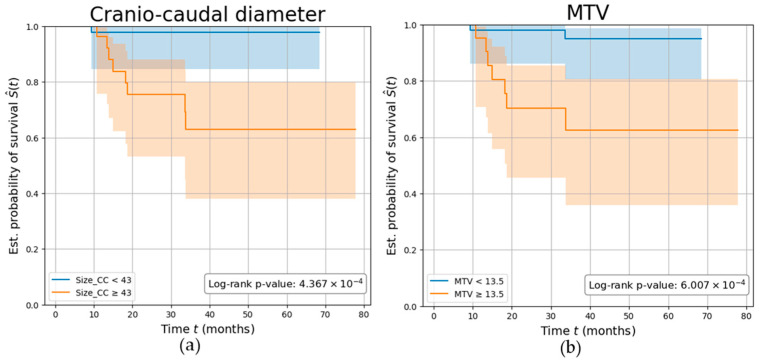 Figure 6
Peer Reviews
No public reviews on file for this paper yet. If you reviewed it on a platform where reviews are public (OpenReview, ICLR, NeurIPS, ICML), you can paste yours below so the community can read it here.
Videos
No videos yet. Explain this paper in a talk, walkthrough, or lecture? Add one.
Taxonomy
TopicsEndometrial and Cervical Cancer Treatments · Gynecological conditions and treatments · Endometriosis Research and Treatment
1. Introduction
Endometrial cancer (EC) ranks as the sixth most common cancer among women worldwide [1]. It is broadly classified into two types: type I, accounting for 85% of cases, predominantly includes grades 1 and 2 endometrioid adenocarcinomas (EEC); type II, which includes aggressive histological types, such as grade 3 EEC, typically associated with poorer prognoses [2]. Treatment includes surgery, radiation, chemotherapy, and hormonal therapy, with radical surgery and lymphadenectomy recommended for high-risk cases. However, clinical outcomes can differ even in patients with similar histological profiles, and the accurate selection of patients who might benefit from these treatments remains challenging.
Traditional prognostic factors include Federation of Gynecology and Obstetrics (FIGO) stage, histological type, depth of myometrial invasion (MI), lymph node (LN) metastases, infiltration pattern, and lymphovascular space invasion (LVSI) [3,4,5]. Moreover, many advancements in molecular profiling, driven by The Cancer Genome Atlas (TCGA) [6], have occurred since the 2009 FIGO staging, including the identification of four distinct EC molecular subtypes with significant prognostic value: POLE ultramutated, microsatellite instability hypermutated, copy number low, and copy number high subtypes. Therefore, an updated FIGO staging system was proposed in 2023 [7], in which molecular classification testing (POLE sequencing, MMR–immunohistochemistry (HIC), and p53-HIC) is strongly encouraged. However, these histological and molecular factors can only be assessed after surgery, with some factors available preoperatively through biopsy, which cannot fully capture tumor heterogeneity.
Imaging plays a crucial role in the assessment of EC. Transvaginal ultrasound, Magnetic Resonance Imaging (MRI), and Computed Tomography (CT) provide relevant morphological information. [^18^F]fluoro-deoxyglucose ([^18^F]FDG) Positron Emission Tomography (PET)/ CT is included in clinical guidelines for EC management and provides metabolic information, as shown in [8,9]. The introduction of hybrid PET/MRI scanners allows full integration of anatomical and metabolic information, reducing radiation exposure and providing multifunctional imaging biomarkers with relevant information on tumor behavior and underlying biological processes [10,11,12,13].
In the present study, we investigated the diagnostic accuracy of hybrid [^18^F]FDG PET/MRI for preoperative staging of endometrial cancer (EC), assessing both primary tumor and lymph node involvement. Additionally, we investigated its predictive role in identifying histological features of aggressiveness, molecular profiles, and recurrence, with the ultimate goal of enhancing treatment personalization.
2. Materials and Methods
2.1. Participants
In this prospective study (ClinicalTrials.gov ID: NCT04212910), 80 patients aged ≥18, with histological diagnosis of EC, no contraindication to preoperative [^18^F]FDG PET/MRI, and suitability for surgical intervention were enrolled between December 2018 and January 2024. A flow diagram showing participant selection is displayed in Figure 1. The study received approval from the Institution’s Ethics Committee and informed consent was obtained from all participants. Instrumental and clinical follow-up data were collected until February 2025. All procedures were carried out in accordance with the Declaration of Helsinki (1964) and its later amendments.
2.2. [18F]FDG PET/MRI Protocol
All scans were performed using a fully hybrid 3 T PET/MR system (SIGNA PET/MR; General Electric Healthcare, Waukesha, WI, USA), as described in [13]. Specifically, a simultaneous whole-body (WB) PET/MR scan was performed approximately 60 min (range 60–90) after the intravenous administration of [^18^F]FDG, with the dosage administered following the EANM procedure guidelines for tumor imaging [14]. Four or five FOVs (4 min each) were acquired depending on patients’ height. Simultaneously, MRAC and LAVA-Flex images were acquired for AC correction and anatomical localization, respectively. Following the acquisition of the WB scan and a brief break, a dedicated single PET/MRI-FOV centered on the pelvic region was performed after the intramuscular injection of 40 mg of hyoscine butyl bromide (Buscopan; Boehringer Ingelheim, Ingelheim am Rhein, Germany) to minimize artifacts related to bowel motion. Parallelly, a full set of diagnostic MR sequences were acquired, including the following: (1) a large FOV axial T2 imaging of the pelvis; (2) high-resolution small FOV sagittal, axial, and coronal T2-weighted FSE PROPELLER; (3) a small FOV axial DWI sequence covering the primary tumor (b values, 0–200–600–1000 s/mm^2^); (4) a dynamic contrast-enhanced (DCE) MR study using a LAVA sequence with a temporal resolution of 4 s. Sequential images were acquired before and up to 5 min after intravenous injection of 0.1 mmol/kg of gadolinium chelate (Gadovist; Bayer, Milan, Italy). Finally, a small FOV high-resolution 3D fat-suppressed T1w sequence of the uterus was performed. The total acquisition time per participant was approximately 1 h. PET images were corrected for attenuation using the MRAC sequences simultaneously acquired, with the image reconstruction applying a Bayesian penalized likelihood algorithm (Q.Clear-GE).
2.3. [18F]FDG PET/MRI Analysis
Qualitative and quantitative analysis was performed following current guidelines [15,16] on the Advantage Workstation (ADW Dexus Version 4.7), as described in [13]. Two Nuclear Medicine and two Radiologists separately evaluated the PET and MRI scans, respectively, to provide single modality assessment of the primary tumor and LNs, while being blinded to the results of the histopathologic examinations. A consensus was reached at the conclusion of the assessment to produce a combined PET/MRI evaluation, where primary tumor and LNs findings were classified as positive if deemed suspicious on either PET or MRI evaluation. On MR scans, tumor infiltration in the myometrium, serosa, parametria, and cervical stroma was assessed. LNs were regionally classified as pelvic (obturator and iliac) and abdominal (para-aortic and intercavo-aortic), with the latter being excluded from MRI region-based analysis due to its limited field of view. Post-surgical histopathology was used as reference standard. Max and mean standardized uptake value (SUVmax, SUVmean), metabolic tumor volume (MTV), and total lesion glycolysis (TLG) were calculated within the metabolically active tumor volume defined by a thresholding-based approach (41% of SUVmax), following EANM procedure guidelines [14]. The following MRI dimensional parameters were assessed on post-contrast T1w (pcT1w), T2w, and DWI sequences: tumor antero-posterior, latero-lateral, and cranio-caudal diameters (Size_AP, Size_LL, Size_CC), volume index (VI) resulting from the multiplication of these three diameters, total tumor volume (TTV), total uterine volume (TUV), and tumor volume ratio (TVR = TTV/TUV). Apparent diffusion coefficients (ADCmean, ADCmin, ADCmax) derived from the DWI sequence were noted. DCE-MRI analyses were performed using a dedicated tool (GenIQ) on Advantage Workstation, based on the Toft model [17]. A two-dimensional ROI was manually drawn on perfusion maps on the slice where the tumor had the greatest extension, attempting to exclude healthy tissue and areas of internal necrosis. In this way, the following DCE-MRI parameters were extracted: transfer constant (Ktrans), efflux rate (Kep), extravascular extracellular volume (Ve), contrast–enhancement ratio (CER), integral area under the curve (IAUC), and maximum slope of increase (maxSLOPE). The definitions of the extracted parameters and their calculations are described in [13].
2.4. Surgery and Histopathological Analysis
Surgical procedures and adjuvant therapy were performed according to standard clinical guidelines [8]. Surgical intervention involved total open or laparoscopic hysterectomy, bilateral salpingo-oophorectomy, and peritoneal washing. At histology, tumor histotype, grade, myometrial infiltration, serosal, parametrial and cervical stromal invasion, and LVSI were assessed, blinded to imaging data. For nodal staging, histopathological findings following pelvic/para-aortic lymphadenectomy or sentinel lymph node dissection were considered as the reference standard. Staging was determined in accordance with the FIGO classification of endometrial tumors [18]. For the immunohistochemical analyses, slides of formalin-fixed, paraffin-embedded EC tissues were stained using specific monoclonal antibodies: Estrogen receptor-ER (CONFIRM anti-estrogen receptor SP1), Progesterone receptor-PGR (CONFIRM anti-progesterone receptor 1E2), p53 (CONFIRM anti-p53 DO7), MLH1 (BOND ready-to-use primary antibody ES05), MSH2 (BOND ready-to-use primary antibody 79H11), MSH6 (BOND ready-to-use primary antibody EP49), and PMS2 (BOND ready-to-use primary antibody EP51). The ER, PGR, and p53 markers were stained using the automated BenchMark ULTRA system (Roche Diagnostics, Monza, Italy); the MMR markers were stained with the automated BOND-III system (Leica Biosystems, Milan, Italy). ER and PGR expression were quantified as percentages. p53 positivity was assessed to determine whether the expression was wild-type or indicative of mutations (p53abn). p53abn expression was defined as either overexpression of p53 in >80% of tumor cells or complete absence of nuclear staining in tumor cells. Mismatch repair deficiency (MMRd) was identified by the complete absence of nuclear expression of at least one MMR protein (MLH1, MSH2, MSH6, or PMS2) in carcinoma cells, with stromal and/or lymphocytic cells used as internal controls [19].
2.5. Statistical Analysis
Statistical analyses were performed with Python 3.12.2. Continuous variables were expressed as mean ± standard deviation (SD) or median and interquartile range (IQR); discrete variables were summarized as frequencies and percentages. For qualitative analysis, differences in the modalities of SN and SP were assessed using McNemar’s test, while agreement between imaging and histology was evaluated with Cohen’s kappa (κ). Relationships among quantitative parameters were assessed using Spearman’s correlation; associations between parameters and outcomes were assessed using Fisher’s exact test for dichotomous data, and receiver operating characteristics (ROC) curve analysis for continuous data, with area under the curve (AUC) values interpreted as follows: 50–60% = fail, 60–70% = poor, 70–80% = fair, >80% = good. Optimal cut-offs for significant AUCs were determined via Youden’s J index. Tumor relapse prognosis was assessed with Kaplan–Meier curves (using cut-off values identified in the ROC analysis) and log-rank tests, with univariate Cox proportional hazards models quantifying relapse risk and performance being assessed by the C-index. Benjamini–Hochberg correction was applied for multiple comparisons. Significance was set at p < 0.05.
3. Results
3.1. Participants and EC Characteristics
The study cohort included 80 participants with a mean age of 63 years ±12 (SD). Surgery was performed after a mean of 22 ± 15 days following the PET/MR examination, without any change in medical therapy between imaging and resection. Participants’ demographics and tumor characteristics are presented in Table 1.
3.2. [18F]FDG PET/MRI Diagnostic Accuracy
For primary tumor detection, focal pathological [^18^F]FDG uptake was detected in 78/80 participants (ACC = 97.5%, SN = 97.5%, PPV = 100%); MR accurately identified 79/80 primary tumors (ACC = 98.75%, SN = 98.75%, PPV = 100%). [^18^F]FDG PET/MRI metrics were ACC = 98.75%, SN = 98.75%, PPV = 100%, with only one participant whose tumor was not detected (endometrioid G2 tumor with a max diameter of 1.5 cm). No significant difference between PET and MR sensitivity was observed (p > 0.99).
For LN metastases detection, [^18^F]FDG PET ACC at the patent-level was 93.67% (SN = 84.62%, SP = 95.45%, PPV = 78.57%, NPV = 96.92%), whereas MR, evaluating pelvic lymph nodes only due to its limited field of view, had a slightly lower performance, with an ACC of 89.87% (SN = 69.23%, SP = 93.94%, PPV = 69.23%, NPV = 93.94%), even though the difference in both SN and SP was not statistically significant (p > 0.05). Precisely, two patients with abdominal lymph node metastases were correctly detected by PET but could not be assessed by MRI, contributing to the lower MRI sensitivity. [^18^F]FDG PET/MRI metrics were ACC = 92.41%, SN = 84.62%, SP = 93.94%, PPV = 73.33%, and NPV = 96.88%, which were slightly lower than [^18^F]FDG PET alone due to the one false positive lesion detected by MRI. Patient-level [^18^F]FDG PET, MR, and [^18^F]FDG PET/MR detection metrics are compared and shown in Figure 2.
At the region-based level, pelvic LNs were detected with an ACC of 93.51% (SN = 81.82%, SP = 95.45%, PPV = 75.00%, and NPV = 96.92%) by [^18^F]FDG PET, an ACC of 92.21% (SN = 81.82%, SP = 93.94%, PPV = 69.23%, and NPV = 96.87%) by MRI, and an ACC of 92.21% (SN = 81.82%, SP = 93.94%, PPV = 69.23%, and NPV = 96.87%) by [^18^F]FDG PET/MRI. For abdominal LNs, an ACC of 95.65% (SN = 100.00%, SP = 95.45%, PPV = 50.00%, and NPV = 100.00%) was observed for [^18^F]FDG PET, and thus [^18^F]FDG PET/MRI was the region that was excluded from the MRI’s field of view. For all LNs diagnosed as pathological by [^18^F]FDG PET but later confirmed as false positives, histopathological analysis confirmed a chronic reactive lymphadenitis, partly of the hyperplastic type. One metastasis was also found in the inguinal region, and both [^18^F]FDG PET and MRI correctly detected it. MRI also demonstrated substantial and moderate agreement (κ = 0.65, κ = 0.54) in the detection of myometrial and cervical stroma invasion, respectively. However, none of the tumors characterized by parametria infiltration were detected, and only 1/5 tumors infiltrating the serosa were identified. For LNs detection, [^18^F]FDG PET demonstrated an almost perfect agreement (κ = 0.82), while MRI showed a substantial one (κ = 0.60). A representative case of [^18^F]FDG PET/MR scan is displayed in Figure 3.
3.3. [18F]FDG PET/MR Parameters’ Evaluation
Correlations among all investigated parameters are displayed in Supplemental Figure S1. A strong positive correlation was observed among all imaging parameters describing tumor size, regardless of the modality/sequence. Strong and moderate correlations were also found within MR parameters describing tumor perfusion and within those describing diffusion, while no significant correlation was observed between perfusion and diffusion parameters. Associations between [^18^F]FDG PET/MR-detected deep MI, cervical stroma invasion, and LN metastases with investigated outcomes are summarized in Table 2. Precisely, MRI-detected myometrial invasion was significantly associated with tumor recurrence, with patients showing invasion on MRI having 13.7 times higher odds compared to those without signs of invasion (p = 0.02).
Statistically significant AUCs for each outcome are compared and displayed in Figure 4, and summarized, together with 95% CI, optimal cut-offs, and the respective SN and SP in Supplemental Table S1. [^18^F]FDG PET/MR parameters demonstrated, at best, an AUC = 79.49%, SN = 92.30%, and SP = 60.00% (best parameter: TTV calculated on pcT1w MRI, cut-off: 9.00 mm) in the prediction of LN metastases. Additionally, [^18^F]FDG PET/MR parameters demonstrated higher performance in the assessment of deep MI compared to qualitative analysis (best parameter: TLG, cut-off: 119.40 cm^3^, with AUC = 79.78%, SN = 69.23%, SP = 89.74%), and good performance in the characterization of LVSI (best parameter: TLG, cut-off: 114.20 cm^3^, with AUC = 82.00%, SN = 75.00%, SP = 82.61%). Less accurate predictions were found for EC histotype (best parameter: TVR derived from T2w MRI, cut-off: 9.61 mm, with AUC = 67.86%, SN = 100.00%, SP = 40.00%) and infiltration pattern (best parameter: SUVmean, cut-off: 14.14, with AUC = 65.00%, SN = 68.42%, SP = 69.23%).
According to macromolecular characterization, [^18^F]FDG PET/MRI parameters demonstrated fair predictions for MMRd (best parameter: cranio-caudal diameter measured on pcT1w MRI, cut-off: 30 mm, with AUC = 74.51%, SN = 94.12%, SP = 62.96%) and p53abn (best parameter: TVR derived from ADC maps, cut-off: 17.65 mm, with AUC = 71.47%, SN = 86.67%, SP = 59.32%). Notably, participants’ age provided comparable predictions for p53abn, with AUC = 71.47%, SN = 87.50%, SP = 51.61% using a cut-off of 61 years. Two representative cases of MMRd and p53 immunohistochemical images are displayed in Figure 5. Finally, regarding follow-up data, good and fair predictions were obtained for relapse (best parameter: MTV, cut-off: 13.5 cm^3^, with AUC = 82.50%, SN = 87.50%, SP = 78.57%) and postoperative administration of adjuvant therapy (best parameter: TTV calculated from T2w MRI, cut-off: 7 mm, with AUC = 73.50%, SN = 85.36%, SP = 57.57%), respectively.
Overall, patients were followed up for a mean (SD) of 3.13 (1.6) years, during which nine participants (11.25%) experienced disease recurrence. Parameters demonstrating the highest AUC among the PET (MTV) and MRI (Size_CC) values were independently investigated. Both parameters demonstrated a strong association with the risk of tumor relapse, with participants characterized by a Size_CC ≥ 43 mm and MTV ≥ 13.5 cm^3^ showing a significantly reduced disease-free survival (log-rank p-values p < 0.001), with a C-index of 0.77 and 0.76, respectively. Kaplan–Meier survival curves are shown in Figure 6.
4. Discussion
Accurate risk stratification and tumor staging are crucial for determining the optimal treatment strategy of EC patients, especially for younger patients of reproductive age who may benefit from fertility-sparing approaches. However, many features of tumor aggressiveness can only be assessed after surgery or through biopsy, which may not capture tumor heterogeneity. Moreover, patients with similar histological characteristics can present variable clinical outcomes.
This prospective study aimed to assess the diagnostic and prognostic value of fully hybrid [^18^F]FDG PET/MRI in endometrial cancer staging, specifically in predicting tumor aggressiveness, molecular characteristics, and tumor relapse. Our findings indicate that [^18^F]FDG PET/MRI accurately identified primary tumors (ACC = 98.75%, SN = 98.75%, PPV = 100%) and LN involvement (ACC = 92.41%, SN = 84.62%, SP = 93.94%, PPV = 73.33%, and NPV = 96.88%). Notably, the accuracy in identifying primary tumors was primarily achieved by MRI alone, which even slightly surpassed the performance of [^18^F]FDG PET/MR. Conversely, considering LNs involvement, PET alone outperformed [^18^F]FDG PET/MR. These findings confirm the value of [^18^F]FDG PET and MRI as standalone imaging modalities for primary tumors’ characterization and LN assessment, respectively. In centers that have access to hybrid PET/MR technology, this imaging tool represents the optimal choice, providing excellent preoperative staging, reducing the need for multiple tests, saving time, and reducing patient exposure to radiation from PET/CT. However, in centers where hybrid [^18^F]FDG PET/MR is not available, the combined use of [^18^F]FDG PET/CT and MRI still remains an effective and accurate approach for EC staging.
[^18^F]FDG PET/MRI parameters successfully predicted several features of tumor aggressiveness (AUCs of 79.49% for LN metastasis, 79.78% for deep MI, and 82.00% for LVSI), as well as key immunohistochemical molecular markers fundamental to the new molecular classification of EC patients (AUCs of 71.47% and 74.51% for p53abn and MMRd, respectively) and tumor relapse (AUC = 82.00%). Based on these results, [^18^F]FDG PET/MRI holds promise for early, non-invasive characterization of EC patients, offering potential advantages in patient management.
Our study’s metrics for primary tumor detection and LN involvement corroborate previous literature findings while highlighting the distinct contributions of PET and MRI modalities. Tsuyoshi et al. [20] found similar diagnostic accuracy in a study of 36 EC patients, where [^18^F]FDG PET/MRI demonstrated similar accuracy to conventional imaging and exceeded ceCT in sensitivity for regional nodal metastasis. Bian et al. [21], in a cohort of 81 patients, reported PET/MRI superior sensitivity and specificity for LN metastasis (95.5% vs. 86.5%, p < 0.005) compared to PET/CT.
Our analysis highlighted strong correlations among the different parameters describing tumor size, regardless of the imaging modality or sequence. This correlation, also observed in previous research, emphasizes the metabolic component’s role in EC growth and progression, emphasizing the potential of metabolic-targeting agents such as metformin as auxiliary treatments, especially in cases resistant to standard chemotherapy [22,23]. Parameters describing tumor size showed good predictive value for several features of aggressiveness, aligning with previous studies [24,25] and Mayo criteria for risk assessment [26]. Despite these findings, the FIGO staging system includes tumor size as a standard measurement for cervical cancer, but not for EC [27].
Regarding the investigation on the relationship between [^18^F]FDG PET/MR imaging parameters and the recent EC molecular characterization, MMRd correlated with SUVmax and TLG, along with MRI-derived cranio-caudal diameter and volume index. This new finding aligns with studies indicating that the immune microenvironment in MMRd subtypes is characterized by a higher lymphocyte infiltration and thus affected by higher glucose uptake [28,29,30]. For p53abn, associations were instead found with ADC-based tumor volume ratios and age. This could help tailor treatment strategies, since recent studies have shown improved survival with chemotherapy compared to radiation alone for p53abn EC [31]. According to literature, Tian et al. [32] demonstrated that multimodal MRI, including DWI, can distinguish p53abn from p53 wild-type EC, while Zhang et al. [33] found that ADC values were significantly higher in p53abn EC than in other subtypes.
Our study also demonstrated associations between [^18^F]FDG PET/MRI parameters and recurrence risk, with participants characterized by a tumor’s cranio-caudal size ≥ 43 mm or MTV ≥ 13.5 cm^3^ experiencing significantly reduced disease-free survival. Moreover, patients showing myometrial invasion on the MRI had 13.7 times higher odds of tumor relapse compared to those without signs of invasion (p = 0.02).
This study has some limitations. First, it should be noted that MRI lymph node evaluation in our study was limited to pelvic regions due to the MRI restricted field of view, which excluded abdominal lymph nodes from assessment, and this anatomical coverage limitation should be considered when interpreting the comparative performance of the two modalities for LNs detection. Furthermore, our sample showed limited number of events and class imbalances, particularly in LNs and recurrence analysis, although remaining consistent with general population incidence. Additionally, data for molecular profiling were incomplete and POLE mutational status was not assessed. Finally, the cut-off values used for survival analysis require external validation before clinical application, as they were derived from ROC analysis within our cohort and may thus overestimate prognostic performance. Due to these limitations, the presented findings should be considered exploratory and hypothesis-generating, and future studies with larger sample sizes, comprehensive molecular profiling including, and independent external validation cohorts will be needed to confirm these associations and establish clinically applicable thresholds.
In conclusion, [^18^F]FDG PET/MRI demonstrated excellent diagnostic and prognostic performance for EC staging and recurrence prediction, with PET/MRI parameters offering insight into tumor aggressiveness and molecular characteristics. Future studies should focus on expanding cohort sizes to validate these findings and exploring tailored therapeutic interventions and follow-up protocols.
5. Conclusions
[^18^F]FDG PET/MRI demonstrated high diagnostic accuracy in the preoperative staging of EC, effectively identifying both primary tumor extent and lymph node metastases. Additionally, [^18^F]FDG PET/MRI-derived imaging parameters showed association with histological features of tumor aggressiveness, molecular markers (including p53abn and MMRd), and risk of tumor relapse. These findings underscore the potential of this hybrid technique to support optimal patient risk stratification and personalized treatment planning, even though future validation is needed before clinical application.
The reference list from the paper itself. Each links out to its DOI / PubMed record.
- 1Hu Z. Wu Z. Liu W. Ning Y. Liu J. Ding W. Fan J. Cai S. Li Q. Li W. Proteogenomic Insights into Early-Onset Endometrioid Endometrial Carcinoma: Predictors for Fertility-Sparing Therapy Response Nat. Genet.20245663765110.1038/s 41588-024-01703-z 38565644 · doi ↗ · pubmed ↗
- 2Setiawan V.W. Yang H.P. Pike M.C. Mc Cann S.E. Yu H. Xiang Y.-B. Wolk A. Wentzensen N. Weiss N.S. Webb P.M. Type I and II Endometrial Cancers: Have They Different Risk Factors?J. Clin. Oncol.2013312607261810.1200/JCO.2012.48.259623733771 PMC 3699726 · doi ↗ · pubmed ↗
- 3Narayan K. Rejeki V. Herschtal A. Bernshaw D. Quinn M. Jobling T. Allen D. Prognostic Significance of Several Histological Features in Intermediate and High-risk Endometrial Cancer Patients Treated with Curative Intent Using Surgery and Adjuvant Radiotherapy J. Med. Imaging Radiat. Oncol.20095310711310.1111/j.1754-9485.2009.02045.x 19453536 · doi ↗ · pubmed ↗
- 4Weinberg L.E. Kunos C.A. Zanotti K.M. Lymphovascular Space Invasion (LVSI) Is an Isolated Poor Prognostic Factor for Recurrence and Survival Among Women with Intermediate- to High-Risk Early-Stage Endometrioid Endometrial Cancer Int. J. Gynecol. Cancer 2013231438144510.1097/IGC.0b 013e 3182 a 16c 9324257558 · doi ↗ · pubmed ↗
- 5Park J.Y. Hong D. Park J.Y. Association between Morphological Patterns of Myometrial Invasion and Cancer Stem Cell Markers in Endometrial Endometrioid Carcinoma Pathol. Oncol. Res.20192512313010.1007/s 12253-017-0320-528990139 · doi ↗ · pubmed ↗
- 6Getz G. Gabriel S.B. Cibulskis K. Lander E. Sivachenko A. Sougnez C. Lawrence M. Kandoth C. Dooling D. Fulton R. Integrated Genomic Characterization of Endometrial Carcinoma Nature 2013497677310.1038/nature 1211323636398 PMC 3704730 · doi ↗ · pubmed ↗
- 7Berek J.S. Matias-Guiu X. Creutzberg C. Fotopoulou C. Gaffney D. Kehoe S. Lindemann K. Mutch D. Concin N. Endometrial Cancer Staging Subcommittee, FIGO Women’s Cancer Committee. FIGO Staging of Endometrial Cancer: 2023 J. Gynecol. Oncol.202334 e 8510.3802/jgo.2023.34.e 8537593813 PMC 10482588 · doi ↗ · pubmed ↗
- 8Colombo N. Creutzberg C. Amant F. Bosse T. González-Martín A. Ledermann J. Marth C. Nout R. Querleu D. Mirza M.R. ESMO-ESGO-ESTRO Consensus Conference on Endometrial Cancer: Diagnosis, Treatment and Follow-Up Radiother. Oncol.201511755958110.1016/j.radonc.2015.11.01326683800 · doi ↗ · pubmed ↗