Correction: Mosca et al. Sarcoma Common MHC-I Haplotype Restricts Tumor-Specific CD8+ T Cell Response. Cancers 2022, 14, 3414
Laura Mosca, Alessandra de Angelis, Andrea Ronchi, Annarosaria De Chiara, Flavio Fazioli, Carlo Ruosi, Lucia Altucci, Mariarosaria Conte, Filomena de Nigris

Abstract
Genes, proteins, chemicals, diseases, species, mutations and cell lines named across the full text — each resolved to its canonical identifier and authoritative record.
Click any figure to enlarge with its caption.
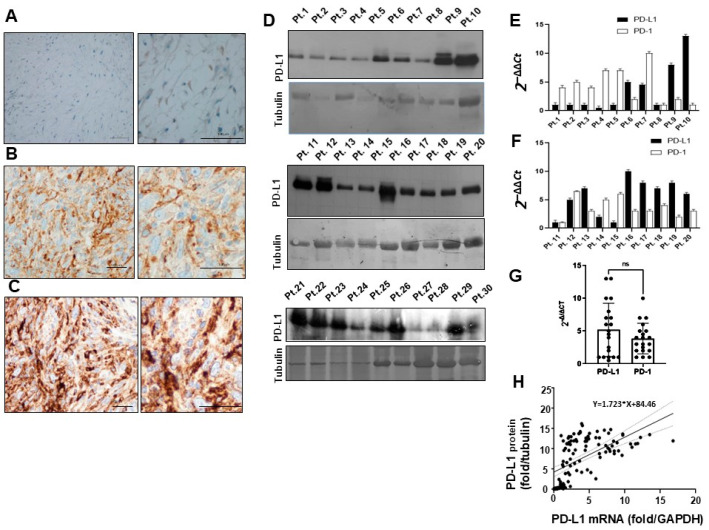 Figure 2
Peer Reviews
No public reviews on file for this paper yet. If you reviewed it on a platform where reviews are public (OpenReview, ICLR, NeurIPS, ICML), you can paste yours below so the community can read it here.
Videos
No videos yet. Explain this paper in a talk, walkthrough, or lecture? Add one.
Taxonomy
TopicsCancer Immunotherapy and Biomarkers · Immunotherapy and Immune Responses · vaccines and immunoinformatics approaches
Error in Figure 2A
In the original publication [1], there were mistakes in Figure 2A as published. Figure 2A was an overlapping photo taken from the histology of the same patient as shown in Figure 1E, instead of the patient indicated in the legend. Since the correct images of both patients are negative controls devoid of specific staining, the error was not immediately detected during figure assembly or revision. The corrected Figure 2A appears below. The authors state that the scientific conclusions are unaffected. This correction was approved by the Academic Editor. The original publication has also been updated.
(A) Representative negative PD-L1 immunohistochemistry of myxofibrosarcoma at grade I; (B) High grade myxofibrosarcoma with moderate staining with anti-PD-L1 antibody. (C) High grade myxofibrosarcoma strongly positive to PD-L1 antibody. Low magnification images on the left, high magnification on the right; Scale bars = 200 µm and 50 µm, respectively. (D) Western blot of the same amounts of total protein extracts from representative sarcoma tissues, detected with PD-L1 antibody and tubulin control. (E,F) Representative real-time PCR quantification of PD-L1 and PD-1 mRNA expression in different STS patients (n = 20). Relative quantifications were reported as 2−∆∆Ct. (G) Quantitative comparison of PD-L1 and PD-1 mRNAs in overall patient population ns (not significant). (H) Linear regression between PD-L1 mRNA(fold-change/GAPDH) and protein (fold-change/tubulin) in individual patients (n = 40). R2 = 0.33, 95% C.I. = 1267 to 2179.
The reference list from the paper itself. Each links out to its DOI / PubMed record.