Comparative Genomic Analysis and Functional Identification of CER1 and CER3 Homologs in Rice Wax Synthesis
Nesma E. E. Youssif, Bowen Yang, Haodong Huang, Mohamed Hamdy Amar, Mohamed Ezzat, Mohammad Belal, Sanaa A. M. Zaghlool, Huayan Zhao, Dong Fu, Shiyou Lü

TL;DR
This paper identifies key genes involved in wax production in rice, which could help improve stress tolerance in crops.
Contribution
The study systematically compares CER1 and CER3 homologs in rice and identifies OsCER3a as a major contributor to wax synthesis.
Findings
OsCER3a mutation significantly reduces wax production in rice.
CER1 and CER3 genes form complexes during wax synthesis.
Promoter analysis reveals stress-responsive elements in CER genes.
Abstract
This study provides a comprehensive characterization of CER1 and CER3 gene families in rice, revealing their evolutionary divergence into two distinct subgroups despite originating from a common ancestral lineage. These genes display different tissue-specific expression patterns. Promoter analysis identified an abundance of cis-regulatory elements responsive to light and drought, suggesting potential involvement in abiotic stress adaptation. Subcellular localization confirmed endoplasmic reticulum (ER) targeting, consistent with their enzymatic functions in wax biosynthetic pathways. Protein–protein interaction assays further revealed that OsCER1 proteins interact with OsCER3 homologs, mirroring conserved interactions observed in dicot species such as Arabidopsis thaliana. Functional analysis of transgenic and knockout lines highlighted OsCER3a as a key regulator of wax accumulation,…
Genes, proteins, chemicals, diseases, species, mutations and cell lines named across the full text — each resolved to its canonical identifier and authoritative record.
Click any figure to enlarge with its caption.
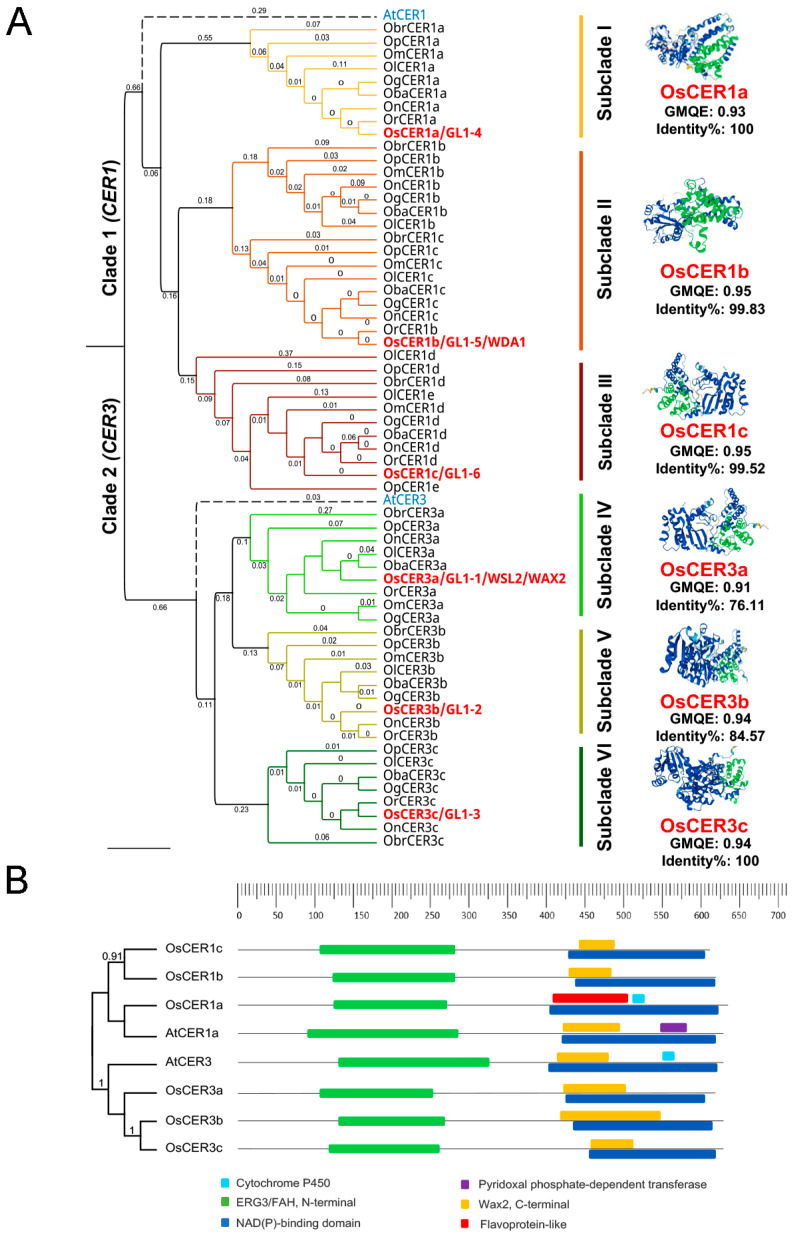 Figure 1
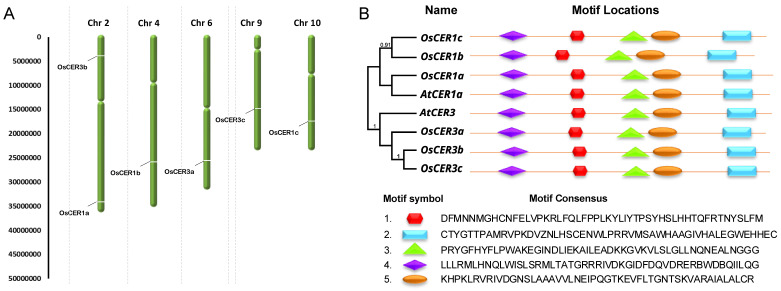 Figure 2
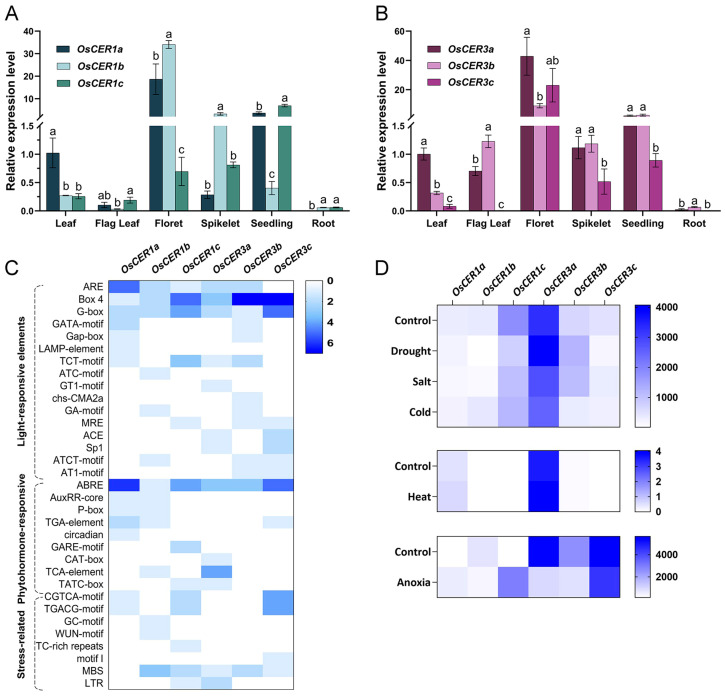 Figure 3
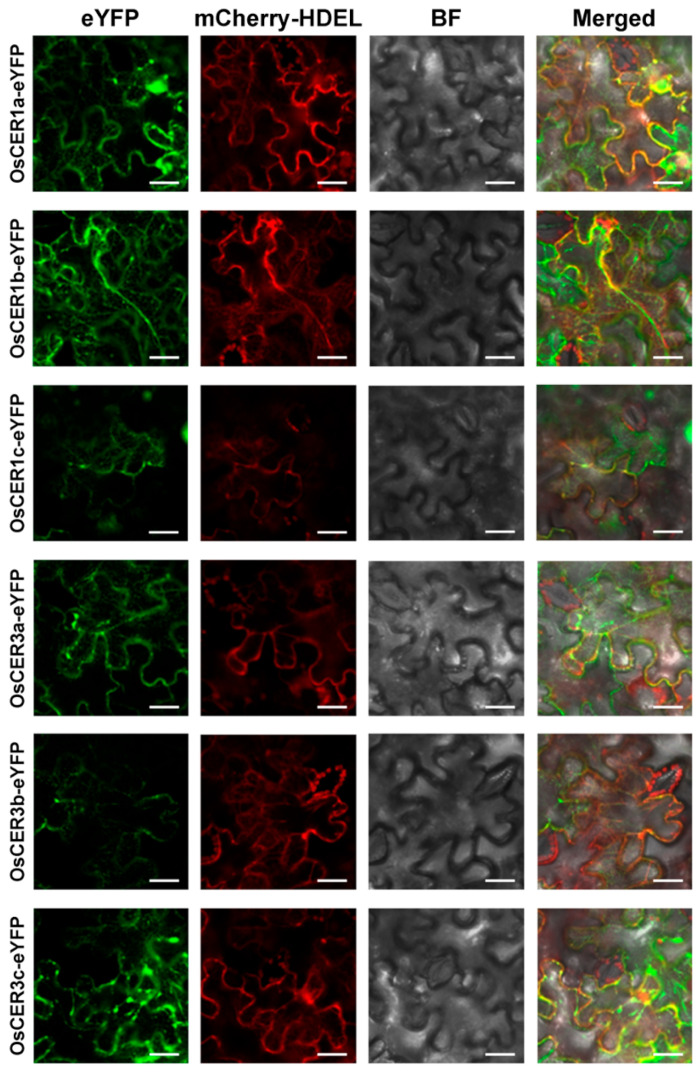 Figure 4
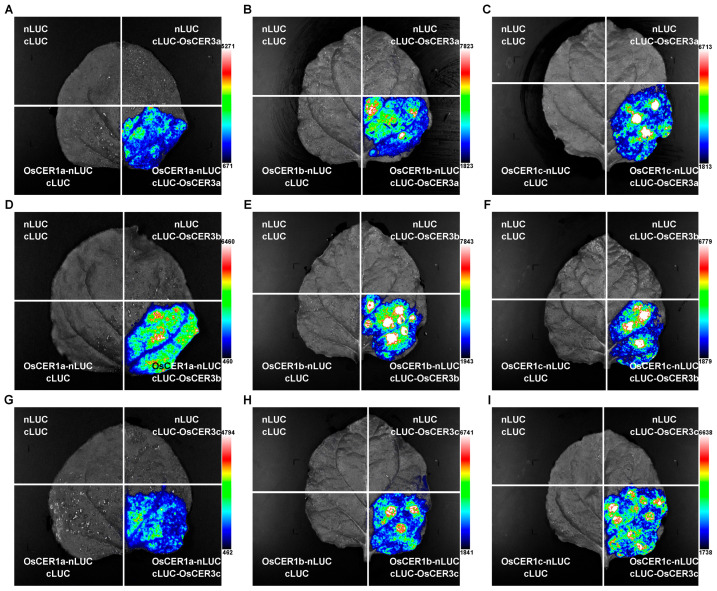 Figure 5
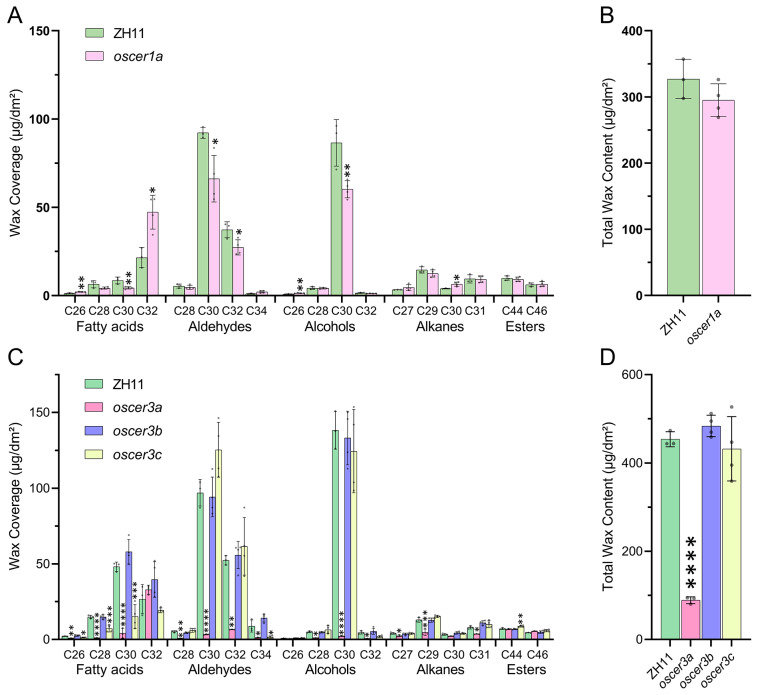 Figure 6
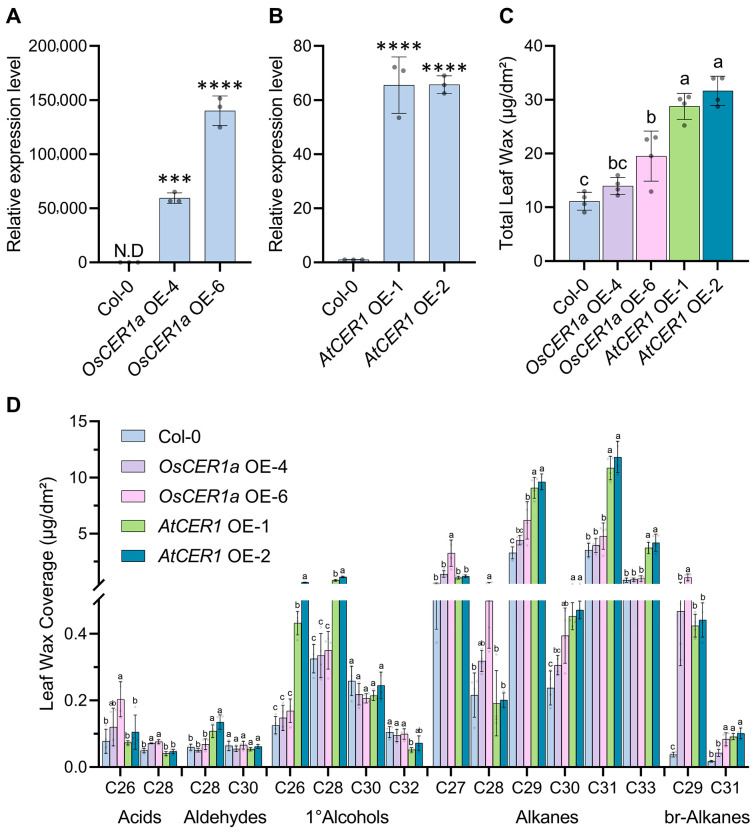 Figure 7
- —Natural Science Foundation of Hubei Province
Peer Reviews
No public reviews on file for this paper yet. If you reviewed it on a platform where reviews are public (OpenReview, ICLR, NeurIPS, ICML), you can paste yours below so the community can read it here.
Videos
No videos yet. Explain this paper in a talk, walkthrough, or lecture? Add one.
Taxonomy
TopicsPlant Surface Properties and Treatments · Lipid metabolism and biosynthesis · Research in Cotton Cultivation
1. Introduction
Plant cuticular wax together with cutin forms a hydrophobic layer on plant surfaces against water loss and provides protection from various abiotic and biotic stresses [1,2,3,4]. Cuticular waxes are classified into two types: intracuticular waxes, embedded within the cutin layer, and epicuticular waxes, which form the crystal structure [1,5]. Cuticular wax biosynthesis initiates in epidermal plastids with de novo fatty acid production, followed by transport to the endoplasmic reticulum. There, the fatty acid elongase (FAE) complex progressively extends these precursors into very-long-chain acyl-CoAs (VLCFA-CoAs) through iterative elongation reactions [1]. After elongation, these VLCFA-CoAs are converted into wax components via alcohol-forming and alkane-forming pathways [1]. The alcohol-forming pathway (acyl-reduction pathway) produces primary alcohols and wax esters, while the alkane-forming pathway (decarbonylating pathway) yields alkanes, aldehydes, secondary alcohols and ketones [5,6]. In the alcohol-producing pathway, VLCFA-CoAs are either directly reduced by fatty acyl-CoA reductase (FAR3/CER4) or sequentially converted via a two-step reduction catalyzed by CER3 and SOH1 [7,8]. The primary alcohols are subsequently esterified with C16 fatty acids by wax ester synthase/diacylglycerol transferase (WSD1) to produce wax esters [9]. Alkane production requires the coordinated activity of the CER1, CER3 and CYTB5 (Cytochrome B5), in which CER1 and CER3 play core roles [10,11,12,13,14]. Although CER3 and CER1 have different enzymatic activities, they share similar amino acid sequences and likely evolved from a common ancestor [12,14]. The CER3 gene encodes a putative VLCFA reductase, which is supposed to catalyze the production of VLCFA aldehydes from VLCFA-CoA, while the CER1 gene, crucial for very-long-chain (VLC) alkane biosynthesis, encodes a decarbonylase that converts VLC aldehydes into corresponding alkanes [10,11,14,15].
Alkanes play important roles across different plant species. AtCER1 overexpression significantly increases the odd-numbered alkanes, thus decreasing cuticle permeability and enhancing drought resistance [15]. Similarly, a study performed on tobacco showed that alkanes are positively related to drought and heat resistance [16]. Our recent study also confirms that drought stress induces alkane biosynthesis [8]. Furthermore, under water-limited conditions, CER3 preferentially associates with CER1, thereby channeling very-long-chain fatty acids (VLCFAs) into the alkane-forming pathway [8]. These studies demonstrate that the interaction between CER1 and CER3 is essential for the production of alkanes and the assembly of the efficient sealing layer upon various stresses [3].
In rice, eleven potential homologs of the maize Glossy1 (GL1)/Arabidopsis CER3/WAX2/YRE/FLP gene have been identified [17]. These Glossy1-like genes are categorized into two groups based on sequence similarity, i.e., the CER3-related group (OsGL1–1, OsGL1–2 and OsGL1–3) and the CER1-related group (OsGL1–4, OsGL1–5, OsGL1–6 and OsGL1–7) [18]. To date, although many wax-related genes have been cloned and individually characterized, their functional differentiation within gene families remains unclear, and their roles in certain organs are not clearly defined yet. In addition, most studies have focused on Arabidopsis rather than major crops; the regulatory networks underlying wax biosynthesis in rice, maize and wheat are still poorly defined, creating a bottleneck for crop improvement. This study addresses that gap by using rice as a model to dissect the key factors involved in alkane and primary alcohol biosynthesis. The findings refine the wax biosynthetic network in rice and provide novel targets and strategies for genome editing aimed at enhancing stress resistance, thereby contributing both theoretical insights and practical tools to strengthen food security.
Leaves are the primary organs of photosynthesis, a physiological process essential for plant growth. The wax and cutin layer deposited on the leaf surface provides critical protection against various environmental stresses, ultimately influencing crop yields. To explore which OsCER1 or OsCER3 members play major roles in leaf wax production, we first characterized the physicochemical properties of rice CER1 and CER3 proteins and identified their phylogenetic relationships. We then profiled transcript abundance across organs and stress treatments and scanned the promoter regions for cis-elements that might confer tissue- or stimulus-specific expression. Because our earlier work indicated that CER1 and CER3 assemble into a complex that directs carbon flux toward either alkanes or alcohols, we used the luciferase complementary assay (LCA) to detect interactions between the two gene families. Finally, to compare their roles in wax production, we also examined the wax phenotype of rice or Arabidopsis expressing or knocking out either of these genes. All in all, our study will be helpful to uncover the relationship between CER1 and CER3 and to strictly define their precise roles in wax production. This work provides a valuable genomic and functional resource with potential applications for enhancing stress resistance and productivity in cereal crops.
2. Materials and Methods
2.1. Plant Materials and Growth Conditions
Arabidopsis thaliana (Col-0 ecotype) and rice (Oryza sativa subsp. japonica cv. Zhonghua 11) were used in this study. For Arabidopsis, seeds were surface-sterilized and sown on half-strength Murashige and Skoog (½ MS) medium, stratified at 4 °C for 3 days, and then transferred to a growth chamber set at 22 °C under long-day conditions (16 h light/8 h dark). After 10 days, seedlings were transferred to soil-filled pots measuring 7 × 7 × 7.8 cm^3^ and maintained under the same photoperiod and temperature. Rice seeds were imbibed in water at 37 °C for 4 days and then sown in pots with Yoshida nutrient solution supplemented with 47.632 mg L^−1^ Na_2_SiO_3_·9H_2_O. Rice plants were grown in a growth chamber under 14 h light at 30 °C and 10 h dark at 26 °C. Growth conditions for both Arabidopsis and rice were maintained at 65% relative humidity with a light intensity of 200 µmol photons m^−2^ s^−1^. Arabidopsis was irrigated every three days, whereas the nutrient solution for rice was refreshed weekly. Each experimental sample included three biological replicates, with each replicate consisting of 3–4 individual Arabidopsis or rice plants. OsCER3a and OsCER1a mutants were generated by BioRun Company (Wuhan, China). Single mutants of oscer3b and oscer3c (T1 generation) were bought from Biogle Genetech (www.biogle.cn).
2.2. Methods
2.2.1. Phylogenetic Analysis and Protein Structure Prediction
A phylogenetic analysis was performed to investigate the evolutionary relationships and divergence patterns of CER1 and CER3 homologs across rice species. Genomic sequences from nine representative Oryza species were utilized to construct a phylogenetic tree, enabling the assessment of gene conservation and lineage-specific diversification (Table S1); all available CER1 and CER3 query sequences in rice and Arabidopsis were identified through Blastp searches using Arabidopsis CER1 and CER3 protein sequences as the reference genome. Phylogenetic trees were generated with FastTree V2 [19] and Geneious Prime 2025.1.1 [20], employing 1000 bootstrap replicates to assess branch support. CER1 genes from the same selected Oryza species were used as an outgroup, and the tree was constructed using the Jones–Taylor–Thornton (JTT) model with 20 site-rate categories. Model selection was further validated using ProtTest [21], which compared the JTT and Markov models to identify the best-fitting substitution model. Among the available amino acid substitution models, JTT has been the default choice in the majority of plant protein phylogenies (e.g., Arabidopsis, rice, maize) and was therefore adopted here without further model comparison. Evolutionary calibration of the CER-based tree was performed with the relative-time maximum likelihood method in MEGA-X [22], converting relative branch lengths (amino acid substitutions) into absolute divergence times by applying external calibration points as temporal constraints. These calibration points provided independent evidence linking genetic changes to real-world timescales. Additionally, the 3D structures of the rice CER1 and CER3 proteins were predicted using Swiss-Model [23]. Model accuracy was assessed using the Global Model Quality Estimation (GMQE) score, and sequence identity was calculated to determine the percentage of identical amino acids between target sequences and selected templates.
2.2.2. Chromosomal Localization and Motif Analysis
The percentage similarity and identity of rice and Arabidopsis protein sequences were calculated with the Ident and Sim online sequence manipulation tool (http://www.bioinformatics.org/sms2/ident_sim.html, accessed on 13 January 2026) [24]. In addition, segmental and tandem duplications were analyzed to determine their contributions to genome evolution. DnaSP v6.12.03 was used to calculate the synonymous (Ks) and non-synonymous (Ka) substitution rates for homologous CER1/3 gene pairs [25]. Segmentally and tandemly duplicated genome regions were visualized using TBtools 2.390 [26]. Furthermore, the chromosomal positions of OsCER1 and OsCER3 genes were identified using the MapGene2Chromosome v2.0 visualization platform (http://mg2c.iask.in/mg2c_v2.0/, accessed on 13 January 2026). Genomic coordinates were obtained from the Oryza sativa genome database, and the loci were subsequently mapped onto their respective chromosomes to illustrate the spatial distribution of these genes within the rice genome. Moreover, the identification of conserved motifs in the CER1 and CER3 protein sequences was carried out using the MEME Suite web server (v5.5.0). The analysis was performed in classic motif discovery mode, with the number of repetitions set to “any” and the maximum number of motifs limited to ten. Data including statistical significance scores (E-values), motif lengths, and inter-motif variability metrics for every identified motif are provided in Table S2.
2.2.3. Cis-Acting Element Prediction and Expression Pattern Analysis
For cis-element screening, the 2 kb regions upstream of the candidate genes were analyzed to identify candidate regulatory elements using PlantCARE [27]. For expression pattern analysis of the desired genes in response to various abiotic stresses, the relevant information was downloaded from the public database (https://bar.utoronto.ca/efprice, accessed on 13 January 2026). Drought-, salt- and cold-stress data were obtained from Jain et al. [28]; anoxia data from Lasanthi-Kudahettige et al. [29]; and heat-stress data from Robertson et al. [30]. The heatmap was created by Graphpad Pism9.5 software. The 2 Kb upstream sequences of OSCER1a, OSCER1b, OSCER1c, OSCER3a, OSCER3b and OSCER3C are provided in Supplementary Data S1.
2.2.4. Quantitative RT-PCR (RT-qPCR) Analysis
Total RNA was extracted from plant tissues using the Universal Plant Total RNA Extraction Kit (BioTeke, Beijing, China), including 10-day-old seedlings and other organs at the heading stage. Using 1 μg of total RNA as a template, first-strand cDNA was synthesized using HiScript II First-Strand cDNA Synthesis Kit (Vazyme, Nanjing, China). PCR was carried out on the Bio-Rad CFX96 PCR system (Bio-Rad, Hercules, CA, USA). The thermal cycling conditions consisted of an initial denaturation at 95 °C for 2 min, followed by 39 amplification cycles of 95 °C for 10 s and 60 °C for 30 s. Each experimental condition was analyzed with three biological replicates and three technical replicates. RT-qPCR was performed according to the manufacturer’s protocol (Vazyme, Nanjing, China), with AtACTIN2 (for Arabidopsis) and OsUBQ5 (for rice) used as internal references [8,31]. The 2^−ΔΔCT^ method was used to calculate the relative expression levels of each gene in different tissues. The primers used in this study are listed in Table S3. The experiment was conducted using at least three biological replicates.
2.2.5. Plasmid Construction
To generate OsCER1a and OsCER3a mutants, we constructed expression vectors using the pYLCRISPR::Cas9-pUbi-MH plasmid as the backbone. These vectors contain guide RNA sequences targeting the respective genes: OsCER1a: 5′-AATGGCCGTGGCATAGGCTGGGG-3′ and 5′-GCTGCGGGCGGTCTGGTAACGGG-3′; OsCER3a: 5′-AGCGGGCGAGCCCCGACCACTGG-3′ and 5′-GGCCCCTGGCGTCCCACAGCGGG-3′.
To investigate the expression of OsCER1s or OsCER3s in tobacco or Arabidopsis, we cloned the full length of their corresponding coding sequences into the pFGC-eYFP vector using a one-step cloning method (Biomed). To explore the interaction between OsCER1s and OsCER3s, we cloned the full length of their corresponding coding sequences into pCAMBIA 1300-NLuc or pCAMBIA 1300-CLuc vector using the same method as described above. All plasmids used for vector construction were verified by Sanger sequencing. The pFGC-eYFP vector was constructed as CaMV 35S::CDS::eYFP::OCS terminator. The CAMBIA-based vectors were constructed as CaMV 35S::CDS::nLUC::E9 terminator or CaMV 35S::cLUC::CDS::E9 terminator.
2.2.6. Transient Tobacco Transformation and Production of Arabidopsis Transgenic Plants
A. tumefaciens GV3101 cells carrying the recombinant pEGC-eYFP plasmid were cultured to prepare a feeder culture. A single colony of A. tumefaciens was transferred into 5 mL of LB medium supplemented with kanamycin (50 μg mL^−1^) and rifampicin (50 μg mL^−1^) and incubated at 28 °C with shaking for 24–48 h. This starter culture was subsequently used to inoculate 500 mL of LB medium containing the same antibiotics and incubated at 28 °C for 16–24 h until the culture reached the stationary phase, indicated by an optical density at 600 nm (OD_600_) of 1.6–1.8. Transient transformation of Nicotiana benthamiana was conducted as described by Sparke et al. [32]. The target genes, along with an endoplasmic reticulum (ER) marker (CD3-959), were co-transformed into the leaves. After a 2-day incubation period post-infiltration, fluorescence was captured on a Zeiss LSM 980 confocal laser-scanning microscope. eYFP was excited at 514 nm and detected between 535 and 580 nm, whereas mCherry was excited at 561 nm and collected from 590 to 620 nm.
The Arabidopsis plants (Col-0) were transformed by the Agrobacterium strain containing 35S:OsCER1a-eYFP or 35S:AtCER1-eYFP through the floral-dipping method. The T0 transgenic seeds were evenly sown in the soil. After germination, 1:1000 diluted Basta herbicide was sprayed on the plants to screen for positive transgenic lines. Finally, the confirmed OE lines (OsCER1a OE-4, OsCER1a OE-6, AtCER1 OE-1 and AtCER1 OE-2) were selected for further study.
2.2.7. Luciferase Complementary Assay (LCA)
LCA was carried out according to previous studies [33]. Constructs encoding OsCER1-nLUC and cLUC-OsCER3 were individually transformed into Agrobacterium tumefaciens strain GV3101 via the freeze–thaw method. The colonies were selected on the solidified Luria–Bertani (LB) medium, where four bacterial combinations were prepared: empty-nLUC + empty-cLUC, OsCER1-nLUC + empty-cLUC, empty-nLUC + cLUC-OsCER3 and OsCER1-nLUC + cLUC-OsCER3. Each strain was cultured overnight in 5 mL of liquid LB medium supplemented with kanamycin (50 μg/mL), gentamicin (50 μg/mL) and rifampicin (50 μg/mL) at 28 °C and 220 rpm. Subsequently, 1 mL of culture was transferred to 5 mL liquid LB medium containing 1.2 μL acetosyringone (100 mM) and incubated for an additional 4 h. Bacterial cells were harvested by centrifugation at 12,000 rpm for 1 min at room temperature, washed twice with 1 mL osmotic buffer, and cultures were suspended overnight in 1 mL osmotic buffer (half-strength liquid Murashige and Skoog (MS) medium containing 150 μM of acetosyringone, pH 5.7). The solution was then injected into N. benthamiana leaves. The optical density at 600 nm (OD_600_) was measured after 20-fold dilution to determine bacterial concentration. Based on OD_600_ values, 80/A μL of each original suspension was diluted to 2 mL with osmotic buffer. For infiltration, 1 mL of each prepared suspension was mixed to generate the four combinations.
Fully expanded leaves of N. benthamiana were divided into four regions and infiltrated with the respective bacterial mixtures using a 1 mL needleless syringe, targeting the abaxial surface away from major veins. Plants were maintained in darkness for 24 h post-infiltration and then returned to standard growth conditions. At 72 h post-injection, leaves were sprayed with fluorescein potassium salt (0.2 mg/mL) and kept in the dark for 5–10 min to allow chlorophyll luminescence to decay. Luminescence signals were captured using a Tanon 5200 CCD imaging system (Tanon, Shanghai, China), and relative luciferase activity was quantified as luminescence intensity per unit leaf area (cm^2^). Each experiment was conducted with at least three biological replicates, and representative images from one replicate are shown.
2.2.8. Cuticular Wax Analysis
Waxes were collected from the leaves of 4-week-old Arabidopsis or 3-week-old rice (Oryza sativa L.). The cuticular wax composition of leaves from wild-type, different overexpression and mutant lines was examined as described by Lü et al. [34], with slight modifications. Leaf samples were submerged in hexane for 30 sec, and samples with the internal standard n-Tetracosane were evaporated under nitrogen. Waxes were derivatized by incubation in N,O-bis(trimethylsilyl)trifluoroacetamide (BSTFA) at 100 °C for 15 min. Silylated samples were analyzed on an Agilent 8860 gas chromatograph (GC) equipped with DB-5 (30 m 0.25 mm × 0.25 µm; Agilent, Santa Clara, CA, USA) capillary column and a flame ionization detector, using helium as the carrier gas. The column temperature was initially set at 80 °C and gradually increased at 40 °C min^−1^ to 200 °C, at which point the temperature remained unchanged for 10 min. The temperature was then increased gradually at 3 °C per min and finally reached 320 °C, at which point the temperature was held for 20 min. The quantification was performed based on flame ionization detector (FID) peak areas relative to the internal standard n-Tetracosane. The experiment was conducted using at least three biological replicates, each with three or four technical replicates.
2.2.9. Statistical Analysis
All statistical analyses were performed using one-way analysis of variance (ANOVA) followed by Tukey’s multiple-comparison test (significance threshold p < 0.05) to compare samples from the different lines. Figures were generated with GraphPad Prism 9.5.0 (https://www.graphpad.com/scientific-software/prism/, accessed on 13 January 2026).
3. Results
3.1. Physicochemical Properties and Phylogenetic Analysis of CER1 and CER3 Genes in Rice
A comprehensive analysis identified three copies each of CER1 (OsCER1a–c) and CER3 (OsCER3a–c) in the japonica rice (Oryza sativa L.) genome. These genes exhibited distinct physicochemical properties, including variations in genomic length, coding sequences (CDS), protein length, molecular weight (MW) and isoelectric points (pI) (Table 1). The genomic lengths of these OsCER1/3 genes range between 4 kb and 7 kb, and the corresponding CDS is about 1.9 kb in length. The proteins comprise 595–635 amino acids. These proteins are all basic.
Phylogenetic analysis of Arabidopsis CER1 and CER3 gene homologs across Oryza species classified the genes into two distinct clades (Figure 1A): CER1 (Clade I) and CER3 (Clade II). Tree supports values were displayed on the tree to show branch reliability, with higher numbers meaning stronger data support for that grouping, using 1000 bootstrap replicates. Each clade is further divided into three well-defined subclades, with each subclade containing a single OsCER1 or OsCER3 gene paralog. Notably, the Arabidopsis homolog AtCER1 served as an outgroup for the CER1 clade, providing an evolutionary reference point. The analysis uncovered significant evolutionary patterns among Oryza CER genes. The CER1 clade exhibited an unusual divergence pattern, with its members separating within the Oryza lineage prior to the A. thaliana speciation event (estimated divergence time: 0.29). This early divergence contrasts with the typical duplication patterns observed in Oryza CER1 genes and suggests a unique evolutionary history. Similarly, the CER3 clade showed a parallel pattern of genus-specific divergence preceding A. thaliana speciation (divergence time: 0.27). Three-dimensional structural modeling showed that all six rice CER proteins share high similarity tertiary structures (Figure 1A). In homology-based protein structure prediction, GMQE and sequence identity were applied as key indicators to assess model accuracy and reliability. The analysis yielded robust structural predictions, reflected by high GMQE values and strong sequence identity percentages (Figure 1A). These findings reveal previously unrecognized evolutionary dynamics in the CER1/3 gene family and provide valuable insights for future studies on plant cuticle evolution.
To elucidate the functional roles of the predicted CER1 and CER3 genes, we performed multiple sequence alignments and analyzed conserved domains associated with enzyme catalysis. Consistent with previous studies on Arabidopsis CER1 and CER3 proteins [11,14]. Our analysis revealed critical conserved motifs essential for alkane biosynthesis (Figure 1B). All identified proteins featured an N-terminal ERG3/FAH (fatty acid hydroxylase) domain, characterized by three His-rich motifs (HXXXH and HXXHH), a hallmark of the fatty acid hydroxylase superfamily. The C-terminal region contained the hydrophilic WAX2 domain (~168 aa) (Figure 1B), which is critical for cuticular wax formation [10]. Also, the results showed that all the candidate genes included Nicotinamide adenine dinucleotide (phosphate) (NAD(P))-binding domain. Furthermore, Notably, OsCER1a contains additional functional domains, including a flavoprotein-like domain and a Cytochrome P450 region, which may confer specialized catalytic functions distinct from other CER1 homologs (Figure 1B). These findings underscore the evolutionary conservation of core catalytic residues while highlighting potential functional diversification among rice CER1/3 genes.
3.2. Chromosome Localization and the Conserved Motifs of Rice CER1 and CER3 Genes
The six identified CER1/3 genes (three CER1 and three CER3 homologs) showed a dispersed chromosomal distribution across the rice genome (Figure 2A). Our mapping analysis revealed their locations on five different chromosomes. OsCER1a and OsCER3b were co-localized on chromosome 2, while the remaining genes were each located on separate chromosomes (OsCER1b on chromosome 4, OsCER3a on chromosome 6, OsCER3c on chromosome 9 and OsCER1c on chromosome 10). This widespread genomic arrangement suggests these genes may have arisen through segmental duplication events followed by chromosomal redistribution during rice genome evolution.
Domain architecture analysis demonstrated remarkable conservation among CER1/3 proteins (Figure 2B). Both rice and Arabidopsis homologs shared five characteristic protein motifs (fatty acid hydroxylase, Acyltransferase, Cytochrome P450, ABC Transporter and lipid transfer protein (LTP) motifs), with clear separation into CER1- and CER3-specific groups. The conserved structural features across these dispersed genes indicate strong selective pressure to maintain their biochemical functions despite their genomic redistribution. These findings suggest that while the CER1/3 gene family has undergone chromosomal dispersion during evolution, the essential protein architecture has been strictly preserved to maintain its role in cuticular wax biosynthesis.
3.3. Expression Patterns and Cis-Element Present in the 2 kb Promoter Regions of OsCER1/3s
We analyzed the expression profiles of the OsCER1 and OsCER3 genes across various rice tissues (Figure 3A,B). OsCER1a, OsCER1b and OsCER1c exhibit distinct, tissue-specific expression profiles. OsCER1a is most abundant in florets, moderately present in seedlings, and low in other organs. OsCER1b is also highly floret-enriched, with moderate levels in spikelets. In contrast, OsCER1c is only moderately expressed in seedlings and remains low in all other tissues. Though the transcripts of three OsCER1s are relatively low in leaves, the expression levels of OsCER1a are higher than the other two genes (Figure 3A). OsCER3 genes, particularly OsCER3a and OsCER3b, also showed significant expression in floret and seedling tissues, underlining their important roles in wax production of aerial parts. However, as compared with OsCER3a and OsCER3b, the expression levels of OsCER3c are relatively low across different organs, revealing that it might play a minor role in wax production. Similarly to OsCER1 genes, OsCER3 genes also have low expression levels in leaves, among which OsCER3a expression level is the highest.
Analysis of promoter regions which include 2 kb fragment of the translational start site (ATG) identified 33 cis-acting elements across OsCER1 and OsCER3 genes (https://bar.utoronto.ca/efprice/, accessed on 13 January 2026), which were categorized into three major groups including light-responsive, phytohormone-responsive and stress-related elements (Figure 3C). Light-responsive elements dominated the regulatory landscape, with Box 4 showing particularly high representation in OsCER3c (eight copies) and OsCER3b (five copies), followed by OsCER1c (three copies). The G-box, a canonical light-responsive element, occurred in all OsCER1s and OsCER3s promoters, peaking at four copies in OsCER3c. The prevalence of these light motifs parallels the light-induced wax-component synthesis reported in plants [1,35].
Extensive studies have established that cuticular wax biosynthesis is markedly induced by abiotic cues such as heat, drought and salt, with ABA serving as the central mediator of this process [1]. Consistently, ABRE (ABA-responsive element) is the most abundant hormone motif in OsCER1a (four copies), OsCER3c (three copies) and OsCER1c (two copies). MeJA-responsive TGACG/CGTCA elements are restricted to OsCER3c, OsCER1c and OsCER1a; the defense-related TC-rich repeat occurs only in OsCER1c, and the low-temperature motif I is unique to OsCER3c, together implicating coordinated hormonal and stress signaling in the transcriptional control of wax production [1,36].
To test whether the six rice CER1- and CER3-like genes (OsCER1a/1b/1c and OsCER3a/3b/3c) possess distinct functions under different abiotic stresses, we inspected their transcript profiles (drought, salt, cold, heat, hypoxia) archived in the eFP-Rice database (https://bar.utoronto.ca/efprice, accessed on 13 January 2026). As shown in Figure 3D, OsCER1a is selectively up-regulated by heat and hypoxia; OsCER1c is repressed by drought, salt and cold yet induced by anoxia; OsCER3a remains high except under anoxia; OsCER3b responds positively to drought/salt but negatively to hypoxia; and OsCER3c declines under drought and hypoxia. These divergent transcriptional responses indicate that individual homologs may have evolved distinct, condition-specific roles in helping rice adapt to varying environmental cues.
We next compared the promoter cis-element landscape (Figure 3C) with the stress-expression profiles retrieved from eFP-Rice (Figure 3D). A partial, but incomplete, congruence emerges. The heat- and anoxia-induced expression of OsCER1a coincides with its G-box and ARE motifs; the drought/salt repression yet anoxia induction of OsCER1c aligns with its ABRE and ARE copies; the near-constitutive expression of OsCER3a, except under anoxia, corresponds to an ARE-depleted promoter; and the drought/salt up-regulation but hypoxia down-regulation of OsCER3b matches an MBS-rich, ARE-lacking architecture. Conversely, OsCER3c declines under drought and hypoxia despite carrying both G-box and ARE elements, underscoring that cis-element presence alone is insufficient to predict transcript behavior. These discrepancies—such as OsCER3b responding to drought/salt without canonical ABRE/DRE motifs, and OsCER1a reacting to heat/hypoxia without evident heat-shock or hypoxia elements—emphasize that promoter-based inferences require experimental validation.
3.4. Subcellular Localization of OsCER1s and OsCER3s
Previous studies showed that OsCER1s and OsCER3s are located in various compartments including the nucleus, cytoplasm, plasma membrane and/or endoplasmic reticulum (ER) [37,38,39,40,41]. To resolve these conflicting data, each OsCER1/OsCER3 open reading frame was fused in frame with eYFP and co-expressed in N. benthamiana with an established ER marker. All fusion signals of these fused proteins co-localized with the ER-marker (Figure 4), demonstrating that every member of the OsCER1 and OsCER3 families is exclusively ER-localized. This result aligns with the well-established fact that cuticular wax biosynthesis occurs on the ER membrane and that the enzymes involved in this pathway are predominantly ER-residing [5,6].
3.5. Protein Interactions Detected by LCA
Previous studies have shown that in Arabidopsis CER1 and CER3 are inclined to form the complex during alkane biosynthesis [10]. To determine whether OsCER1 family members likewise interact with any of the OsCER3 homologs, we generated constructs in which OsCER1a, OsCER1b or OsCER1c were fused to nLUC, and OsCER3a, OsCER3b or OsCER3c were fused to cLUC, and then monitored pairwise interactions by LCA in N. benthamiana leaves (Figure 5). Robust and specific luciferase signals were observed for all pairwise combinations of OsCER1s with OsCER3s, whereas the negative control combinations (nLUC and cLUC, OsCER1s-nLUC and cLUC, and nLUC and cLUC-OsCER3s) produced no detectable luminescence. These results demonstrate that OsCER1a, OsCER1b and OsCER1c each interact with OsCER3 homologs, indicating that, as in Arabidopsis, OsCER1 and OsCER3 proteins act as a complex during wax biosynthesis.
3.6. Distinct Roles of OsCER1a and OsCER3s in Shaping Rice Cuticular Wax
To evaluate the roles of OsCER1a and OsCER3s in rice leaf wax synthesis, we first identified four CRISPR-cas9 mutants by sequencing, including oscer1a, oscer3a, oscer3b and oscer3c (Figure S1). oscer1a suffered a 1 bp “G” deletion in exon 1, thus shifting the downstream reading frame (Figure S1A). The oscer3a mutant was truncated by a 320 bp fragment removal that spans exons 2–3 and eliminates 136 bp after the start codon (Figure S1B); the deletion was further verified by PCR (Figure S1E). In oscer3b, a single “A” insertion in exon 3 produced a premature stop, whereas oscer3c lost 2 bp (“GC”) from exon 2, once again causing a frameshift (Figure S1C,D). All four mutant lines (oscer1a, oscer3a, oscer3b and oscer3c) were derived directly from the T1 seed that had already segregated away from the Cas9 transgene, and their Cas9-free status was verified by PCR (Figure S2), eliminating any residual editing or off-target activity.
We next surveyed the cuticular wax profiles of the single mutants. Loss of OsCER1a selectively reduced C30 and C32 aldehydes together with C30 primary alcohol while simultaneously elevating C26 and C32 fatty acids; consequently, total wax loads remained statistically unchanged (Figure 6A,B). Among the OsCER3s alleles, oscer3a presented the most severe phenotype: nearly every wax class—except esters—collapsed, driving total wax coverage down to only 19.6% of wild-type levels (Figure 6C). In contrast, oscer3b plants were virtually indistinguishable from the wild type, indicating that OsCER3b contributes little to wax biosynthesis under our growth conditions (Figure 6C). The oscer3c mutant exhibited an intermediate profile: C28 and C30 fatty acids dropped to 26.8% and 18.1%, respectively, while C34 aldehyde fell to 29.4% (Figure 6C). Because these compounds represent minor fractions of the rice wax loads, their reduction translated into no change in overall wax abundance (Figure 6D). These results revealed that in the rice leaf wax production process, OsCER3a plays a major role, while OsCER3b and OsCER3c play minor roles. No visible phenotypic differences were observed among oscer1a, oscer3b, or oscer3c mutants and the wild type, whereas oscer3a plants—owing to a drastic cuticular wax deficit—displayed markedly reduced seed set, indicating that only OsCER3a loss disrupts fertility; this parallels the fertility defects reported for Arabidopsis cer3 mutants [11].
3.7. Ectopic Expression of OsCER1a and Overexpression of AtCER1 in Arabidopsis Differentially Affect Wax Biosynthesis
CER1 encodes the rate-limiting alkane-forming enzyme of cuticular wax biosynthesis [8,10,15]. The Arabidopsis cuticle is alkane-dominated, whereas the rice cuticle contains markedly lower alkane abundance. This compositional disparity raises the question of whether AtCER1 and OsCER1 differ in intrinsic catalytic capacity. To address this, 35S:OsCER1a-eYFP and 35S:AtCER1-eYFP were individually transformed into Arabidopsis. To verify robust overexpression of OsCER1a and AtCER1 in Arabidopsis, we first performed RT-qPCR on independent T1 lines including OsCER1a OE-4, OsCER1a OE-6, AtCER1 OE-1 and AtCER1 OE-2. RT–qPCR showed a high accumulation of OsCER1a transcripts in the two independent overexpression lines OsCER1a OE-4 and OsCER1a OE-6 (Figure 7A). The expression level of AtCER1 in AtCER1 OE-1 and AtCER1 OE-2 increased by about 65-fold than in wild-type Col-0 (Figure 7B). All transgenes are C-terminally tagged with eYFP, allowing direct assessment of protein accumulation by confocal microscopy. Strong cytoplasmic eYFP fluorescence was detected exclusively in the four overexpression lines; no signal was observed in untransformed control Col-0 (Figure S3). These data confirmed that both OsCER1a and AtCER1 are successfully transcribed and translated in OE lines. These transgenic plants were subjected to quantitative wax analysis. Total leaf cuticular wax loads are increased in all transgenic OE plants (Figure 7C); however, 35S:AtCER1-eYFP OE lines accumulated significantly greater wax loads than 35S:OsCER1a-eYFP OE lines (Figure 7C). The transformed lines carrying 35S:OsCER1a-eYFP showed modest increases of 25.5% (OsCER1a OE-4) and 75.4% (OsCER1a OE-6) relative to wild type, whereas 35S:AtCER1-eYFP OE lines exhibited pronounced elevations of 158.6% (AtCER1 OE-1) and 184.5% (AtCER1 OE-2). Detailed profiling revealed that OsCER1a overexpression specifically boosted C27 alkane and C29 branched-chain alkane, with only minor changes in other wax fractions. By contrast, AtCER1 overexpression triggered a broad metabolic shift, markedly increasing C26 and C28 primary alcohols, C27–C31 and C33 n-alkanes, as well as C29 and C31 branched alkanes (Figure 7D). Collectively, ectopic OsCER1a overexpression produced only a modest increase in total wax loads, whereas AtCER1 overexpression resulted in a substantially higher enhancement. These results suggest that OsCER1a may have undergone evolutionary attenuation of its alkane-forming activity; the mechanistic basis for this functional divergence remains to be elucidated.
4. Discussion
4.1. OsCER3a Emerges as a Prime Target for Precision Engineering of Cuticle Traits in Rice
CER3 was initially identified to be involved in the alkane-forming pathway [10], yet our recent evidence indicates that it additionally governs carbon allocation into both alkane- and alcohol-forming pathways [8]. Rice harbors three CER3 paralogs, but only OsCER3a seems to play dominant roles in wax synthesis. The expression levels of OsCER3a are higher than those of OsCER3b and OsCER3c (Figure 3B,D). Consistent with its expression profile, oscer3a null mutants display a drastic reduction in total cuticular wax (Figure 6). Moreover, we noticed that most of the wax components derived from alcohol- and alkane-forming pathways decreased in the oscer3a mutant, confirming its core roles in channeling the carbon resources into alkane- and alcohol-forming pathways in rice as well. Thus, OsCER3a represents an optimal genetic target for engineering wax composition and enhancing stress tolerance in rice.
4.2. The Expression Patterns of OsCER1 and OsCER3 Homology Genes Tightly Mirror Their Biological Functions
RT-qPCR results showed that most of the OsCER1 and OsCER3 homology genes are highly expressed in florets, whereas they are less expressed in leaves (Figure 3A,B). This is closely related to their biological functions since CER1 and CER3 are reported to form a complex participating in the alkane-forming pathway [8,10,14]. In rice, alkanes play a predominant role in florets but play a subordinate role in leaves (Figure 6) [41,42]. The distribution patterns might be associated with the circumstance where leaves and florets are situated. Rice leaves grow in a persistently moist, hydrophilic microenvironment, whereas the panicle and its florets sit at the aerial apex, exposed to a noticeably drier and hydrophobic atmosphere. Alkanes are nonpolar molecules and thus play dominant roles in floret waxes but only play subordinary roles in leaf waxes. By contrast, the primary alcohols, like polar molecules, exhibit an opposite distribution pattern (Figure 6). The relationship between wax distribution pattern and moisture conditions is not seen in the same plants, which is also seen in plants growing in different conditions. For example, rice waxes are dominated by primary alcohols, while Arabidopsis cultivated in soil contains waxes rich in alkanes (Figure 6 and Figure 7). This phenomenon seems common. One previous study performed in various plants growing in different conditions also demonstrated that the plants growing in arid conditions usually contain high amounts of non-poplar molecules, such as alkanes and esters, whereas those plants residing in high-humidity environments preferentially produce waxes consisting of poplar molecules, including fatty acids and primary alcohols [43]. Collectively, these findings demonstrate that wax deposition is environmentally orchestrated to shield plants from diverse stresses.
4.3. The Subcellular Localization of OsCER3a and OsCER3c
Our results showed that OsCER1s and OsCER3s are all localized in ER (Figure 5), among which the localization patterns of OsCER1a, OsCER1c and OsCER3a are consistent with previous studies [38,39,41]. However, the expression pattern of OsCER3c identified in our study is different from that of a previous study, which identified that this protein resides in the plasma membrane [40]. The discrepancy between the two results might result from the usage of different materials. In our study, tobacco cells were used, while onion cells were used instead in the previous study [40]. Moreover, in our study the ER marker was co-transformed with the target genes, which could precisely define the exact sites where the protein resides. However, no marker was used in the previous study, thus possibly causing the misstatement of protein location patterns. In fact, a similar pattern is observed for OsCER3a. One previous study performed in onion cells revealed that this protein is located in various compartments, including the nucleus, cytoplasm, and plasma membrane [37], whereas a later study carried out in rice and Arabidopsis protoplasts that included ER markers clearly placed the protein in the ER. Collectively, these examples underscore that co-expression of appropriate organelle markers is essential to define the exact localization patterns of a certain protein.
4.4. Functional Divergence Between OsCER1a and AtCER1 in Arabidopsis Wax Synthesis
OsCER1a and AtCER1 showed high sequence identity (Figure 2), implying functional conservation. However, when expressed in Arabidopsis, their capacities to drive alkane synthesis diverge markedly: AtCER1 overexpression triggers a substantial wax buildup, whereas OsCER1a overexpression exerts only a modest effect. This quantitative disparity suggests that OsCER1a might have undergone evolutionary attenuation of its alkane-forming activity, mirroring the relaxed selective pressure for high alkane output in the monocot lineage. Nevertheless, obtained from a heterologous dicot background, the data may be influenced by several non-mutually exclusive factors that could widen the functional gap; the comparatively low wax accumulation driven by OsCER1a expression may stem from a combination of the following possibilities. First, monocot genes are GC-rich and prefer G/C-ending codons, whereas dicots possess a tRNA isoacceptor pool skewed toward A/T-ending triplets [44,45]. Thus, the transplanted OsCER1a mRNA in a dicot cell might encounter tRNA scarcity, ribosomal pausing, and accelerate mRNA decay, yielding low protein levels. Second, monocots and dicots have evolved distinct enzymatic contexts. For example, the rice hydroxysteroid dehydrogenase OsHSD1 generates primary alcohols [46], and the Arabidopsis AtSOH1 performs an equivalent role [8]; however, our phylogenetic analysis reveals low sequence identity between them. Consequently, although monocot and dicot homologs catalyze the same reaction, each demands its specific partners and catalytic conditions, and any mismatch can affect enzyme activity. These hypotheses await further experimental validation.
5. Conclusions
Our study classified OsCER1 and OsCER3 into two distinct subgroups, despite their origin from a common ancestor. RT-qPCR analyses revealed that these genes exhibit divergent expression patterns across different organs. Notably, OsCER1a and OsCER3a showed significantly higher expression levels in leaves compared to their respective paralogs. Subcellular localization via LCA confirmed that both OsCER1 and OsCER3 proteins are localized to the endoplasmic reticulum (ER), consistent with their predicted physiological roles in wax biosynthesis. Moreover, protein–protein interaction assays indicated that OsCER1s interact with OsCER3s, mirroring the conserved interaction observed between AtCER1 and AtCER3 in Arabidopsis and suggesting functional conservation of the CER1–CER3 module across dicots and monocots. Phenotypic analysis of transgenic plants overexpressing or lacking OsCER1 or OsCER3 genes revealed that OsCER3a plays a predominant role in cuticular wax biosynthesis, while the other paralogs contribute to a lesser extent. Collectively, our findings enhance the understanding of the functional divergence and redundancy among OsCER1 and OsCER3 genes in rice wax production and identify OsCER3a as a promising genetic target for enhancing cuticular wax formation, improving stress tolerance and supporting breeding strategies aimed at developing stress-resilient rice varieties. Additionally, stress-responsive promoter elements and expression patterns indicate that some homologs, such as OsCER1c and OsCER3c, may function under conditions like drought or hypoxia. Therefore, future research should define the catalytic roles of OsCER1–OsCER3 combinations and systematically evaluate stress-specific functions of individual homologs under diverse stresses to reveal their condition-specific roles in wax biosynthesis and stress resilience.
The reference list from the paper itself. Each links out to its DOI / PubMed record.
- 1Lewandowska M. Keyl A. Feussner I. Wax biosynthesis in response to danger: Its regulation upon abiotic and biotic stress New Phytol.202022769871310.1111/nph.1657132242934 · doi ↗ · pubmed ↗
- 2Shim Y. Seong G. Choi Y. Lim C. Baek S.-A. Park Y.J. Kim J.K. An G. Kang K. Paek N.C. Suppression of cuticular wax biosynthesis mediated by rice LOV KELCH REPEAT PROTEIN 2 supports a negative role in drought stress tolerance Plant Cell Environ.2023461504152010.1111/pce.1454936683564 · doi ↗ · pubmed ↗
- 3Grünhofer P. Zhang Q. Vitt S. Stöcker T. Malkowsky Y. Brügmann T. Fladung M. Schreiber L. Changes in wax composition but not amount enhance cuticular transpiration Plant Cell Environ.2024479110510.1111/pce.1471937718770 · doi ↗ · pubmed ↗
- 4Negin B. Shachar L. Meir S. Ramirez C.C. Horowitz A.R. Jander G. Aharoni A. Fatty alcohols, a minor component of the tree tobacco surface wax, are associated with defence against caterpillar herbivory Plant Cell Environ.20244766468110.1111/pce.1475237927215 · doi ↗ · pubmed ↗
- 5Lee S.B. Suh M.C. Advances in the understanding of cuticular waxes in Arabidopsis thaliana and crop species Plant Cell Rep.20153455757210.1007/s 00299-015-1772-225693495 · doi ↗ · pubmed ↗
- 6Bernard A. Joubès J. Arabidopsis cuticular waxes: Advances in synthesis, export and regulation Prog. Lipid Res.20135211012910.1016/j.plipres.2012.10.00223103356 · doi ↗ · pubmed ↗
- 7Rowland O. Zheng H. Hepworth S.R. Lam P. Jetter R. Kunst L. CER 4 encodes an alcohol-forming fatty acyl-coenzyme A reductase involved in cuticular wax production in Arabidopsis Plant Physiol.200614286687710.1104/pp.106.08678516980563 PMC 1630741 · doi ↗ · pubmed ↗
- 8Li S. Zhang X. Huang H. Yin M. Jenks M.A. Kosma D.K. Yang P. Yang X. Zhao H. LüS. Deciphering the core shunt mechanism in Arabidopsis cuticular wax biosynthesis and its role in plant environmental adaptation Nat. Plants 20251116517510.1038/s 41477-024-01892-939753959 · doi ↗ · pubmed ↗