Association between long-term healthy aging trajectories and all-cause mortality among middle-aged and older adults
Min Soo Kim, Hyun-Joo Kim, Jang Mook Kim

TL;DR
This study shows that unhealthy aging patterns are linked to higher death rates in middle-aged and older adults, especially in women and younger seniors.
Contribution
The study identifies distinct aging trajectories and their mortality risks, emphasizing gender and age-specific differences.
Findings
Moderate and severe unhealthy aging groups had significantly higher all-cause mortality compared to sustained healthy aging.
Females and those aged 45–64 years showed notably higher mortality risks in unhealthy aging groups.
Kaplan–Meier curves confirmed significant survival differences across aging trajectory groups.
Abstract
Healthy aging is associated with lower mortality and better quality of life. This observational study examines how different healthy aging trajectories relate to all-cause mortality in middle-aged and older adults and seeks to identify subgroups at elevated risk based on individual characteristics. We used data from the Korean Longitudinal Study of Aging (KLoSA) collected between 2006 and 2020. The analytic sample comprised 4,168 adults aged 45 years and older. Healthy aging trajectories were derived from 2006 to 2014 using group-based trajectory modeling (GBTM) applied to a composite score (range 0–5) constructed from five binary domains: presence of chronic disease(s), limitations in activities of daily living (ADL), depressive symptoms, cognitive impairment (MMSE-K), and lack of social participation. Four trajectory groups were identified: sustained healthy aging, mild unhealthy…
Genes, proteins, chemicals, diseases, species, mutations and cell lines named across the full text — each resolved to its canonical identifier and authoritative record.
Click any figure to enlarge with its caption.
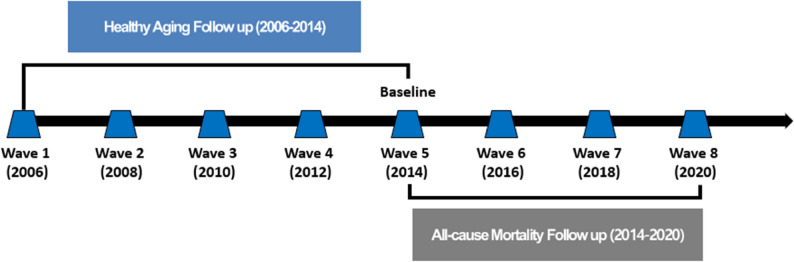 Figure 1
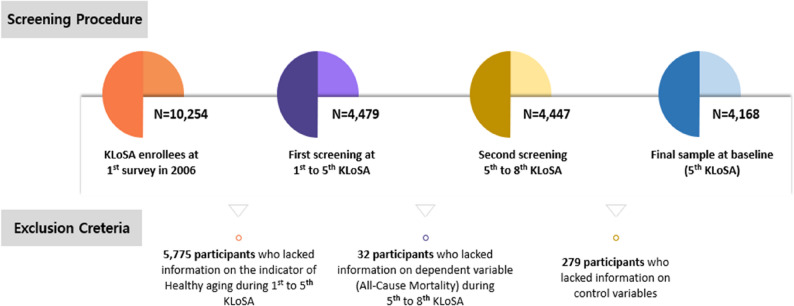 Figure 2
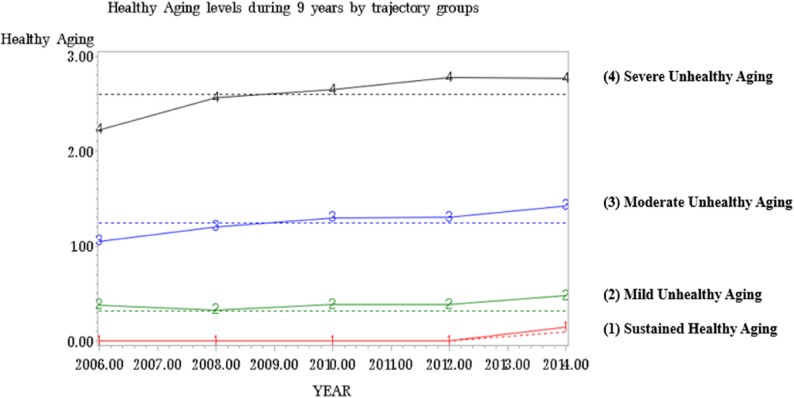 Figure 3
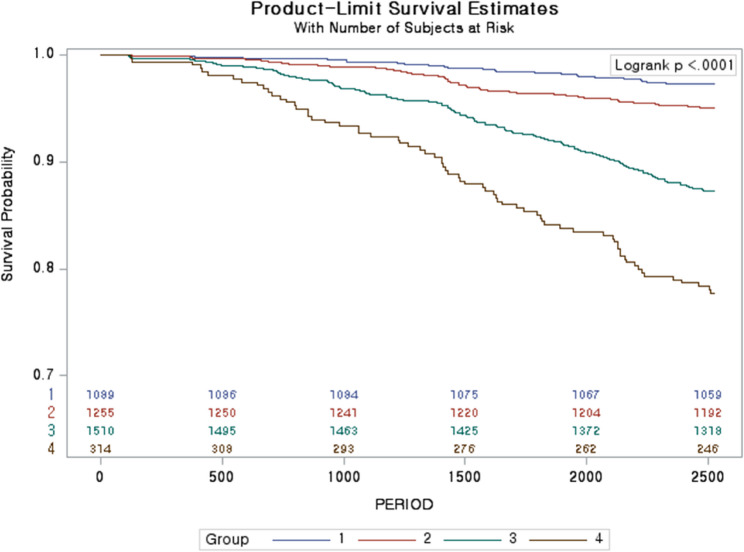 Figure 4
Peer Reviews
No public reviews on file for this paper yet. If you reviewed it on a platform where reviews are public (OpenReview, ICLR, NeurIPS, ICML), you can paste yours below so the community can read it here.
Videos
No videos yet. Explain this paper in a talk, walkthrough, or lecture? Add one.
Taxonomy
TopicsAging and Gerontology Research · Health disparities and outcomes · Frailty in Older Adults
Text box 1. Contributions to the literature• This is the first nationally representative Korean analysis linking long-term, multidomain healthy aging trajectories (2006–2014) with subsequent seven-year all-cause mortality.• The study models longitudinal trajectories rather than single time-point measures, enabling identification of individuals on worsening health paths.• The analysis includes middle-aged adults (45–64 years), highlighting midlife as a practical window for prevention.• The study uses a simple, non-clinical composite measure feasible for community or primary-care screening.• It identifies high-risk subgroups by gender and age to guide targeted public-health strategies and resource allocation.
Introduction
Population aging is accelerating worldwide due to improvements in medical care, technology, and living standards. In South Korea, the proportion of people aged 65 years and over exceeded 14% of the population in 2017 and reached approximately 18.4% by 2023, with projections indicating rapid further growth by 2050 [1, 2]. Aging increases the prevalence of multimorbidity and functional decline and raises the risks of social isolation and economic vulnerability, all of which impose growing demands on health and social care systems [3–7].
The World Health Organization defines healthy aging as “the process of developing and maintaining functional ability that enables well-being in older age,” highlighting multidimensional functioning rather than the mere absence of disease [8]. Prior research has linked healthy aging measures — including physical function, cognition, and selected biomarkers — to mortality and other adverse outcomes [9–15]. However, most existing studies have important limitations: they are frequently based on Western cohorts, often focus only on older adults (commonly ≥ 60 years), and typically use single time-point measures rather than characterizing long-term patterns of change [9–16]. Few nationally representative Asian studies have examined how long-term, multidomain aging patterns relate to mortality, and evidence on middle-aged adults (45–64 years) is especially scarce despite the policy relevance of earlier intervention.
In the Korean context, rapid demographic change, shifting family structures, and uneven regional resources shape both the distribution of aging trajectories and the feasibility of community-based interventions [17–19]. Although national policies (e.g., Health Plan initiatives and community care programs) aim to promote older adults’ health, many programs remain primarily health-service centric and may not sufficiently target social participation, mental health, or early prevention in midlife. Longitudinal trajectory evidence using nationally representative Korean data can therefore inform more precisely targeted prevention and resource allocation.
To address these gaps, we analyzed data from the Korean Longitudinal Study of Aging (KLoSA) to (1) identify long-term healthy aging trajectories using a five-domain composite measure and group-based trajectory modeling (GBTM) over 2006–2014, and (2) quantify the association between these trajectories and subsequent all-cause mortality during 2014–2020. Our study makes four key contributions: use of a multidomain, non-clinical healthy aging index; modeling of long-term trajectories rather than single time-point status; inclusion of middle-aged as well as older adults; and stratified analyses by gender and age group in a nationally representative Asian panel study. These features enhance the study’s policy relevance by identifying vulnerable subgroups who may benefit from earlier or more tailored interventions.
Methods
Data source and study subjects
This study used data from the Korean Longitudinal Study of Aging (KLoSA), administered by the Korea Employment Information Service, covering waves 1–8 (2006–2020). The study protocol was approved by the Institutional Review Board of Dankook University (IRB FILE No. 2024-10-024). KLoSA is a nationally representative biennial panel of individuals aged 45 years and older, designed to monitor social, economic, and health conditions in Korea [20]. For this analysis, we used waves 1–5 (2006–2014) to derive healthy aging trajectories and waves 5–8 (2014–2020) for mortality follow-up, with wave 5 (Aug 1, 2014) set as the baseline for survival analysis (Fig. 1). After applying exclusion criteria, the final analytic sample comprised 4,168 participants (Fig. 2).
Fig. 1. Tracking healthy aging trajectories (2006–2014) and subsequent all-cause mortality (2014–2020) among adults aged 45 years and older in Korea
Fig. 2. Flow diagram of participant selection from the Korean Longitudinal Study of Aging for the analytic sample (waves 1–8, 2006–2020)
Independent variable: healthy aging
Healthy aging was operationalized as a composite of five binary domains: (1) self-reported chronic disease(s) (history of cancer, heart disease, chronic lung disease, diabetes, or cerebrovascular disease), (2) limitations in activities of daily living (ADL), (3) depressive symptoms (any of four screening items in the past week), (4) cognitive impairment (Mini-Mental State Examination (Korean version, MMSE-K) ≤ 23), and (5) lack of social participation. Each domain was coded 0/1 and summed (range 0–5), with higher scores indicating poorer healthy aging. These five domains were selected to capture the multidimensional construct of healthy aging (physical health, functional independence, mental health, cognition, and social engagement), consistent with prior work and policy frameworks [1, 8, 21] (Table S1).
Dependent variable: all-cause mortality
All-cause mortality during 2014–2020 was ascertained from KLoSA exit interviews and linked mortality data. Time at risk was defined from the baseline interview (Aug 1, 2014) to the date of death, last contact, or end of follow-up (Dec 31, 2020), whichever occurred first. Participants without a recorded date of death by Dec 31, 2020 were censored at that date.
Control variables
Control variables, selected a priori to control for confounding, comprised baseline sociodemographic, economic, lifestyle, and health-related characteristics: age (45–64, 65–74, ≥ 75), gender, educational level (≤ elementary, middle, high, ≥college), marital status (married vs. unmarried), residential area (metropolis/urban/rural), personal gross income (quintiles), current economic activity (employed vs. unemployed), current smoking and drinking, regular exercise (≥ 1 time/week), living alone, disability (physician diagnosed), subjective health status (good vs. bad), overall quality of life (0–100, categorized), and self-reported difficulty in daily activities due to vision or hearing impairment. Exact questionnaire items, response categories, and recoding rules are reported in Table S2 for transparency and reproducibility.
Statistical analysis
The analysis employed a complete-case approach after excluding participants with missing values on independent, dependent, or control variables (exclusion counts are shown in Fig. 2). Sample characteristics were summarized with frequencies and percentages and compared using chi-square tests. Longitudinal healthy aging trajectories (2006–2014) were derived using group-based trajectory modeling (GBTM) implemented via PROC TRAJ in SAS. GBTM is a finite-mixture (latent-class) approach that estimates a set of group-specific polynomial trajectories to describe heterogeneity in longitudinal patterns and assigns individuals to the class with the highest posterior probability [22]. The CNORM (censored normal) specification was used to accommodate the bounded 0–5 composite healthy aging score. Candidate solutions with varying numbers of classes and polynomial orders (intercept, linear, quadratic, cubic) were compared using Bayesian Information Criterion (BIC), Average Posterior Probabilities (APP) (≥ 0.70), class sizes, and interpretability [23]; model selection statistics are reported in Table S3 and the selected 4-class solution is shown in Fig. 3. Associations between trajectory class and all-cause mortality were estimated using Cox proportional hazards models with robust standard errors; hazard ratios (HR) and 95% confidence intervals (CI) are reported. The proportional hazards assumption was evaluated graphically (log[− log] survival plots) and by Schoenfeld residual tests. In addition, the same covariates were included in stratified analyses for key variables such as gender and age, and additional sensitivity analyses were conducted using alternative age cut-offs (e.g., age ≥ 60 and ≥ 65). All statistical analyses were performed in SAS version 9.4 (SAS Institute Inc., Cary, NC).
Fig. 3. Healthy aging trajectories identified by group-based trajectory modeling among adults aged 45 years and older in Korea (2006–2014). KLoSA: Korean Longitudinal Study of Aging
Results
Trajectories of healthy aging
Figure 3 illustrates the four healthy aging trajectories identified among 4,168 participants over 2006–2014: sustained healthy aging (n = 1,089, 26.1%), mild unhealthy aging (n = 1,255, 30.1%), moderate unhealthy aging (n = 1,510, 36.2%), and severe unhealthy aging (n = 314, 7.5%).
Sample characteristics and mortality distribution
Overall mortality during 2014–2020 was 8.5% (n = 355). The distribution of deaths across trajectory groups was: sustained healthy aging 8.5% (n = 30), mild unhealthy aging 17.7% (n = 63), moderate unhealthy aging 54.1% (n = 192), and severe unhealthy aging 19.7% (n = 70) (χ² = 176.7, p < 0.001) (Table 1).
Table 1. Baseline characteristics of study participants aged 45 years and older in Korea at wave 5 (n = 4,168)VariablesTotalAll-cause MortalityYesNo N % N % N %χ2P-value* Trajectory Healthy Aging 176.7< 0.001 Group 1: Sustained Healthy Aging1,08926.1308.51,05927.8 Group 2: Mild Unhealthy Aging1,25530.16317.71,19231.3 Group 3: Moderate Unhealthy Aging1,51036.219254.11,31834.6 Group 4: Severe Unhealthy Aging3147.57019.72446.4 Age 329.9< 0.001 45–641,91045.84913.81,86148.8 65–741,35532.59927.91,25632.9 75-90321.720758.369618.3 Gender 25.3< 0.001 Male1,62939.118351.51,44637.9 Female2,53960.917248.52,36762.1 Education Level 89.1< 0.001 ≤ Elementary school1,72441.423064.81,49439.2 Middle school75818.24512.771318.7 High school1,24329.85615.81,18731.1 ≥ College44310.6246.841911.0 Marital Status 57.2< 0.001 Married3,27578.622362.83,05280.0 Unmarried89321.413237.276120.0 Residential Area 16.50.000 Metropolis1,71241.113237.21,58041.4 Urban1,38533.210028.21,28533.7 Rural1,07125.712334.694824.9 Personal Gross Income 90.7< 0.001 Quartile 1 (low)81219.55114.476120.0 Quartile 281219.59526.871718.8 Quartile 385120.412735.872419.0 Quartile 490921.84913.886022.6 Quartile 5 (high)78418.8339.375119.7 Current Economic Activity 47.3< 0.001 Employed1,76442.38925.11,67543.9 Unemployed2,40457.726674.92,13856.1 Current Smoking 1.40.235 Yes49411.94913.844511.7 No3,67488.130686.23,36888.3 Current Drinking 18.3< 0.001 Yes1,41533.98423.71,33134.9 No2,75366.127176.32,48265.1 Regular Exercise 14.70.000 Yes1,46835.29225.91,37636.1 No2,70064.826374.12,43763.9 Living Alone 13.80.000 Yes54513.16919.447612.5 No3,62386.928680.63,33787.5 Disability 4.90.026 Yes170.441.1130.3 No4,15199.635198.93,80099.7 Subjective Health Status 148.8< 0.001 Good3,21977.218251.33,03779.6 Bad94922.817348.777620.4 Overall Quality of Life 70.7< 0.001 Low53312.89627.043711.5 High3,63587.225973.03,37688.5 Vision 7.60.006 Yes992.4164.5832.2 No4,06997.633995.53,73097.8 Hearing 57.8< 0.001 Yes872.1277.6601.6 No4,08197.932892.43,75398.4 Total 4,168100.03558.53,81391.5^*^Chi-square tests
Association between healthy aging trajectory and all-cause mortality
The proportional hazards assumption was assessed using log(− log[survival]) plots and Schoenfeld residual tests; no evidence of violation was observed. In multivariable Cox models adjusted for demographic and health covariates (Table 2), participants in the moderate unhealthy aging group had a higher risk of all-cause mortality compared with the sustained healthy aging group (HR = 1.946; 95% CI, 1.282–2.954; p = 0.002), and those in the severe unhealthy aging group also showed higher risk (HR = 2.222; 95% CI, 1.353–3.648; p = 0.002). Kaplan–Meier curves demonstrated significant differences in survival across trajectory groups (log-rank p < 0.001; Fig. 4). Overall, mortality risk increased progressively with worsening healthy aging trajectories.
Table 2. Association between healthy aging trajectory(2006–2014) and all-cause mortality (2014–2020) among adults aged 45 years andolder in KoreaVariablesAll-cause MortalityHR95% CIP-value Trajectory Healthy Aging Group 1: Sustained Healthy Aging1.000 Group 2: Mild Unhealthy Aging1.2340.791-1.9240.354 Group 3: Moderate Unhealthy Aging1.9461.282-2.9540.002 Group 4: Severe Unhealthy Aging2.2221.353-3.6480.002 Age 45–641.000 65–741.7421.193-2.5420.004 75-3.7382.539-5.503< 0.001 Gender Male3.5622.703-4.695< 0.001 Female1.000 Education Level ≤ Elementary school1.3340.825-2.1570.241 Middle school1.0650.637-1.7820.809 High school1.0300.630-1.6840.905 ≥ College1.000 Marital Status Married1.000 Unmarried1.9181.410-2.607< 0.001 Residential Area Metropolis1.000 Urban0.8030.616-1.0470.106 Rural1.0390.797-1.3540.777 Personal Gross Income Quartile 1 (low)1.4370.882-2.3410.145 Quartile 21.1790.745-1.8640.483 Quartile 31.4240.924-2.1940.109 Quartile 40.9130.575-1.4500.701 Quartile 5 (high)1.000 Current Economic Activity Employed1.000 Unemployed1.2170.906-1.6330.192 Current Smoking Yes1.1930.855-1.6650.300 No1.000 Current Drinking Yes0.6290.478-0.8270.001 No1.000 Regular Exercise Yes1.000 No1.2330.953-1.5950.111 Living Alone Yes0.6340.450-0.8920.009 No1.000 Disability Yes0.8620.313-2.3770.775 No1.000 Subjective Health Status Good1.000 Bad1.6221.284-2.050< 0.001 Overall Quality of Life Low1.4221.101-1.8360.007 High1.000 Vision Yes0.6560.387-1.1100.116 No1.000 Hearing Yes1.5521.025-2.3500.038 No1.000HR Hazard Ratio, CI Confidence Interval
Fig. 4. Kaplan–Meier plots of cumulative survival by healthy aging trajectory group among adults aged 45 years and older in Korea (baseline Aug 1, 2014; follow-up to Dec 31, 2020)
Stratified analyses by gender and age
Among female, the moderate (HR = 4.793; 95% CI, 1.833–12.534; p = 0.001) and severe (HR = 7.109; 95% CI, 2.592–19.498; p = 0.001) unhealthy aging groups exhibited markedly higher mortality risk relative to the sustained healthy aging group (Table 3). By age group, participants aged 45–64 years in the mild (HR = 2.493; 95% CI, 1.121–5.547; p = 0.025) and moderate (HR = 2.578; 95% CI, 1.092–6.082; p = 0.031) unhealthy aging groups showed elevated risk; among those aged ≥ 65 years, the moderate (HR = 1.738; 95% CI, 1.078–2.802; p = 0.023) and severe (HR = 2.125; 95% CI, 1.232–3.666; p = 0.007) groups were associated with higher mortality (Table 4).
Table 3. Association between healthy aging trajectory (2006–2014) and all-cause mortality (2014–2020), stratified by gender Variables
** All-cause Mortality**
Gender
Male
HR
95% CI
P -value
Trajectory Healthy Aging Group 1: Sustained Healthy Aging1.000 Group 2: Mild Unhealthy Aging1.1450.691-1.8990.599 Group 3: Moderate Unhealthy Aging1.5000.934-2.4100.094 Group 4: Severe Unhealthy Aging0.8150.375-1.7690.605 Variables
Female
HR
95% CI
P -value
Trajectory Healthy Aging Group 1: Sustained Healthy Aging1.000 Group 2: Mild Unhealthy Aging1.9500.710-5.3520.195 Group 3: Moderate Unhealthy Aging4.7931.833-12.5340.001 Group 4: Severe Unhealthy Aging7.1092.592-19.4980.000HR Hazard Ratio, CI Confidence IntervalAdjusted age, education level, marital status, residential area, personal gross income, current economic activity, current smoking, current drinking, regular exercise, living alone, disability, subjective health status, overall quality of life, vision, hearing
Sensitivity analyses by older age cut-offs
When using alternative age thresholds (age ≥ 60 and age ≥ 65) (Table 5), the moderate and severe unhealthy aging groups remained associated with higher mortality among those aged ≥ 60 (HR = 1.760; 95% CI, 1.134–2.732; p = 0.012 and HR = 1.937; 95% CI, 1.157–3.243; p = 0.012, respectively), whereas at age ≥ 65 only the severe group remained significantly associated with higher risk (HR = 1.824; 95% CI, 1.053–3.159; p = 0.032).
Table 4. Association between healthy aging trajectory (2006–2014) and all-cause mortality (2014–2020), stratified by age group Variables
All-cause Mortality
Age
45–64
HR
95% CI
P -value
Trajectory Healthy Aging Group 1: Sustained Healthy Aging1.000 Group 2: Mild Unhealthy Aging2.4931.121-5.5470.025 Group 3: Moderate Unhealthy Aging2.5781.092-6.0820.031 Group 4: Severe Unhealthy Aging1.2900.142-11.7410.821 Variables
≤ 65
HR
95% CI
P -value
Trajectory Healthy Aging Group 1: Sustained Healthy Aging1.000 Group 2: Mild Unhealthy Aging0.9380.551-1.5960.813 Group 3: Moderate Unhealthy Aging1.7381.078-2.8020.023 Group 4: Severe Unhealthy Aging2.1251.232-3.6660.007HR Hazard Ratio, CI Confidence IntervalAdjusted gender, education level, marital Status, residential area, personal gross income, current economic activity, current smoking, current drinking, regular exercise, living alone, disability, subjective health status, overall quality of life, vision, hearing
Table 5. Sensitivity analyses of associations between healthy aging trajectories and all-cause mortality using alternative age cut-offs among Korean adults Variables
All-cause Mortality
60-
HR
95% CI
P -value
Trajectory Healthy Aging Group 1: Sustained Healthy Aging1.000Group 2: Mild Unhealthy Aging1.0110.624-1.6370.965Group 3: Moderate Unhealthy Aging1.7601.134-2.7320.012Group 4: Severe Unhealthy Aging1.9371.157-3.2430.012 Variables
65-
HR
95% CI
P -value
Trajectory Healthy Aging Group 1: Sustained Healthy Aging1.000Group 2: Mild Unhealthy Aging0.8730.513-1.4880.618Group 3: Moderate Unhealthy Aging1.6040.994-2.5900.053Group 4: Severe Unhealthy Aging1.8241.053-3.1590.032HR Hazard Ratio, CI Confidence IntervalAdjusted age, education level, marital status, residential area, personal gross income, current economic activity, current smoking, current drinking, regular exercise, living alone, disability, subjective health status, overall quality of life, vision, hearing
Discussion
Long-term trajectories of healthy aging were strongly associated with subsequent all-cause mortality. Compared with the sustained healthy aging trajectory, membership in the moderate and severe unhealthy aging trajectories was associated with substantially higher mortality after adjustment for baseline covariates; these associations were most pronounced among female and among adults aged 45–64 years. By modeling multidomain healthy aging longitudinally and including middle-aged as well as older adults in a Korean sample, the study extends prior work that has largely relied on single time-point measures or Western cohorts [9–11, 13–15, 24].
Our results indicate a graded relationship between worsening aging trajectories and mortality risk: participants whose composite scores worsened or remained poor over the 2006–2014 period experienced higher hazards of death during 2014–2020. This pattern plausibly reflects cumulative loss of physiological reserve and functional capacity (physical, cognitive, mood, and social domains), increasing vulnerability to acute illness, complications, and fatal outcomes [25–31]. The stronger associations observed among female may reflect an interaction of biological and social factors — such as postmenopausal hormonal changes, differing comorbidity and disability patterns, and socioeconomic or healthcare access disparities — that amplify the downstream mortality impact of long-standing deficits [32–36]. Importantly, our finding that adverse trajectories in the 45–64 age group predict mortality underscores the relevance of midlife health patterns: declines that begin or consolidate in midlife may accelerate risk later, suggesting a window for earlier detection and intervention [37–42].
Compared with previous studies using clinical biomarkers or single-domain measures, our use of a non-clinical, multidomain composite has practical advantages for community surveillance and primary-care screening because it relies on feasible assessments (self-report, brief cognition, ADL, and social participation) that nonetheless capture heterogeneity relevant for mortality prediction [9, 10, 13–15]. The identification of trajectory-defined subgroups provides actionable stratification: it highlights not only who has worse health at one time point but who is on a worsening path, which has different implications for prevention and resource allocation.
These patterns are also likely to be reinforced by interactions among multimorbidity, functional decline, and treatment complexity. Individuals with multiple chronic conditions commonly face polypharmacy and higher care complexity, which may reduce physiological resilience and increase vulnerability to infection and adverse outcomes [31, 43, 44]. Mental health problems such as depression and anxiety often co-occur with functional decline and may impair healthcare utilization or adherence, contributing to higher mortality risk [1, 21, 45–48]. We emphasize that our findings are observational and do not by themselves prove that intervening on healthy aging trajectories will reduce mortality. Nevertheless, the temporal ordering, the graded associations across trajectory severity, and the robustness in sensitivity analyses increase the plausibility that trajectory-defined risk stratification can be useful for population surveillance and early risk identification; establishing that specific interventions reduce mortality, however, requires studies designed for causal inference (e.g., randomized trials or longitudinal causal methods) [49].
Clinical implications
These findings support integrating simple, multidomain aging assessments into routine primary-care and community screening to identify individuals on adverse trajectories. For middle-aged adults, such screening could trigger targeted risk-factor management, lifestyle interventions, and psychosocial supports aimed at halting or reversing decline. For older adults, interventions should prioritize maintaining function and managing multimorbidity through integrated care, rehabilitation, and social support. Policy measures that expand access to community-based programs combining physical activity, mental-health services, and social engagement may help mitigate trajectory-related risk at the population level [17–19, 50].
Limitations, strengths, and future studies
This study has limitations. First, several healthy aging domains and covariates were self-reported, which may introduce measurement error and reporting bias. Second, institutionalized individuals were not included, possibly overestimating population-level healthy aging. Third, the observational design precludes definitive causal inference: residual confounding, measurement error, and potential reverse causation remain possible despite multivariable adjustment. We therefore interpret associations cautiously and note that future analyses applying formal causal methods (e.g., marginal structural models, g-computation, targeted maximum likelihood estimation, or instrumental-variable approaches) and quantitative sensitivity analyses (such as E-values) would be required to better estimate causal effects of interventions. Fourth, the primary analysis used a complete-case approach; we report exclusion counts (Fig. 2) and age-stratified sensitivity checks, but additional robustness checks would further assess potential bias. Finally, mortality ascertainment relied on exit interviews and linked data, which may not be fully concordant with death certificates.
Strengths include the long follow-up (14 years across exposure and outcome windows), use of a large, nationally representative sample, multidomain longitudinal measurement of healthy aging, and rigorous trajectory modelling. Future research should validate these trajectory classes against clinical biomarkers and objective physical measures, apply causal inference methods to better estimate intervention effects, and test targeted interventions in midlife to determine whether altering adverse trajectories reduces mortality.
Conclusion
Moderate and severe unhealthy aging trajectories were associated with higher all-cause mortality among middle-aged and older adults, with particularly pronounced associations among female and among adults aged 45–64 years. These results support the value of population-level surveillance of multidomain aging indicators and the development of age- and gender-tailored strategies for risk identification and prioritization of preventive resources, while acknowledging that causal effects of specific interventions remain to be established.
Supplementary Information
Supplementary Material 1.
The reference list from the paper itself. Each links out to its DOI / PubMed record.
- 1Boersma P, Black LI, Ward BW. Prevalence of multiple chronic conditions among US adults, 2018. Prev Chronic Dis. 2020;17:200130. 10.5888/pcd 17.200130. 10.5888/pcd 17.200130 PMC 755321132945769 · doi ↗ · pubmed ↗
- 2Korea Employment Information Service. About K Lo SA (Korean Longitudinal Study of Aging) [Internet]. Eumseong: Korea Employment Information Service; 2024 [cited 2024 Aug 10]. Available from: https://survey.keis.or.kr/eng/klosa/klosa 01.jsp.
- 3Nagin DS, Jones BL, Elmer J. Recent advances in group-based trajectory modeling for clinical research. Annu Rev Clin Psychol. 2024;20(1):285–305. 10.1146/annurev-clinpsy-081122-012416.10.1146/annurev-clinpsy-081122-01241638382118 · doi ↗ · pubmed ↗
- 4Burns E, Kakara R. Deaths from falls among persons aged ≥65 years—United States, 2007–2016. MMWR Morb Mortal Wkly Rep. 2018;67(18):509–14. 10.15585/mmwr.mm 6718 a 1. 10.15585/mmwr.mm 6718 a 1PMC 594497629746456 · doi ↗ · pubmed ↗
- 5Fried LP, Ferrucci L, Darer J, Williamson JD, Anderson G. Untangling the concepts of disability, frailty, and comorbidity: implications for improved targeting and care. J Gerontol A Biol Sci Med Sci. 2004;59(3):255–63. 10.1093/gerona/59.3.M 255.10.1093/gerona/59.3.m 25515031310 · doi ↗ · pubmed ↗