Three Cases Revealing Remarkable Genetic Similarity Between Vent-Endemic Rimicaris Shrimps Across Distant Geographic Regions
Won-Kyung Lee, Soo-Yeon Cho, Se-Jong Ju, Se-Joo Kim

TL;DR
This study reveals that Rimicaris shrimp, found in deep-sea hydrothermal vents, show surprising genetic similarity across distant regions, suggesting complex patterns of connectivity and conservation needs.
Contribution
The study identifies three genetically similar Rimicaris species across different oceans, revealing new insights into their global connectivity and conservation implications.
Findings
Three clades of Rimicaris species show low COI divergence despite being from different oceanic regions.
Some Rimicaris populations exhibit strong genetic connectivity, while others remain distinct and localized.
The findings suggest conservation strategies should consider both global connectivity and regional endemism.
Abstract
Deep-sea hydrothermal vents are unique seafloor habitats that support highly endemic organisms with high species abundance and biomass. Among vent-endemic fauna, Rimicaris shrimp are common and play key ecological roles in vent communities of the Atlantic, Indian, and Pacific Oceans. Using multiple genetic markers, we identified three groups of closely related Rimicaris species with cytochrome c oxidase subunit I (COI) divergence of only 0.35–1.90%, reflecting very low genetic differences. We also examined how Rimicaris shrimp populations may be connected across vast oceanic distances and discussed the gene-flow patterns, biological traits, and biogeographic relationships within this monophyletic genus. We found that some deep-sea vent shrimp populations exhibit strong genetic connectivity across distant regions, whereas others remain genetically distinct and localized. These results…
Genes, proteins, chemicals, diseases, species, mutations and cell lines named across the full text — each resolved to its canonical identifier and authoritative record.
Click any figure to enlarge with its caption.
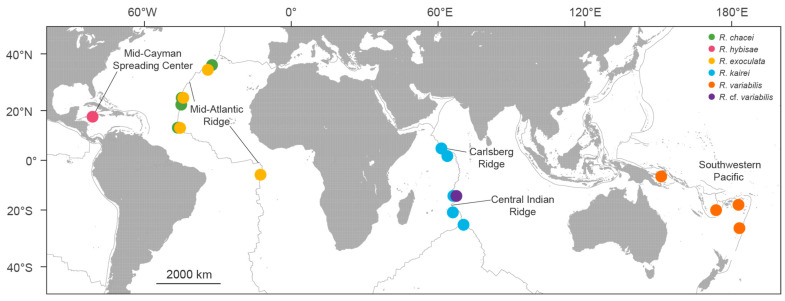 Figure 1
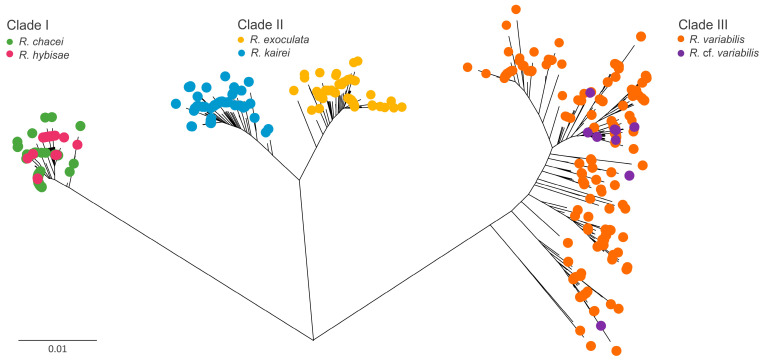 Figure 2
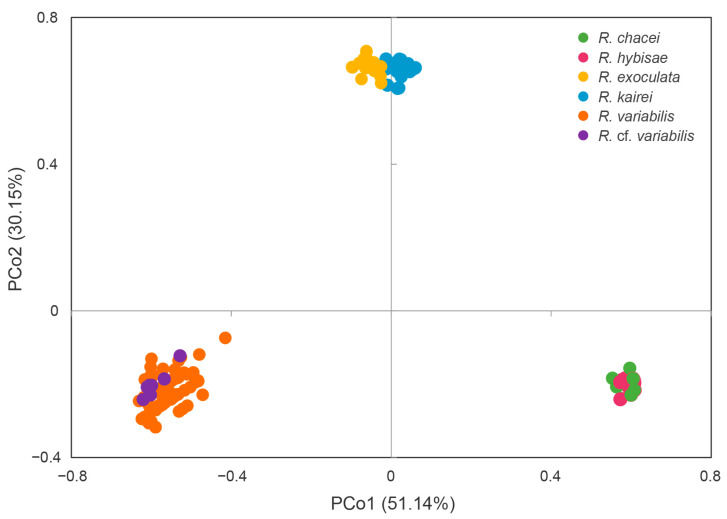 Figure 3
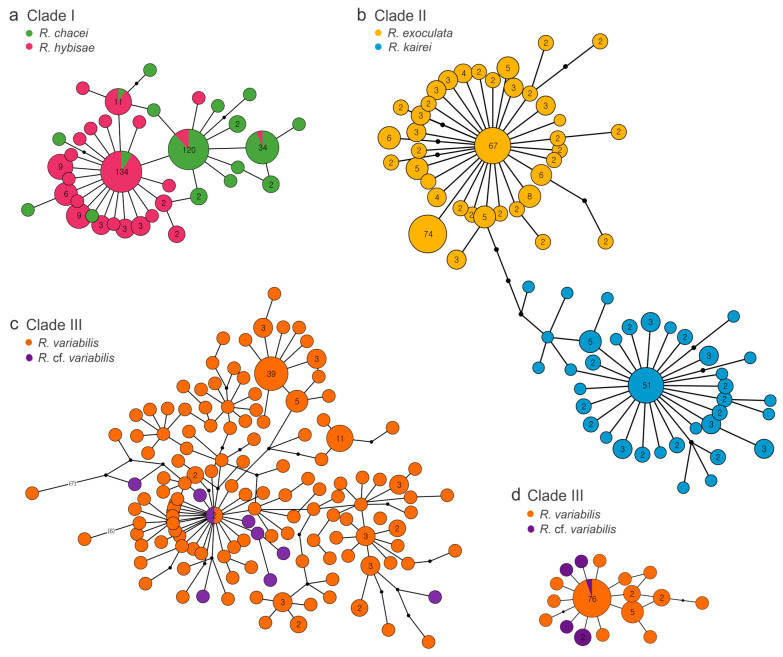 Figure 4
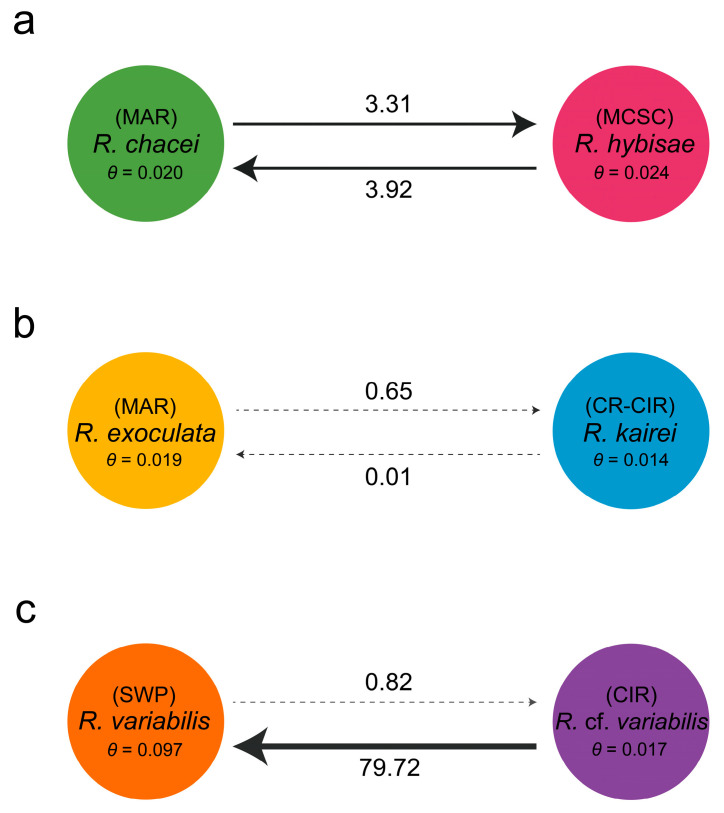 Figure 5
| Species | Distribution | Density ‡ | Cephalothorax | Reference | |||
|---|---|---|---|---|---|---|---|
| Volume | Symbiotic Diet | Symbiont § | |||||
| Clade I | MAR | Low | Non-enlarged | Partially dependent | C > G | [ | |
| MCSC | High or low | Enlarged | Dependent | C | [ | ||
| Clade II | MAR | High | Enlarged | Dependent | C > G | [ | |
| CR-CIR | High | Enlarged | Dependent | C > D > B | [ | ||
| Clade III | SWP | High or low | Non-enlarged | Partially dependent | G > C | [ | |
| CIR | Low | Non-enlarged | Dependent | Not available | [ | ||
- —Korea Research Institute of Bioscience and Biotechnology (KRIBB) Research Initiative Program
- —National Research Foundation of Korea funded by the Ministry of Education
- —Korean Ministry of Ocean and Fisheries
- —KIMST
- —Ministry of Science and ICT (MSIT)
Peer Reviews
No public reviews on file for this paper yet. If you reviewed it on a platform where reviews are public (OpenReview, ICLR, NeurIPS, ICML), you can paste yours below so the community can read it here.
Videos
No videos yet. Explain this paper in a talk, walkthrough, or lecture? Add one.
Taxonomy
TopicsMarine Biology and Ecology Research · Subterranean biodiversity and taxonomy · Genetic diversity and population structure
1. Introduction
Deep-sea hydrothermal vents are found along mid-ocean ridges and back-arc basins and are characterized by darkness, temperatures over 300 °C, and chemically enriched fluids [1,2,3]. These environments host unique ecosystems that are sustained by chemosynthetic microbiomes as primary producers, supporting high biodiversity and considerable biomass [4,5,6,7,8]. Notably, these ecosystems are shaped by evolutionary forces that promote symbiotic adaptations between chemosynthetic bacteria and vent invertebrates, contributing to the high levels of endemism observed among vent-inhabiting invertebrates [9,10,11,12,13,14]. While often considered remote and isolated, these ecosystems are attracting growing commercial interest due to the potential of deep-sea mineral resources.
Hydrothermally active vents are both biologically rich and geochemically significant and are also sites of polymetallic sulfide deposits [15,16,17]. As interest in deep-sea mineral extraction grows, these habitats face increasing threats from human activities. Despite their ecological and economic importance, our understanding of how such disturbances will affect hydrothermal vent biodiversity remains limited, and uncertainties persist regarding species connectivity, gene flow barriers, dispersal capacity, and the potential for population recovery following habitat degradation [18,19,20]. Expanding our knowledge of these areas is essential for developing effective conservation strategies prior to the commencement of large-scale exploitation. Elucidating the genetic structures within and between dominant vent species is a critical step toward informed management and effective conservation of hydrothermal vent ecosystems.
Among the dominant members of vent communities, the caridean family Alvinocarididae is a key indicator of genetic connectivity and ecosystem resilience [21,22,23,24,25,26]. This family is one of the most abundant crustacean taxa in hydrothermal vent ecosystems worldwide, consisting of 35 species in five genera: Alvinocaris, Rimicaris, Mirocaris, Nautilocaris, and Keldyshicaris [27,28,29]. Rimicaris currently includes 15 valid species, all of which are geographically restricted to specific vent regions [21,22,23]. To understand the apparent endemism of Rimicaris species, previous studies have examined their trophic strategies and symbiotic associations with chemoautotrophic microbial communities [30,31,32,33,34]. This genus also exhibits substantial morphological diversity and has recently undergone major taxonomic revisions, with six formerly distinct genera now synonymized under Rimicaris [22,23]. Despite the morphological and ecological diversity within Rimicaris, our pilot study revealed unexpectedly high genetic similarity between some species from geographically distant ocean basins, indicating that their gene flow and dispersal patterns may be more complex than previously understood. However, the mechanisms driving these patterns, particularly those related to genetic divergence, larval dispersal, and migration, remain poorly understood.
The cytochrome c oxidase subunit I (COI) barcode is an approximately 700 bp region of the mitochondrial gene that is widely used for species identification and population genetic studies in metazoans due to its high substitution rate and the availability of universal primers [35]. However, in cases where closely related congeners have recently diverged from a common ancestor, COI barcoding may fail to distinguish species due to insufficient sequence divergence [36,37,38]. To address these limitations, researchers have increasingly adopted multi-locus approaches, such as incorporating additional mitochondrial and nuclear gene regions or analyzing whole mitogenomes or nuclear genomes [39,40,41].
In this study, we first confirmed three cases of paired Rimicaris species that exhibit high genetic affinity based on COI barcode sequences. Then we assessed the sequence similarity and genetic connectivity within each species pair. To validate these affinity data at broader genetic levels, we conducted comparative analyses using the mitochondrial 16S rRNA (16S) gene, nuclear histone 3 (H3) gene, and all 13 mitochondrial protein-coding genes (PCGs). Our findings are anticipated to have implications relating to genetic connectivity, potential migration pathways, and speciation processes.
2. Materials and Methods
2.1. Ethics Approval
The Korea Institute of Ocean Science and Technology obtained permission to collect vent fauna, including shrimps, from hydrothermal vent regions in the Southwestern Pacific Ocean located within the Exclusive Economic Zones of Fiji and Tonga. Approval was granted by the Ministry of Land and Natural Resources of the Republic of Fiji and the Ministry of Lands, Survey and Natural Resources of the Kingdom of Tonga. Shrimps from the Manus Basin, which were loaned to Duke University, were collected with permission from the Government of Papua New Guinea.
2.2. Vent Sampling and Identification
Using suction samplers mounted on remotely operated vehicles, alvinocaridid shrimp specimens were collected from nine vent sites in the southwestern Pacific (SWP) and two vent sites in the Central Indian Ridge (CIR) (Figure 1). On board the research vessel, all specimens were immediately preserved in 95% ethanol or stored at −80 °C for genetic analysis. The specimens were identified based on morphological characteristics and COI barcodes [35,42]. Detailed information on the specimens is provided in Table S1.
2.3. DNA Extraction, Partial Gene and Mitogenome Sequencing, and Sequence Data Preprocessing
A small amount of muscle tissue was dissected from a pereopod of each specimen for DNA extraction. Total genomic DNA was extracted using a QIAamp Fast DNA Tissue kit (Qiagen, Hilden, Germany).
Partial sequences of the COI, 16S, and H3 genes were amplified using published universal primers (Table 1). Polymerase chain reaction (PCR) amplification was performed in a total volume of 50 μL, containing 1 μL of genomic DNA, 4 μL of dNTP mixture (2.5 mM each), 1 μL of each primer (10 pmol), 5 μL of 10× Ex Taq Buffer (Mg^2+^ plus), and 1.25 U of Takara Ex Taq DNA Polymerase (Takara Bio, Kusatsu, Japan), with an initial denaturation at 94 °C for 2 min, followed by 35 cycles of denaturation at 95 °C for 10 s, primer annealing at 48 °C for COI, 46 °C for 16S, and 50 °C for H3 for 30 s, extension at 72 °C for 1 min, and a final 5 min extension at 72 °C. The PCR products were sequenced by Macrogen (Seoul, Republic of Korea) on an ABI 3730xl Analyzer (Applied Biosystems, Waltham, MA, USA) with BigDye Terminator v3.1 Cycle Sequencing Kits (Applied Biosystems, Seoul, South Korea). Newly obtained sequences were trimmed, annotated, and aligned using Geneious Prime v2023.0.1 (Biomatters, Auckland, New Zealand) and adjusted manually by visual inspection.
For mitogenome sequencing, mitochondrial DNA was amplified using a REPLI-g Mitochondrial DNA Kit (Qiagen). Libraries were prepared using a TruSeq Nano DNA Kit (Illumina, San Diego, CA, USA) and short-read sequencing was performed using the Illumina HiSeq 4000 platform at Macrogen. The mitogenome was assembled using NOVOPlasty v4.3.1 [46], annotated using MITOS2 [47], and curated manually in Geneious Prime v2023.0.1 (Biomatters).
The newly generated sequences were registered in GenBank (Table S2).
2.4. Tree Construction, Nucleotide Divergence, Haplotype Network, and Gene Flow
Based on both newly generated sequences and those retrieved from GenBank, genetic divergence was calculated using the p-distance method, and a neighbor-joining (NJ) tree was constructed with MEGA 11 [48].
To visualize genetic similarities and dissimilarities among samples, principal coordinate analysis (PCoA) was performed based on distance matrices using GenAlEx v6.503 [49].
The number of polymorphic sites, number of haplotypes, haplotype diversity, nucleotide diversity, Tajima’s D, Fu’s F_S_, and fixation index based on pairwise differences (F_ST_) were estimated using DnaSP v5.10.01 and Arlequin v3.5.2.2 [50,51]. To determine the genetic relationships between paired species within each clade, haplotype networks were created using TCS and visualized with Hapsolutely v0.2.2 [52,53].
The gene flow between closely related species was estimated as the number of migrants per generation (Nm) using MIGRATE-N 5.0.4 [54,55]. Nm was calculated as Nm = θ × M, where N is the effective population size, m is the migration rate, θ is the mutation-scaled population size, and M is the mutation-scaled migration rate.
2.5. Mitogenome Sequence Comparison
The nucleotide and amino acid sequence similarities of mitochondrial genes were calculated using Geneious Prime v2023.0.1 (Biomatters). The ratio of nonsynonymous to synonymous substitutions (K_a_/K_s_) was measured using KaKs_Calculator v3.0 with the Yang–Nielsen model [56].
3. Results
3.1. Datasets Prepared from Multi-Gene Sequences
We generated new sequences of the COI and 16S mitochondrial genes and H3 nuclear gene, as well as complete mitogenome sequences for Rimicaris variabilis and Rimicaris cf. variabilis (Table S2).
Each gene was aligned individually using both the newly obtained sequences and those of Rimicaris chacei, Rimicaris hybisae, Rimicaris exoculata, and Rimicaris kairei retrieved from GenBank (Table S2). We were unable to include H3 sequences for R. exoculata and R. kairei or mitogenome sequences for R. chacei and R. hybisae in our analyses because they were not available in public sequence databases.
3.2. Genetic Clusters of Rimicaris Species
Based on the NJ tree constructed from the partial gene datasets for six Rimicaris species, three distinct clades were identified (Figure 2). In each clade, the paired species originated from geographically distant oceanic regions or ridge systems: Clade I included R. chacei from the Mid-Atlantic Ridge (MAR) and R. hybisae from the Mid-Cayman Spreading Center (MCSC); Clade II included R. exoculata from the MAR and R. kairei from the Carlsberg Ridge (CR)–CIR; and Clade III included R. variabilis from SWP and R. cf. variabilis from CIR.
The genetic divergence between paired species within each clade was 0.35–1.90% for COI and 0.04–0.30% for 16S (Table 2). By contrast, inter-clade divergences were substantially higher, at 6.95–8.74% for COI and 0.30–1.10% for 16S. Although the H3 marker is generally used for population-level analyses, it typically exhibits lower divergence than COI and 16S [57,58,59]. In the case of Rimicaris, which already shows very low intraspecific variation in mitochondrial genes, the H3 sequences were highly conserved. As a result, the H3 marker lacked sufficient resolution to distinguish genetic divergence within or between clades, showing only a single nucleotide difference at the same position across all Rimicaris sequences [57,58,59].
PCoA based on distance matrices of COI revealed that the first principal coordinate (PCo1) accounted for 51.14% of the total genetic variance, and the second (PCo2) accounted for 30.15%. The resulting PCoA plot clearly separated the three clades, supporting the NJ tree topologies (Figure 3).
3.3. Genetic Connectivity Between Paired Rimicaris Species Within Each Clade
Based on COI sequence divergence, paired Rimicaris species within each clade fell within the range of intraspecific variation, as defined by species delimitation thresholds in DNA barcoding studies [60]. To assess whether the paired species in each clade should be considered conspecific, we examined genetic clustering using haplotype networks, genetic structures, and gene flow estimates (Figure 4 and Figure 5, Table 3). However, because significant negative Tajima’s D values suggest recent population expansions, which may depart from the migration–drift equilibrium and constant population size assumptions of gene flow models, gene flow estimates were interpreted with appropriate caution and primarily in a comparative context [61].
In Clade I, the haplotype network revealed four dominant haplotypes shared between R. chacei and R. hybisae, indicating overlapping genetic pools (Figure 4a). This result was supported by gene flow estimates, which showed moderate bidirectional exchange between the two species (Nm = 3.31 and 3.92; Figure 5a). Despite their shared haplotypes, the two species showed substantial genetic differentiation, with a pairwise FST of 0.47 (Table 3). Both species also had negative Tajima’s D and Fu’s F_S_ values, consistent with recent independent population expansion.
In Clade II, the haplotype network revealed no shared haplotypes between R. exoculata and R. kairei, indicating clear genetic separation (Figure 4b). This result was supported by gene flow estimates, which showed low bidirectional gene flow between the two species (Nm = 0.65 and 0.01; Figure 5b), and by genetic differentiation analyses, which yielded a high pairwise FST value of 0.82 (Table 3). Both species also had negative Tajima’s D and Fu’s F_S_ values, implying recent independent population expansion. Notably, in each species, expansion appears to have occurred from a distinct ancestral haplotype.
In Clade III, the COI haplotype network had limited resolution in distinguishing R. variabilis and R. cf. variabilis, likely due to high haplotype diversity (~1.0) at the COI marker (Figure 4c, Table 3). Nevertheless, we detected a haplotype cluster shared by the two species. By contrast, the 16S haplotype network revealed a clearer structure, with a single dominant haplotype shared by both species and additional haplotypes restricted to R. variabilis (Figure 4d). The two species showed low genetic differentiation, with a pairwise FST value of 0.10 (Table 3). Gene flow analysis revealed strong asymmetry, as migration from R. cf. variabilis (CIR) to R. variabilis (SWP) was exceptionally high (Nm = 79.92) and the reverse flow was very low (Nm = 0.82; Figure 5c). Furthermore, R. variabilis in the SWP showed evidence of recent rapid population expansion, with θ = 0.097 (the highest value among the six Rimicaris species), negative Tajima’s D and Fu’s F_S_ values, and very high haplotype diversity (H_d_ = 0.96).
3.4. Mitogenomic Similarity Between Paired Rimicaris Species
Mitogenomic-level genetic similarities between the paired Rimicaris species within each clade were examined (Table 4). Within Clade II and Clade III, the amino acid sequences of all PCGs were nearly identical, with consistent gene lengths, start and stop codons, and overall sequence composition. Most nucleotide differences between paired species were synonymous substitutions, with a few notable non-synonymous changes observed in ND3 and ND6 between R. exoculata and R. kairei in Clade II.
4. Discussion
4.1. Clade-Specific Patterns of Genetic Similarity in Rimicaris
In Clade I, R. chacei (MAR) and R. hybisae (MCSC) are morphologically similar in the adult stage, particularly in terms of final stomach volume and the surface area of their mouthparts, implying that they represent a single species [24,34]. These two taxa share four haplotypes, two putatively originating from MAR and two from the MCSC, and show bidirectional gene flow, indicating some genetic overlap (Figure 4a and Figure 5a). A potential dispersal route connecting the MCSC and the MAR is the Windward Passage of the Caribbean Sea [62,63]. However, the comprehensive genetic and ecological data analyzed in this study do not support uninterrupted bidirectional gene flow between the two regions, suggesting the presence of barriers to genetic exchange (Table 3 and Table 5). Thus, while the shared haplotypes suggest either historical connectivity or limited ongoing gene flow, the overall genetic structure implies partial reproductive isolation. At a finer local scale, the Snake Pit vent field on the MAR appears to act as a keystone site, with MAR-derived haplotypes present across all sampled regions but no MCSC-derived haplotypes (Figure S2), indicating asymmetric gene flow. This suggests that connectivity among adjacent populations may be maintained despite reduced exchange between more distant regions, potentially reflecting the combined effects of geography, dispersal pathways, and reproductive dynamics [64,65]. Resolving the mechanisms underlying this asymmetry will require additional data on larval dispersal, reproductive timing, and population compatibility.
In Clade II, R. exoculata (MAR) and R. kairei (CR-CIR) are morphologically, genetically, ecologically, and biogeographically distinct (Figure 4b and Figure 5b, Table 3 and Table 5). Morphologically, they differ in the conspicuousness of the surface setae on the carapace and in the size of the pereopods and antennal flagellae [66]. Genetically, they share no COI haplotypes, exhibit low bidirectional gene flow (Nm < 1), and show significant differentiation in pairwise FST values. However, while the COI and 16S markers indicate some divergence, this evidence is insufficient for species-level separation, and the mitogenome sequences of the two species are very similar, differing only by a few synonymous substitutions (Table 4). Divergence-time estimates based on mitogenomes indicate that their common ancestor split into the two lineages approximately 5.38 Mya, whereas Alvinocarididae and Rimicaris originated much earlier, at 69.36 and 28.50 Mya, respectively [67]. During the Miocene, the closure of the Tethys Ocean, which once connected the Mediterranean and Indian Oceans, has been implicated in driving vicariant speciation among marine taxa with Atlantic–Mediterranean–Indian distributions [68,69,70,71,72]. A plausible scenario for Clade II is that its common ancestor dispersed freely through the Tethys Sea, and its descendants became isolated in the Atlantic and Indian Oceans following the closure of the sea, initiating their subsequent divergence.
4.2. Adaptive Divergence, Eastward Dispersal, and Regional Barriers in Clade III
In Clade III, Rimicaris variabilis (SWP) and R. cf. variabilis (CIR) exhibit a more complex evolutionary trajectory than those in Clades I and II. Notably, R. variabilis in the SWP utilizes a distinct energy source, reflected in its markedly low δ^13^C value, which clearly separates it from the other five Rimicaris species (Figure S4). This separation likely reflects differences in the chemosynthetic carbon fixation pathways of their symbionts and associated trophic interactions, specifically, Calvin–Benson–Bassham (CBB) cycle-based versus reductive tricarboxylic acid (rTCA) cycle-based primary production [73]. These metabolic differences further suggest adaptive divergence in nutritional strategies driven by symbiotic associations: R. variabilis derives only partial nutrition from its cephalothoracic epibionts, whereas R. cf. variabilis depends on them entirely [32] (Table 5).
However, we did not find any noticeable differences in the rostrum or tail morphology between the Manus and other SWP populations of R. variabilis (unpublished data). In addition, we were unable to assess the morphological characteristics of R. cf. variabilis because the available specimens were damaged. Although sequence data from only 9 R. cf. variabilis specimens were used in this study, 19 individuals were examined in total with ten additional sequences. Despite this limited sample size, our results consistently support their classification as a single species (Table 2, Table 3 and Table 4). A notable finding is the highly asymmetric gene flow between regions: migration from the CIR to the SWP is strong whereas that in the reverse direction is almost negligible (Figure 5c). This asymmetry, combined with higher genetic diversity in the SWP than in the CIR, implies a historical or ongoing unidirectional dispersal route from the CIR into the SWP, followed by genetic expansion within the SWP population. Importantly, this eastward dispersal contrasts with previous hypotheses proposing westward migration from the Pacific to the Indian Ocean, including the Pacific origins of alvinocaridid shrimps, neolepadid barnacles, and the vent mussel Bathymodiolus septemdierum [7,25,81,82].
At a finer local scale, more complex genetic structures are evident within the SWP, particularly between the Manus Basin and other SWP sites such as the North Fiji Basin, Tonga Arc, and Futuna Arc. In the 16S haplotype network, haplotypes observed only in R. variabilis were found predominantly in individuals from the Manus Basin, and this population consistently showed the highest genetic diversity (Figures S1 and S3). Based on COI sequences, both the highest θ value and the greatest intraspecific variation within R. variabilis were attributed to the Manus Basin population. Remarkably, only a single haplotype was shared between the Manus Basin and other SWP sites, which may reflect parallel mutations arising independently in each region rather than true connectivity. Similar trends have been reported in other vent-endemic taxa, including the gastropod Ifremeria nautilei, limpet Lepetodrilus aff. schrolli and Austinograea crabs [83,84,85,86]. These findings indicate the presence of a strong regional biogeographic barrier between the Manus Basin and other SWP vent systems, shaped by dispersal limitations imposed by tectonic history and ocean circulation [8,87].
Overall, these results support a plausible scenario for Clade III in which the CIR was the source population, with dispersal proceeding along two routes: a strong direct pathway into the Manus Basin and a weaker pathway through the Southern Ocean toward other SWP sites. These two lineages appear to have remained largely unconnected, with the Manus Basin lineage accumulating extensive genetic diversity, whereas populations along the latter route remained more interconnected across other SWP vent fields.
4.3. Evolutionary Framework of Rimicaris
On longer geological timescales, tectonic processes, including the formation and subsequent breakup of Pangaea from the Paleozoic to Mesozoic eras, are thought to have profoundly influenced deep-sea migration, diversification, persistence, and extinction patterns in marine lineages [88,89]. The discontinuous distribution of deep-sea hydrothermal vents along mid-ocean ridges reinforces geographic isolation among vent communities [2,12,90]. As a result, vent ecosystems exhibit remarkable regional endemism, with more than 85% of the approximately 700 known species considered endemic [4,91]. However, there are exceptions to these regional endemic patterns. For example, the vent mussel Bathymodiolus septemdierum and vent barnacle Leucolepas longa occur in widely separated vent fields [81,82]. We also observed similar cross-regional connectivity in Rimicaris species. Each genetic clade of Rimicaris included two species originating from different oceanic regions or ridges, rather than from the same geographic area (Figure 2).
Rimicaris is the most species-rich genus in Alvinocarididae, accounting for about 35% of its members, and is composed of the most recently diverged species [23,67]. These features may be compatible with the three Rimicaris clades examined here, which exhibit contrasting patterns of connectivity across oceanic regions. The combination of high species diversity and relatively recent divergence often reflects rapid diversification, as documented in numerous cases with adaptive radiations [92,93,94], and in Rimicaris, such diversification may have been facilitated by a combination of high larval dispersal potential and ecological flexibility. Larvae of Rimicaris undergo a prolonged planktotrophic phase with long-distance dispersal capability [95,96], which could enhance colonization of neighboring or even distant vent regions, as observed in this study. Furthermore, colonization of distinct vent environments may in turn expose populations to new ecological conditions and niche opportunities. Notably, Rimicaris species exhibit diverse feeding strategies, reflecting high potential for adaptation at newly arrived habitats, even when closely related species co-occur at the same vent site [31]. All of these geological and biological features might have led to speciation, resulting in the present distribution of Rimicaris populations, characterized by low genetic variability but diverse geographic distribution patterns.
4.4. New Perspectives on Vent Organism Conservation
Endemism in vent and seep fauna is thought to date back to the Paleozoic [97,98,99]. Much of the contemporary biogeographic endemism observed in vent and seep invertebrates is thought to have been shaped by Cenozoic tectonic events and changes in oceanic circulation (<100 Mya) [5]. Within these groups, the alvinocaridid genus Rimicaris is among the most recently diversified lineages, with 16 described species originating since the Paleocene [67]. Most of these species are distributed across hydrothermal vent fields in the Pacific and Indian Oceans, reflecting diversification over a relatively short tectonic history [22,23,100,101].
Understanding species diversity, distribution, genetic diversity, and connectivity provides a critical foundation for developing effective conservation strategies for hydrothermal vent ecosystems [5,8,102,103]. Historically, migrations, distribution ranges, and the biogeographic structuring of vent fauna have largely been inferred from the faunal compositions of local communities [12,104,105]. In the context of potential seabed mining, conservation plans have therefore emphasized the low connectivity among vent networks and the high degree of endemism, as species recruitment is unlikely to extend across vent system boundaries [8,106,107].
However, the present study reveals evidence of cross-regional connectivity among alvinocaridid shrimps spanning different oceanic regions and ridges. This finding challenges the prevailing view that vent species are strictly confined within provincial boundaries and instead highlights that while some taxa are strongly constrained by dispersal barriers, others maintain connectivity on broader scales.
Our results suggest that effective conservation of vent ecosystems should be framed from a global perspective, rather than being restricted to single species or narrowly defined provinces. Treating vent ecosystems as a single homogeneous management unit risks overlooking their complex evolutionary and ecological dynamics. Effective conservation strategies should also recognize the importance of distinct biogeographic provinces, ensuring that management simultaneously addresses both global-scale connectivity and local-scale endemism.
5. Conclusions
This study documents alvinocaridid shrimp groups exhibiting high genetic similarity across geographically distant hydrothermal vents based on partial gene markers and mitochondrial genomes. These findings challenge the prevailing view that vent-endemic species are strictly confined to provincial boundaries and highlight the need for conservation and resource-assessment strategies that account for broad-scale connectivity alongside regional endemism. To support this, future research integrating nuclear markers, genome-wide data, and dispersal modeling will be essential for robust evaluation of dispersal pathways, demographic connectivity, and population recovery potential. Such integrative frameworks are essential for the sustainable management of hydrothermal vent ecosystems.
The reference list from the paper itself. Each links out to its DOI / PubMed record.
- 1Ramirez-Llodra E. Shank T.M. German C.R. Biodiversity and biogeography of hydrothermal vent species: Thirty years of discovery and investigations Oceanography 200720304110.5670/oceanog.2007.78 · doi ↗
- 2Vrijenhoek R.C. Genetic diversity and connectivity of deep-sea hydrothermal vent metapopulations Mol. Ecol.2010194391441110.1111/j.1365-294X.2010.04789.x 20735735 · doi ↗ · pubmed ↗
- 3Sogin E.M. Kleiner M. Borowski C. Gruber-Vodicka H.R. Dubilier N. Life in the dark: Phylogenetic and physiological diversity of chemosynthetic symbioses Annu. Rev. Microbiol.20217569571810.1146/annurev-micro-051021-12313034351792 · doi ↗ · pubmed ↗
- 4Mc Arthur A. Tunnicliffe V. Relics and antiquity revisited in the modern vent fauna Geol. Soc. Lond. Spec. Publ.199814827129110.1144/GSL.SP.1998.148.01.15 · doi ↗
- 5Van Dover C.L. German C. Speer K.G. Parson L. Vrijenhoek R. Evolution and biogeography of deep-sea vent and seep invertebrates Science 20022951253125710.1126/science.106736111847331 · doi ↗ · pubmed ↗
- 6Fisher C.R. Takai K. Le Bris N. Hydrothermal vent ecosystems Oceanography 200720142310.5670/oceanog.2007.75 · doi ↗
- 7Moalic Y. Desbruyères D. Duarte C.M. Rozenfeld A.F. Bachraty C. Arnaud-Haond S. Biogeography revisited with network theory: Retracing the history of hydrothermal vent communities Syst. Biol.20126112710.1093/sysbio/syr 08821856628 · doi ↗ · pubmed ↗
- 8Tunnicliffe V. Chen C. Giguère T. Rowden A.A. Watanabe H.K. Brunner O. Hydrothermal vent fauna of the western Pacific Ocean: Distribution patterns and biogeographic networks Divers. Distrib.202430 e 1379410.1111/ddi.13794 · doi ↗