A pangenome insight into the genome divergence and flower color diversity among Rhododendron species
Hai-Yao Ma, Shuai Nie, Hai-Bo Liu, Tian-Le Shi, Shi-Wei Zhao, Zhao-Yang Chen, Yu-Tao Bao, Zhi-Chao Li, Jian-Feng Mao

TL;DR
This study explores how transposable elements influence genome divergence and flower color diversity in Rhododendron species.
Contribution
The study provides new insights into the role of transposable elements in driving genomic and flower color diversity in Rhododendron.
Findings
Approximately 50% of Rhododendron genomes consist of transposable elements, with over half being LTR-RTs.
Transposable elements are significantly associated with genomic differentiation and structural variances.
Gene duplication and loss related to flower color may be driven by transposable elements.
Abstract
The Rhododendron genus (Rhododendron L.), recognized as the most extensive woody plant genus in the Northern Hemisphere, captivates with its strikingly beautiful corollas and variety of flower colors. In addition, the Rhododendron genus exhibits a complex evolutionary history and substantial species diversification. To comprehensively understand the genomic complexity and flower color diversity within this genus, comparative genomics has emerged as a promising approach, enabling analysis at a super-species level. Here, we collected whole-genome data from seven rhododendrons of different subgenera to investigate the patterns of interspecific genomic and sequence divergence, as well as evolutionary dynamics of gene family related to flower color. We discovered that approximately 50% of Rhododendron genomes are composed of transposable elements (TEs), with over half of them being long…
Genes, proteins, chemicals, diseases, species, mutations and cell lines named across the full text — each resolved to its canonical identifier and authoritative record.
Click any figure to enlarge with its caption.
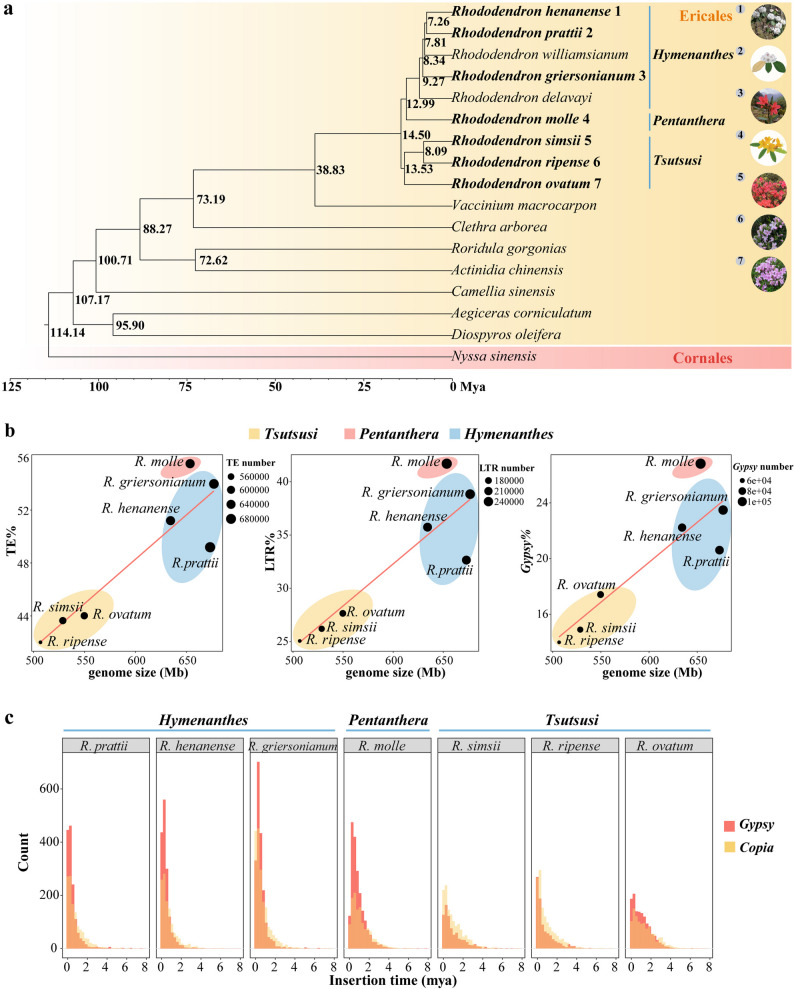 Figure 1
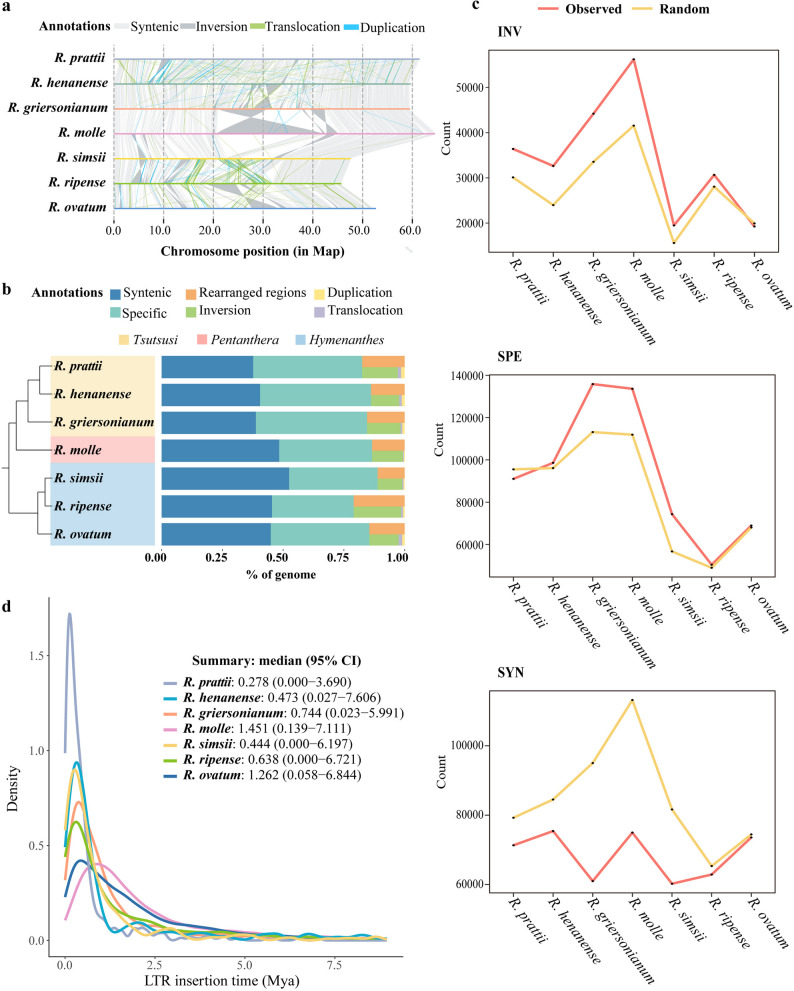 Figure 2
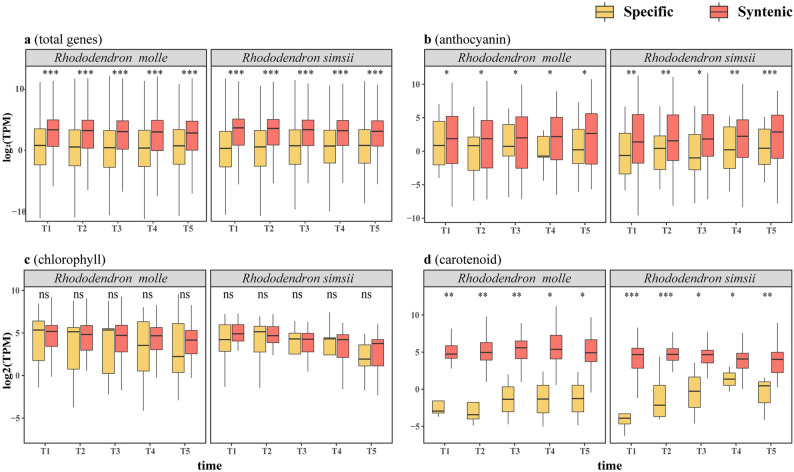 Figure 3
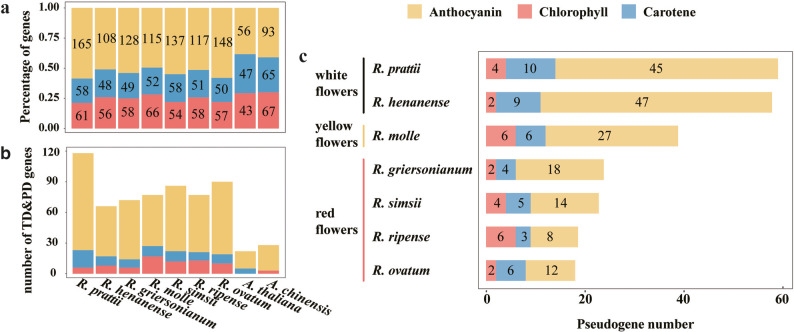 Figure 4
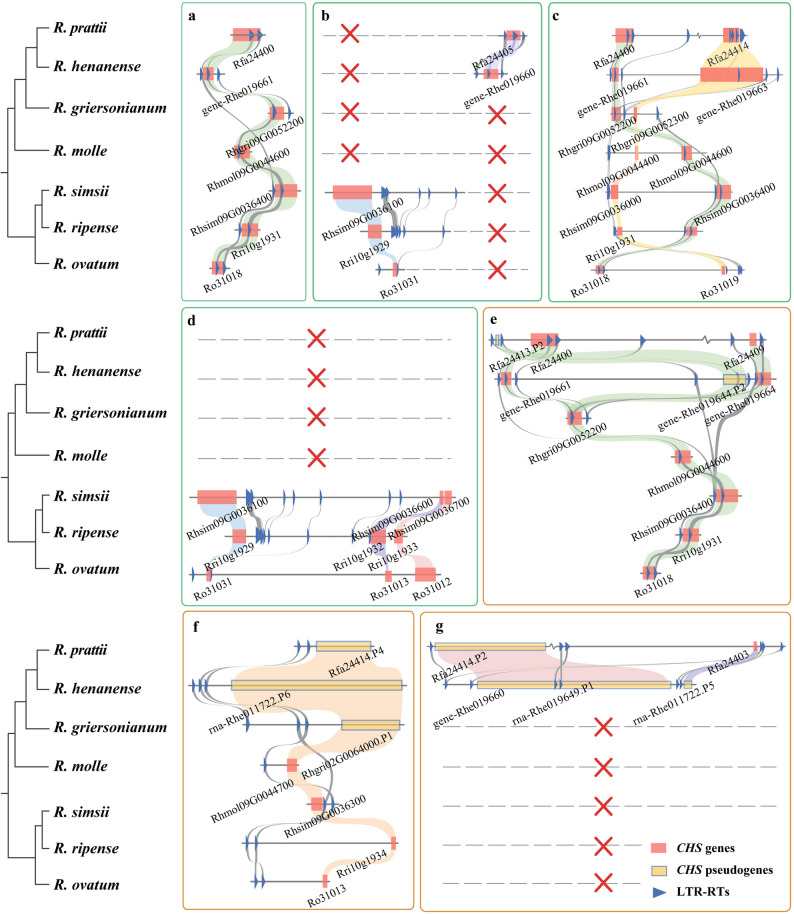 Figure 5
- —Umea University
Peer Reviews
No public reviews on file for this paper yet. If you reviewed it on a platform where reviews are public (OpenReview, ICLR, NeurIPS, ICML), you can paste yours below so the community can read it here.
Videos
No videos yet. Explain this paper in a talk, walkthrough, or lecture? Add one.
Taxonomy
TopicsChromosomal and Genetic Variations · Genomics and Phylogenetic Studies · Plant Diversity and Evolution
Background
Rhododendron L., represents one of the largest groups of woody plants globally and the largest genus of woody plants in China [1–4]. With nearly 1,000 species, Rhododendron is widely distributed in the Northern Hemisphere, mainly in Asia, Europe, and North America [5]. In China, it is known as the king of woody flowers due to its stunning diversity of colors.
Rhododendrons are characterized by their complex evolutionary history, widespread taxa, and abundant flower diversity resources. Due to recent rapid radiations and widespread hybridization, the genus identifies a large number of morphologically diverse species, and its taxonomy has undergone several major revisions [6, 7]. This complex evolutionary history has resulted in extensive genomic complexity in the genus, including significant variations in genome size, proportion of repetitive sequences, and gene number. However, our current understanding and comprehensive characterization of the genomic complexity among Rhododendron species are still limited.
Rhododendron species display a wide range of flower color variations, such as red, crimson, purple, yellow, and white [8]. The genomic assemblies of Rhododendron species with diverse flower colors in red (including pink), yellow, and white, have already been published. Flower color diversity among rhododendrons is primarily determined by flavonoid compounds, particularly anthocyanins [2, 9]. Previous studies have shown that the anthocyanin biosynthesis genes in Rhododendron experience drastic duplicates and losses [10, 11]. Abundant tandem duplication (TD) and proximal duplication (PD) genes and pseudogenes are found within the anthocyanin biosynthesis gene families, which may explain the absence of pelargonidin biosynthesis in R. molle flowers [10]. However, further studies with larger sample sizes are needed, as existing studies have only been conducted on a small number of Rhododendron species with certain flower colors. The complex flower color variation in Rhododendron provides great potential for exploring flower color evolution.
The advancements in genomics, represented by comparative genomics, have enabled researchers to simultaneously study the sequence characteristics of species at both the whole-genome and gene levels [12]. In the Rhododendron genus, multiple high-quality genome assembly projects have been reported, providing opportunities to investigate the connection between genomic complexity and flower color diversity among species. Previous studies on individual genomes have found that transposable elements (TEs), particularly long terminal repeat retrotransposons (LTR-RTs), play a significant role in driving genome and gene variation, thereby potentially trigger phenotypic variation. The maize color variety is a well-known example of how TE insertion can affect individual attributes [13]. Sunflowers also exhibit substantial genetic variation due to TEs, particularly LTR-RTs [14]. Numerous studies have also revealed a strong association between TEs and pseudogenization, the loss of functional gene. In Triticeae species, TE insertion and TE-driven gene mobility have generated thousands of pseudogenes, facilitating rapid differentiation of the Triticeae genomes [15]. In R. molle, the insertion of LTR-RTs has led to the expansion and contraction of the CHS gene family, which is closely related to flower color variation [10]. However, there is currently a lack of interspecific comparisons of more genomes to further investigate this phenomenon. Currently, our knowledge of TE-related phenotypic variation among species within the same genus remains limited, with most research focused on large-scale genomic projects and model species [16].
This study aims to investigate the genomic divergence among Rhododendron species, and further to discover the potential impact of TEs on genome variation and phenotypic. Additionally, given that flower color holds significant value as an ornamental trait within the Rhododendron genus, this study annotated genes associated with the biosynthesis of major pigments such as anthocyanins, chlorophyll, and carotenoids. Gene gain and loss dynamics were also revealed, shedding light on the functional significance of TEs in shaping genomic variation among Rhododendron species. This research enhances our understanding of the functional role of TEs in genome divergence within the Rhododendron genus, and lays the foundation for further exploring the driving force of TEs in phenotypic diversity.
Materials and methods
Data collection
We collected publicly released whole genome data of nine Rhododendron species, including R. molle (yellow flowers) [10], R. simsii (red flowers) [11], R. griersonianum (red flowers) [17], R. ovatum (white to pink flowers) [18], R. ripense (purple flowers) [19], R. henanense (white flowers) [20], R. prattii (white flowers) [21], R. williamsianum (pink flowers) [22] and R. delavayi (red flowers) [23]. The genome sequences, protein sequences, annotation files, and CDS sequences were obtained from databases such as NCBI, NGDC, GigaDB, and others (see Supplemental Table 1 for details on data origin). We specifically selected seven Rhododendron species with high-quality genome and chromosome-level assemblies for subsequent in-depth analyses.
Phylogenomic analyses for Ericales
A total of 17 species were selected to reconstruct the evolutionary history of the Ericales clade, with Nyssa sinensis [24] as an outgroup. Orthogroups were constructed by selecting the longest transcript for each coding gene using OrthoFinder v2.3.1 [25]. A total of 243 single-copy and 1,513 low-copy orthogroups (with at least 88.2% of species having single-copy genes in any orthogroup) were extracted. Amino acid sequences from each orthogroup were aligned using MAFFT v7.471 [26], and then PAL2NAL v.14 [27] was used to convert the protein alignments into codon-preserving alignments.
Gene trees for individual low-copy orthogroups were constructed using 1,000 bootstrapping replicates, and each node of the gene trees was checked with the bootstrap support (BS) cutoff value of 50%. Phylogenetic inference was performed using ASTRAL-Pro v1.1.2 [28] based on the gene trees. We also used 989 low-copy orthogroups (with at least 90% of the species having single-copy genes in any orthogroup) to construct a species tree using the above method in order to obtain a more accurate and high-supporting species relationship. Finally, a consistent topology was inferred with high BS values and LPP (local posterior probability) values.
The divergence times were estimated with the MCMCTree module in the PAML package [29]. The age of the phylogenic tree was calibrated using fossils of crown nodes of Ericales (89 Mya) and Rhododendron (56 Mya), and the timing of the tree root (105 Ma) was calibrated using the TimeTree online database (http://www.timetree.org/).
Genomic repeats annotation
The PanEDTA pipeline [30] was used to annotate and classify transposable elements for seven Rhododendron species with chromosome-scale genome assembly. BEDTools v2.30.0 [31] was used to calculate the proportion of transposable elements (TEs) in the genome.
To more accurately predict long terminal repeat retrotransposons (LTR-RTs), LTRharvest [32] and LTRdigest [33] within the genometools v1.5.10 software [34] were used for de novo prediction of LTR-RTs. LAST v983 (http://last.cbrc.jp) was employed to align RT sequences of LTR-RTs to the REXdb v3.026 [35] database. The resulting alignments were then used to classify identified LTR-RTs based on the completeness of their internal structure. LTR-RTs that contained a complete Gag-Pol protein sequence were defined as intact LTR-RTs (I). Using these intact LTR-RTs as references, blastn was used to identify homologous sequences from the genome sequence. LTR-RTs sequences with no homologous hits in both upstream and downstream regions were defined as solo LTR-RTs (S), while those with homologous hits on one side but not the other were defined as truncated LTR-RTs (T). The identified intact LTR-RTs were mainly classified into the Copia and Gypsy superfamilies based on the order and similarity of their Pol protein domains.
After counting the numbers of intact, truncated, and solo LTR-RTs, the values of S: I, T: I, (S + T): I, and S + T + I were calculated based on these statistics to roughly measure the birth and elimination rates of LTR-RTs. To eliminate the effect of assembly sequence length on the calculation of these ratios, different assembly sequence length filtering thresholds were used until the S: I ratio reached stability. In addition, multiple ratios of S, T, and I at the level of LTR-RTs families were also calculated, and the proportion of families with an S: I ratio greater than 3 was used to evaluate the elimination ability of LTR-RTs.
Finally, we utilized SubPhaser [36] to identify species-specific k-mers and thus obtain those high-copy number (copy number > = 200) and species-specific LTR-RTs from the seven Rhododendron species.
Genome comparison
We performed the pairwise alignment among seven Rhododendron species with chromosome-scale genome assembly available using minimap2 v2.17 (-ax asm5 -k 17) [37], and then observed the synteny blocks revealed in the dotplots to determine the pairwise homology of chromosomes. As it has the highest quality in genome assembly, so R. molle genome was used as the reference in this study, and others’ genomes were used as queries for whole genome alignment. Then, SYRI v1.3 [38] was used to perform comparison between the reference and queries. This enabled us to identify both local (SNPs and short indels) and structural variations (inversions, translocations, and duplicates, etc.) among genomes.
The number of overlaps between LTRs and inversion, collinear, and specific regions in the genome was calculated using BEDtools v2.30.0 [31]. Here, LTRs include both randomly generated and observed LTRs. The Random function in BEDtools v2.30.0 [31] was used to generate random data. To investigate the impact of LTRs on interspecies structural variation, we compared the number of overlaps between LTRs and the inversion regions (INV), species-specific regions (SPE), and species-syntenic regions (SYN) in seven Rhododendron species.
Species-specific LTR identification
For the identification, classification, and insertion age estimation of species-specific LTR-RTs, we used SubPhaser [36]. Initially, k-mers that differentiate these genomes were identified. LTR-TRs were then recognized using LTRharvest v.1.6.1 [32] and LTRfinder v.1.07, and subsequently classified with TEsorter. The insertion time (T) was calculated using the formula T = K/2r, where r = 1.3 × 10^–8^ substitutions yr–1 (default) and K represents the sequence divergence estimated between two LTRs from an intact LTR-RT [39].
Gene expression
We explored the associations between interspecific gene expression differences and genomic divergence. Transcriptome data from five developmental stages of R. mole and R. simsii were collected to study interspecific differences in gene expression (Supplementary Fig. 6). Based on the comparative genomic results, genes overlapping with either specific or syntenic regions were counted. Genes overlapping with both regions were manually identified using IGV v2.16.0 [40]. And the genes that were not assigned to either cluster were not discussed in this study due to their relatively small quantity. The gene expression levels between specific regions and syntenic regions were also compared.
Flower color genes
Enzymatic genes from the biosynthetic pathways of major pigments (here, anthocyanins, carotenoids, and chlorophylls) determining flower color were annotated with the Ensemble Enzyme Prediction Pipeline (E2P2) package v3.1 (https://gitlab.com/rhee-lab/E2P2) [41], for each whole genome seven Rhododendron species. Metabolic pathways were followingly constructed with reference to PlantCyc (https://plantcyc.org/) based on the annotated protein sequences.
In this study, two types of gene duplicates were defined based on the following rules: genes physically located adjacent to each other on the same chromosome were defined as tandem duplication (TD) genes, while a pair of homologous genes located on the same chromosome and separated by 1 to 10 genes were defined as proximal duplication (PD) genes. Then the TD genes and PD duplication could be identified in the enzymatic genes were manually identified and counted.
Identification of pseudogenes
In this study, pseudogene sequences were identified and annotated using the default settings of the PseudoPipe pipeline [42], providing information on their chromosomal positions, sequences, and parent genes (i.e., homologous coding genes). To obtain high-quality pseudogene identification, the following filtering criteria were employed: (1) The sequence similarity in amino acid sequences between the pseudogene and parent gene should be greater than 30%; (2) The parent gene should cover more than 50% of the pseudogene.
Micro-collinearity in the flower color gene family
First of all, the gene counts and the proportion of TD and PD genes within gene families related to the biosynthesis of anthocyanins, chlorophylls, and carotenoids were counted. Among these gene families, the CHS gene family exhibited a higher gene count, with a substantial presence of TD and PD genes. We further explored the CHS gene family across different species of rhododendrons. Subsequently, these TD and PD genes were positioned on chromosomes. And the homologous chromosomal segments from the seven Rhododendron species with the highest gene counts were selected for visualization. BEDTools was employed to extract the seven homologous LTR-RTs surrounding these CHS genes. Finally, Muscle [43] was utilized to construct a phylogenetic tree for these TD and PD genes. Based on the subfamilies of these LTR-RTs and the phylogenetic tree of the CHS enzyme genes, collinearity relationships of these genes were inferred and visualized.
Results
TEs contribute to genome size variation
The constructed phylogenetic tree divides the Rhododendron species studied into three distinct groups consistent with the treatment of subgenera: the Hymenanthes (R. henanense, R. prattii and R. griersonianum), the Pentanthera (R. Molle) and the Tsutsusi subgenus (R. ripense, R. ovatum, and R. simsii) (Fig. 1a). Among these seven Rhododendron species, genome size is varied, ranging from 506.73 Mb (R. ripense) to 676.81 Mb (R. griersonianum) (Supplementary Table 1). Species with closely related phylogenetic relationships display minimal variation in genome sizes (Fig. 1a and Supplementary Table 1). For example, the Tsutsusi subgenus species (R. ripense, R. ovatum, and R. simsii) have relatively small genome sizes. A significant amount of TEs was found in Rhododendron genomes, with approximately half of the genomes composed of TEs across all species (42.00% (212.82 Mb)-55.51% (362.74 Mb)) (Table 1). We found a positive correlation between genome size and TEs content (Fig. 1b). Rhododendron species with larger genomes had higher proportions and quantities of TEs, while the Tsutsusi subgenus, characterized by smaller genomes, had a lower TE content (Fig. 1a and b). In all Rhododendron species, the most abundant classified TE was always LTR-RT, accounting for more than half of the total annotated TEs (59.66%-75.12%) (Table 1). We observed a low proportion of novel LTR-RTs (specific to one species) in seven Rhododendron species, indicating a high degree of shared evolutionary history among them (Table 1). At the superfamily level, the contribution of the Copia elements was similar across the seven genomes (3.60%-4.54%), while Gypsy elements exhibited significant interspecific variation and were much more prevalent than Copia (13.99%-26.82%) (Table 1). LTR-RTs and Gypsy elements show a positive correlation with genome size and were substantially more prevalent in the Hymenanthes and Pentanthera subgenera compared to the Tsutsusi subgenus (Fig. 1b). Therefore, both the overall TE abundance and LTR-RTs content exhibit distinct phylogenetic signals.
Fig. 1. Transposable elements (TEs) and genomes size differentiation among seven Rhododendron species. a Phylogenetic tree showing divergence times in Ericales and Cornales. The numbers represent divergence time of each node (Mya, million years ago), and the species names in bold represent the focal Rhododendron species studied in this article, as illustrated on the right side of the figure (R. henanense [20], R prattii [21], R. griersonianum [17], R. molle [21], R. simsii [18], R. ripense [44], R. ovatum [18]). b Correlation between genome sizes and the proportion of TEs, LTR-RTs and Gypsy elements in the genomes. And the size of dot represents the number of TE, LTR-RT and Gypsy. c The insertion time of intact Copia and Gypsy in genomes of R prattii,* R. henanense*, R. griersonianum, R. molle, R. simsii, R. ripense, R. ovatum, respectively
Table 1. The proportion of various transposable elements (TEs) in the genomes of seven Rhododendron speciesClassR. prattii**R. henanense**R. griersonianum**R. molle**R. simsii**R. ripense**R. ovatumLTR (%)32.6535.7438.8441.7026.2025.0627.65novel LTR (%)0.020.030.000.040.030.010.01LTR Copia (%)3.663.604.513.764.544.283.67novel LTR Copia (%)0.010.000.000.020.000.000.00LTR Gypsy (%)20.6122.2323.4926.8214.9013.9917.42novel LTR Gypsy (%)0.010.010.000.000.010.000.01LTR unknown (%)9.3711.0312.1712.917.537.557.43novel LTR unknown (%)0.010.020.000.010.010.010.00MITE (%)5.335.164.624.386.095.965.75novel MITE (%)0.040.010.010.010.010.030.01DNA (%)12.3911.5011.6310.4412.7512.2811.90novel DNA (%)0.760.660.520.350.520.410.50Helitron (%)0.490.490.450.420.470.460.47novel Helitron (%)0.290.220.110.060.160.190.19total TE (%)49.1951.2053.9855.5143.6442.0044.01novel total TE (%)0.820.700.530.390.560.450.51genome size (Mb)673.07634.29676.81653.46528.64506.73549.71**“novel”** means high copy number and specific-specific TEs identified with the SubPhaser pipeline [36] in any one of the seven species
Gypsy dominated evolution of TEs and genome size differentiation
The differential proportion of TEs among these seven species may be attributed to the variations in LTR-RTs overall generation capacity. LTR-RTs can be categorized into Intact LTR-RT (I), Solo-LTR (S), and Truncated LTR (T), and the birth and elimination rates can be assessed and ranked based on their abundance. Species in Rhododendron have markedly varied capacities for LTR-RTs generation and elimination, possibly related to differences in genome size. For instance, R. griersonianum has the highest generation rate, but its elimination rate is lower than R. molle and R. prattii, resulting in the largest genome size (Table 2). To investigate the source of interspecific variation in genome size caused by LTR-RTs, further analysis was conducted on their superfamilies. At the individual LTR-RT superfamily level, distinct abundances are observed among species (Table 3). Notably, among all the LTR Gypsy and Copia superfamilies in the Hymenanthes and Pentanthera subgenera, Retand has the highest representation in the genome (Table 3 and Supplementary Fig. 1). In the Tsutsusi subgenus, although Retand does not have the highest proportion, its content significantly differs from other subgenera of Rhododendron (Table 3).
Table 2. The birth and death of long terminal repeat retrotransposons (LTR-RTs) in seven Rhododendron speciesSpeciesIntact LTR-RT (I)Solo-LTR (S)Truncated LTR (T)S + TS + T + ISUM of All ModulesFiltered scaffold length (bp)Filtered IFiltered SFiltered TFiltered S/IFiltered T/IFiltered (S + T)/IS/I > 3ModuleSUMS/I > 3ModuleSUM/AllModuleSUM R. prattii 2,65621,2812,52323,80426,460401805,0002,47419,2382,3087.780.938.7120250.37% R. henanense 2,77015,4521,49016,94219,7124071,995,0002,75015,3371,4805.580.546.1219848.64% R. griersonianum 3,77528,6733,48732,16035,9354541,455,0003,71427,9503,4037.530.928.4421647.57% R. molle 3,23925,9543,75129,70532,944561335,0003,23025,9303,7488.031.169.1926747.59% R. simsii 2,09610,3601,87812,23814,334389900,0001,8809,0671,5934.820.855.6717244.21% R. ovatum 2,3948,8061,56510,37112,76547402,3948,8061,5653.680.654.3323248.94% R. ripense 2,2088,2361,4389,67411,8823782,245,0002,0717,8151,3543.770.654.4314939.41%“S/I > 3ModuleSUM” represents the module that maintains high removing rate when the ratio of solo LTR-RTs to intact LTR-RTs is more than 3. The ratio “S/I > 3 ModuleSUM/AllModuleSUM” represents the proportion of modules with high removing rate in the total number of modules
Table 3. The proportion of long terminal repeat-retrotransposons (LTR-RTs) superfamilies in the genomes of seven Rhododendron species Hymenanthes
Pentanthera
Tsutsusi R. prattii**R. henanense**R. griersonianum**R.* molleR*. *simsiiR*. ripense**R. ovatum Copia 21.28%20.80%24.14%18.30%37.83%38.19%26.09% Copia Ale 8.15%7.71%7.97%7.45%12.93%14.75%9.05% Copia Alesia 0.00%0.01%0.04%0.05%0.02%0.00%0.00% Copia Angela 2.12%2.21%2.87%1.40%5.38%5.75%1.84% Copia Bianca 0.22%0.21%0.52%0.46%0.20%0.26%0.66% Copia Ikeros 0.47%0.49%0.65%1.43%2.55%1.85%1.97% Copia Ivana 1.29%0.81%0.69%1.24%1.90%2.23%1.57% Copia SIRE 1.48%1.27%1.44%1.39%1.77%2.20%1.98% Copia TAR 2.43%2.71%3.53%2.18%5.55%5.00%3.89% Copia Tork 4.26%4.51%5.33%2.05%6.15%4.98%4.14% Gypsy 47.85%51.20%45.96%52.08%40.12%43.38%53.24% Gypsy Athila 11.36%12.04%10.95%12.51%12.61%12.22%15.13% Gypsy CRM 1.17%1.53%2.39%1.78%3.12%2.50%2.30% Gypsy Galadriel 0.03%0.05%0.10%0.17%0.10%0.06%0.20% Gypsy Ogre 8.90%8.15%8.34%8.94%8.17%8.90%10.55% Gypsy Reina 0.17%0.13%0.06%0.12%0.32%0.37%0.33% Gypsy Retand 20.06%21.68%15.52%19.07%5.76%6.15%10.03% Gypsy TatIII 0.00%0.01%0.00%0.00%0.00%0.00%0.00% Gypsy Tekay 5.51%7.02%7.39%8.45%9.13%12.26%13.15%Unclassified1.51%1.48%2.33%1.69%2.29%2.11%2.53%genome size (Mb)673.07634.29676.81653.46528.64506.73549.71
All seven species of Rhododendron exhibit a single ancient peak of LTR-RT accumulation within 2 million years ago (Mya), and the size of this peak aligns with the phylogenetic relationships within the Rhododendron genus (Fig. 1c). Recent outbreaks of Gypsy and Copia elements have been observed, but the peak sizes of these elements vary among different subgenera, with the Gypsy peaks in the Hymenanthes and Pentanthera subgenera being substantially taller than the Copia peaks. Additionally, in comparison to members of the Tsutsusi subgenus, significant expansions of the Gypsy element have occurred within the genomes of the Hymenanthes and Pentanthera subgenera over the past 2 Mya. It is apparent that the regional differentiation of genomes has been greatly aided by the abundance of LTR-RTs, particularly the Gypsy superfamily. Further analysis indicates that the dominant activity in the genomes of Hymenanthes and Pentanthera subgenus is likely mainly due to the significant activity of Retand, a Gypsy superfamily member (Supplementary Fig. 2 and Supplementary Fig. 3).
LTR-RTs associated with structural variations
Comparative genomic analyses revealed considerable structural variation among seven Rhododendron species, including species-specific regions (SPE, 31.16%-45.38% of the genome), and notable inversion regions (INV, 10.15%-18.17%) (Fig. 2a and b and Supplementary Table 2). And large species-syntenic regions (SYN, 37.36%-48.38%) were maintained in the Rhododendron genus. The Tsutsusi subgenus, characterized by the lowest content of TEs, had the largest amount of SYN, whereas the other two Rhododendron subgenera showed a higher proportion of SPE (Fig. 2b; Table 1).
Fig. 2. Transposable elements (TEs) and structural variation among Rhododendron species. a Structural variations detected with whole-genome alignments among the seven Rhododendron species (R. prattii, R. henanense, R. griersonianum, R. molle, R. simsii, R*. ripense*, R. ovatum). b Summary of structural variations. c The number of LTRs overlapping with structural variations in the seven Rhododendron species. d Insertion times in the seven Rhododendron species of LTR-RTs.
As the most abundant genomic fraction of TEs, LTR-RTs were found to be generally associated with genomic structural variations. The actual overlap of Rhododendron LTR-RTs with INV and SPE was significantly greater than the random distribution, while the actual overlap with SYN was significantly smaller (Fig. 2c). Furthermore, we found a substantial bias in the species-specific LTR-RTs content in 7 Rhododendron species, with INV (0.344%-11.361%) and SPE (0.408%-8.653%) showing significantly higher levels, whereas SYN had much lower content (0.111%-3.786%) (Table 4). In the Rhododendron species, the proportion of species-specific LTR-RTs in INV was found to be highest within the Hymenanthes and Pentanthera subgenera, surpassing those in SPE (Table 4). The majority of these species-specific LTR-RTs inserted in the INV and SPE of the seven Rhododendron species were Gypsy, albeit with differences in their subfamilies (Table 4). In the subgenus Hymenanthes, the primary subfamily was Ogre, in subgenus Pentanthera, it was Retand, and in subgenus Tsutsusi, there were significant insertions of Ogre, Retand, and Tekay (Table 4). Furthermore, the insertion times of these species-specific LTR-RTs varied among the seven Rhododendron species, with their insertion orders largely consistent with the Rhododendron inter-species differentiation sequence (Figs. 1a and 2d). The majority of LTR-RTs were recent insertions and occurred after the divergence of these Rhododendron species (~ 7 Mya) (Figs. 1a and 2d).
Fig. 3. Differential expression between pigment biosynthetic genes from specific and syntenic regions. a Differential expression of all pigment (anthocyanin, chlorophyll, carotenoid) biosynthetic genes from specific and syntenic regions identified between R. molle and R. simsii genomes. Significance of difference is tested with Student's t test. *** p < 0.001, ** p < 0.01, * p < 0.05, ns p > 0.05. Differential expression of genes from anthocyanin (b), chlorophyll (c), carotenoid (d) biosynthesis.
Table 4. The proportion of species-specific LTR-RTs in the inversion, specific and syntenic regionsR. prattii**R. henanense**R. griersonianum**R. molle**R. ripense**R. simsii**R. ovatumClassINVSPESYNINVSPESYNINVSPESYNINVSPESYNINVSPESYNINVSPESYNINVSPESYN Copia 0.0000.0050.0020.0000.0060.0000.1620.2430.0760.2800.4420.2550.1130.0470.0550.0330.0150.0000.1060.2190.198Copia_Ale0.0000.0010.0020.0000.0000.0000.0110.0480.0180.1500.1380.1000.0440.0070.0340.0000.0050.0000.0170.0500.044Copia_Tork0.0000.0020.0000.0000.0000.0000.1200.1340.0480.0180.0760.0190.0000.0000.0030.0000.0000.0000.0220.0310.029 Gypsy 1.6961.2190.2210.5310.4030.0814.1872.9791.28011.0708.2033.3310.8330.6570.6470.3110.4540.1984.4574.0693.588Gypsy_Athila0.0000.0030.0000.0000.0000.0000.2710.2730.2460.4830.9770.6950.0170.0380.0160.1860.2360.0970.3930.3500.299Gypsy_Ogre1.6641.2070.2210.5310.3800.0772.2161.2770.2073.9642.5250.6630.3870.2430.2930.0200.1210.0560.6410.4470.439Gypsy_Retand0.0290.0090.0000.0000.0150.0051.1260.7370.3834.3923.4071.4410.2820.2760.2620.0000.0130.0002.6852.4252.126Gypsy_Tekay0.0000.0000.0000.0000.0070.0000.5610.6620.4382.0811.2110.4700.1170.1000.0760.1050.0730.0450.7020.8160.661Total LTR1.6961.2270.2220.5310.4080.0814.3503.2271.36311.3618.6533.5880.9460.7040.7010.3440.4690.1984.5634.2883.786“INV”, “SPE”, and “SYN” designate the chromosomal inversions, species specific regions, and designates syntenic blocks, respectively
TE involved in Spatiotemporal coordination of gene expression
In this study, we observed significant differences in gene expression between interspecific syntenic regions and specific regions during five flower development stages of R. molle and R. simsi (Fig. 3a and Supplementary Fig. 6). We hypothesize that TEs in proximity to genes may influence gene expression, resulting in decreased expression levels. Interestingly, the interspecific specific regions were enriched with more TEs, particularly members of the Gypsy elements, while TE insertions are less frequent in syntenic regions. This provides strong evidence that TEs can indeed influence the transcriptional expression levels of genes.
Fig. 4. Gene duplication and loss of pigment (Anthocyanin, Chlorophyll, Carotene) biosynthesis enzymatic genes. a Barplot shows the counts of enzymatic gene families from different biosynthesis pathways of anthocyanin, carotenoid and chlorophyll. b The number of tandem duplication (TD) and proximal duplication (PD) genes from different biosynthesis pathways. c The pseudogene numbers from different biosynthesis pathways.
We also compared the expression levels of enzymatic genes from the biosynthesis pathways of major pigment such as carotenoid, chlorophyll, and anthocyanin between R. molle and R. simsi. In addition to chlorophyll-related genes, the pigment-related genes involved in floral coloration (anthocyanins and carotenoids) demonstrate a remarkable difference in gene expression within interspecific syntenic regions as compared to specific regions (Fig. 3b-d). These genes may play a key role in determining the color of the flowers in the five different stages of flower development and the variations in their transcriptional expression levels could potentially be influenced by TEs.
Fig. 5. Micro-synteny of CHS genes in seven Rhododendron species and the resolved gene duplication and loss events. Here blue triangles represent LTR, red squares represent TD and PD genes, and yellow squares represent pseudogenes. And the grey dashed line represents the absence of syntenic genes in the corresponding species. a A gene is present containing a conserved LTR-RTs element (00000757 LTR unknown) in all seven species. **b **a conserved gene was found in R. prattii and R. henanense, and contained a conserved LTR-RTs element (TE_00010703 LTR/Copia) (purple). And three species from the *Tsutsusi *subgenus have a specific synteny gene (blue). c two CHS TD/PD genes show conservation in all seven Rhododendron species. d Three CHS genes show specific synteny in the Tsutsusi subgenus. e A CHS gene exhibiting collinearity across all Rhododendron species undergoes specific amplification in R. prattii and R. henanense, followed by pseudogenization. f A CHS gene showing synteny in the Tsutsusi and Pentanthera subgenera becomes a pseudogene in the Hymenanthes subgenus. g Two specific CHS gene in R. prattii and R. henanense become pseudogenes.
TEs’ potential role in gene duplication and pseudogenization
The number of enzymatic genes annotated as anthocyanin biosynthesis varied from 108 to 165 (49%-58%), which is considerably higher than the 56 genes (41%) annotated in A. thaliana and 93 genes (38%) in A. chinensis (Supplementary Table 3). Conversely, the number of chlorophyll and carotenoid biosynthesis genes showed a small variation among the seven Rhododendron species, ranging from 48 to 66 genes (Supplementary Table 3). The gene families of anthocyanin biosynthesis were generally larger than that of the carotenoid- and chlorophyll biosynthesis (Fig. 4a and Supplementary Table 3).
Further investigation revealed that the expansion of these pigment biosynthesis gene families was resulted from gene duplication, notably tandem duplication (TD) and proximal duplication (PD). The number of TD and PD genes related to anthocyanins in the seven Rhododendron species ranged from 49 to 95, accounting for 38%-58% of all anthocyanin-related genes, which is significantly higher than that observed in A. thaliana (30%) and A. chinensi (27%) (Fig. 4b, Supplementary Tables 4 and Supplementary Table 5). While TD and PD genes represented 16% − 29% in the carotenoid-related gene sets, and even lower proportions in the chlorophyll-related gene sets, with only 10% − 26% (Fig. 4b, Supplementary Table 5). These findings suggest that TD and PD genes have driven the expansion of the gene families of pigment biosynthesis which may associate with the distinct flower color diversity among Rhododendron.
TEs’ potential role in gene duplication and pseudogenization related to flower color transition among Rhododendron species
We further investigated the pseudogenization of genes from three pigment biosynthetic pathways in seven Rhododendron species (Fig. 4c and Supplementary Table 6). Few pseudogenes were found in the carotenoid and chlorophyll biosynthesis, with only 3 to 10 pseudogenes identified across the seven Rhododendron species (Fig. 4c). In contrast, a large number of pseudogenes were discovered in the anthocyanin biosynthetic gene families, particularly in R. henanense and R. prattii**(Fig. 4c)**. This pseudogenization phenomenon led to a significant contraction of the anthocyanin biosynthetic gene family of R. henanense and R. prattii, which is noteworthy as flowers of both two species are in white without anthocyanin pigmentation. R. molle exhibited the second highest number of pseudogenes, with 26 pseudogenes in the anthocyanin gene families (Fig. 4c). On the other hand, R. simsii, R. ovatum, R. ripense, and R. griersonianum had a relatively small number of pseudogenes in the anthocyanin gene families, and their flowers display a range of red color (Fig. 4c). This suggests that the number of encoded genes in the anthocyanin gene families has contracted in the yellow-flowered Rhododendron species, R. molle, relative to red-flowered species.
Investigation of the association of LTR-RTs and gene duplication and loss provides valuable insights. Within the Chalcone synthase (CHS) family, a relatively high proportion of duplications and pseudogenizations were observed, which may contribute mostly to the expansion of CHS family (Supplementary Tables 8 and Supplementary Fig. 7). CHS is the first enzyme in flavonoid biosynthesis and a key enzyme in anthocyanin synthesis. We identified a conserved TD and PD CHS gene cluster present in all Rhododendron species (Supplementary Fig. 8 and Supplementary Table 7). The variation in gene number within the cluster may be associated with specific gene duplications and loss (pseudogenization) events. One possible mechanism for the formation of TD and PD and pseudogenes is through the insertion of TEs, as we found a substantial number of LTR-RT insertions upstream, downstream, and within the CHS genes, indicating their close association with the formation of TD/PD duplicates.
We selected the highest-count homologous chromosomal segments from the seven Rhododendron species for case studies. By constructing phylogenetic trees for these TD and PD genes and analyzing the homology of LTR-RTs surrounding the genes, we inferred the complex evolutionary relationships among genes in Rhododendron species (Supplementary Fig. 9 and Supplementary Table 7): (1) A gene that is completely conserved among species. For example, a gene is present in all seven Rhododendron species containing a conserved LTR-RTs element (00000757 L unknown) (Fig. 5a), implying that this gene originated in the ancestor of Rhododendron; (2) A gene that is conserved in specific species. For example, three Rhododendron species from the Tsutsusi subgenus show a specific synteny relationship (Fig. 5b), while missing in others, indicating the origin of this gene in the ancestor of Tsutsusi. In R. prattii and R. henanense, a gene with conservation was found, and both contained a conserved LTR-RTs element (TE_00010703 LTR/Copia) (Fig. 5b), suggesting that this gene originated before the divergence of R. prattii and R. henanense; (3) Clusters of multiple duplicated genes are conserved among rhododendrons. For example, two CHS TD/PD genes show conservation in all seven Rhododendron species (Fig. 5c), and three genes show specific synteny in the Tsutsusi subgenus (Fig. 5d), indicating gene duplications occurring prior to the differentiation of the entire genus Rhododendron and the Tsutsusi subgenus. (4) Pseudogenization is associated with the loss of family members. A gene showing synteny in the Tsutsusi and Pentanthera subgenera has undergone loss-of-function variation and become a pseudogene in the Hymenanthes subgenus (Fig. 5f). Moreover, some genes have undergone amplification in specific species and subsequently became pseudogenes (Fig. 5e and g).
The complexity of gene duplication and pseudogenization may be attributed to the movement of LTR-RTs. Compared to other Rhododendron species, R. prattii exhibited a high frequency of gene duplication events (Fig. 4b). Additionally, R. prattii and R. henanense contained eight and four pseudogenes, respectively, within this gene cluster (Supplementary Tables 7 and Fig. 4c). Except for R. simsii, which did not exhibit pseudogenization in homologous chromosomes, only 1–2 CHS genes underwent pseudogenization in the other Rhododendron species (Supplementary Tables 7 and Fig. 4c). Correspondingly, within this gene cluster region, R. prattii had the highest content and number of LTR-RTs (Supplementary Fig. 10).
Discussion
Transposable elements (TEs) influence genome size and chromosome arrangements significantly, particularly in species where TEs comprise a substantial portion of the DNA [45]. In this study, we performed a whole-genome analysis to identify and compare repetitive sequences in the genomes of seven Rhododendron species. Our findings revealed that TEs accounted for approximately half of the genome size in published Rhododendron genomes. Changes in the number of repetitive elements are frequently cited as the cause of genome size variance amongst species with the same chromosome number [46, 47]. This phenomenon was confirmed in these seven Rhododendron species studied here, where the proportion of TEs positively correlated with genome size and agreed with their phylogenetic relationships. Notably, long terminal repeat retrotransposons (LTR-RTs) had the highest abundant among all TEs, aligning with previous studies suggesting that LTR-RTs are key factors influencing plant genomes [48, 49]. The transposition mechanism of LTR-RTs allows them to influence genome size and structure during transposition [50–52]. By quantifying the rates of LTR-RTs creation and removal, we were able to explain how transposons impact genome size. It was revealed in the present study that the proportion of novel LTR-RTs unique to the seven Rhododendron species was very low, suggesting similar evolutionary histories among them.
We also estimated the insertion times of Gypsy and Copia elements and found recent bursts in both types of LTR-RTs. Previous studies have shown that the repetitive nature of many plant genomes is determined by a few highly abundant LTR-RT families. For instance, the Gypsy superfamilies dominates the genomes of tea [53] and Arabidopsis thaliana [52], while the Copia retrotransposon family prevails within the grapevine genome [54]. In Rhododendron, Gypsy-type LTR-RTs had a significant role in recent dynamic changes in genome size, especially in the Hymenanthes and Pentanthera subgenera. Also, the Retand element within the Gypsy family stands out as a key element driving these changes. This suggests that the distinct interspecific variations in the repetitive sequence of Gypsy-Retand contribute to the relative expansion of genome size in the Hymenanthes and Pentanthera subgenera. Interestingly, within the Gypsy family, the Retand element appears to be particularly responsible for this phenomenon. These findings underscore the crucial role of LTR-RTs as driving factors behind species divergence and diversification.
The regions surrounding TEs vary extensively, and represent the unstable and species-specific regions of genomes [55]. Our comparative genomic analysis identified inter-specific chromosomal structural variations at the whole-genome level. Although there are some syntenic and conserved regions among these species, we discovered that variances still occur to varied degrees. The higher accumulation of LTR-RTs around inversion regions (INV) and species-specific regions (SPE), particularly of the Gypsy, demonstrates that the insertion of specific clade LTR-RTs may be one of the causes of interspecific variation in Rhododendron species. Furthermore, our study found that genes located in specific regions of the Rhododendron genomes have lower expression levels compared to genes located in syntenic regions. We also observed that genes associated with anthocyanin and carotenoid biosynthesis in the specific regions demonstrated significantly reduced expression compared to genes related to chlorophyll. This is in line with previous findings in A. thaliana and soybean, where genes containing TEs were found to have slightly lower average expression levels [56–58]. This suggests that TE insertions, which are more abundant in specific regions, may influence the expression of certain genes during the flowering process of rhododendron. However, more research is needed to investigate the underlying mechanisms.
In Rhododendron species, flower color is a highly important and extensively studied trait, largely determined by the type and quantity of pigments present in the petals [59]. By annotating the anthocyanin, chlorophyll, and carotenoid metabolic pathways, we discovered that Rhododendron species possess the highest number of genes associated with anthocyanin biosynthesis. Furthermore, rhododendrons exhibit a higher percentage of anthocyanin-related genes compared to A. thaliana and sunflower, corroborating previous research that highlights the primary role of anthocyanins in influencing flower color in Rhododendron species [2, 9]. In the present study, we identified a significant number of tandem duplication (TD) and proximal (PD) duplication in anthocyanin biosynthetic gene families across the seven rhododendrons. This finding suggests that TD and PD events distinctly contribute to the expansion of anthocyanin-related genes in Rhododendron. At the gene family level, we examined the CHS gene family to better understand the patterns of gene gain and loss differentiation between species. Numerous collinearity relationships were observed among these TD and PD genes within the CHS gene family among Rhododendron species, along with a substantial presence of homologous LTR-RTs near these genes. TEs, particularly LTR-RTs, are a potential mechanism for generating TD and PD [60], and our results strongly indicate a close association between TD and PD in anthocyanin biosynthetic genes and LTR-RT elements.
Repetitive sequences, as a powerful driving force behind genomic variation, can actively or passively induce ontogenetic variations during gene birth and elimination processes [61]. This includes gene duplications and losses. Pseudogenization, which are gene remnants that have lost their function, represent an important pattern of gene loss [62, 63]. In our study, we focused on analyzing pseudogenization of genes involved in anthocyanin, chlorophyll, and carotenoid biosynthesis. The results revealed a higher prevalence of pseudogenization in the anthocyanin-related gene families of R. henanense, R. prattii, and R. molle. Interestingly, these three Rhododendron species exhibit white and yellow flower colors, whereas species with red flowers, such as R. simsii, R. ovatum, R. ripense, and R. griersonianum, showed lower degrees of pseudogenization. This finding further supports the hypothesis that anthocyanins may play a crucial role in shaping flower color in Rhododendron species. Overall, our study identifies both gene duplications and losses as common occurrences in the anthocyanin biosynthesis gene families. We speculate that this phenomenon may contribute to the significant diversity and variation in flower color observed in Rhododendron, with anthocyanins serving as important effectors in this process.
Conclusion
In this study, we collated genomic data from seven high-quality, published Rhododendron species. This data was used to identify repetitive sequences and conduct an inter-species comparative genomic analysis. Transposable elements (TEs) were shown to comprise half of the genome size within the Rhododendron genus. Predominantly, long terminal repeat retrotransposons (LTRs) demonstrated a consistent correlation with genome size and phylogenetic relationships. This commonality can be attributed to the production and elimination rates of these elements. Species-specific regions (SPE), inversion regions (INV), and species-syntenic regions (SYN) were identified in the genomes of the seven Rhododendron species. Different proportions of LTRs were also identified. The prevalent occurrence of Gypsy, a principal LTR-RTs element, suggests it may play a key role in driving inter-species structural variations. In addition, we probed the mechanisms by which LTRs affect pigment-related genes at a whole-genome level, using members of the CHS gene family as examples. Our study found that gene duplication, loss and corresponding expression associated with flower color could be influenced by TEs. Notably, the anthocyanin-related gene family, which impacts flower color, is characterized by numerical amplifications and pseudogenization in the Rhododendron genus. Our research underscores the pivotal role of TEs in dictating the complexity and floral color diversity of the Rhododendron genome, providing valuable insights into how TEs drive inter-species variations.
Supplementary Information
Supplementary Material 1.
Supplementary Material 2.
The reference list from the paper itself. Each links out to its DOI / PubMed record.
- 1Sleumer H. Ein system der gattung Rhododendron L. 1949.
- 2Stevenson J. The species of Rhododendron: Rhododendron Society. 1930.
- 3Krebs SL. Rhododendron. In: ornamental crops. Springer. 2018. 673–718.
- 4Mc Clintock B. Controlling elements and the gene. Cold spring harbor symposia on quantitative biology: 1956. Cold Spring Harbor Laboratory Press; 1956. pp. 197–216.10.1101/sqb.1956.021.01.01713433592 · doi ↗ · pubmed ↗
- 5Zhang L, Xu P, Cai Y, Ma L, Li S, Li S et al. The draft genome assembly of Rhododendron delavayi Franch. var. delavayi. Giga Science. 2017. 6:gix 076.10.1093/gigascience/gix 076PMC 563230129020749 · doi ↗ · pubmed ↗
- 6Ou S, Collins T, Qiu Y, Seetharam AS, Menard CC, Manchanda N et al. Differences in activity and stability drive transposable element variation in tropical and temperate maize. bio Rxiv. 2022:2022.2010. 2009.511471.10.1101/gr.278131.123PMC 1144418339251347 · doi ↗ · pubmed ↗
- 7Ericaceae. Rhododendron mucronatum var. ripense. 2007. [http://treeflower.la.coocan.jp/Ericaceae/Rhododendron%20mucronatum%20ripense/Rhododendron%20mucronatum%20ripense.htm