Deleterious Mutations in the Mitogenomes of Cetacean Populations
Matthew Freeman, Umayal Ramasamy, Sankar Subramanian

TL;DR
This study analyzed mitochondrial genomes of cetaceans to find large variations in genetic diversity and deleterious mutations, which could help prioritize conservation efforts.
Contribution
The study provides the first comparative analysis of mitogenomic diversity and deleterious mutation rates across 32 cetacean species.
Findings
There is a 78-fold variation in mitogenomic diversity among cetacean populations.
A 22-fold difference in the dN/dS ratio suggests significant variation in effective population sizes.
Endangered cetacean species have higher dN/dS ratios compared to species of least concern.
Abstract
Here, we examined genetic diversity and the fraction of deleterious mutations by analysing 2244 mitochondrial genomes from 65 populations across 32 cetacean species, including whales, dolphins, and porpoises. The ratio of nonsynonymous-to-synonymous diversities (dN/dS) was used as the proxy for the proportion of deleterious mutations. Our results revealed a 78-fold variation in mitogenomic diversity and a 22-fold difference in the dN/dS ratio among the cetacean populations. The large differences observed in the two measures suggest a substantial variation in the effective sizes of cetacean populations. We also observed a negative relationship between genetic diversity and dN/dS ratios. These results suggest that small cetacean populations have low diversity and a low dN/dS ratio, whereas the reverse pattern holds for large populations. Our analysis revealed a high dN/dS ratio for…
Genes, proteins, chemicals, diseases, species, mutations and cell lines named across the full text — each resolved to its canonical identifier and authoritative record.
Click any figure to enlarge with its caption.
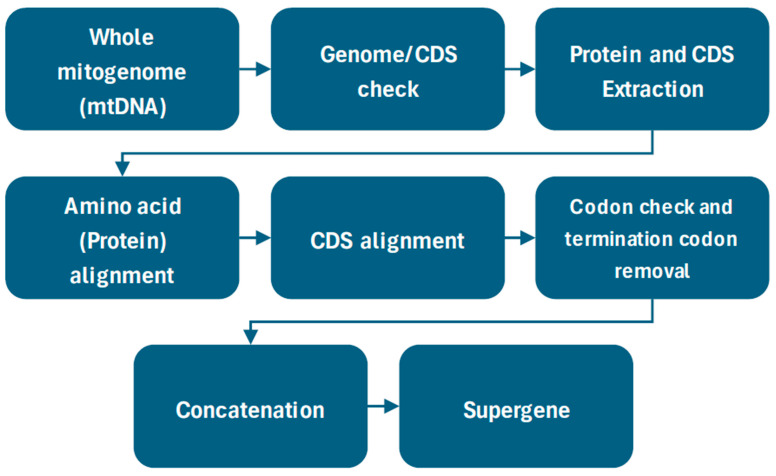 Figure 1
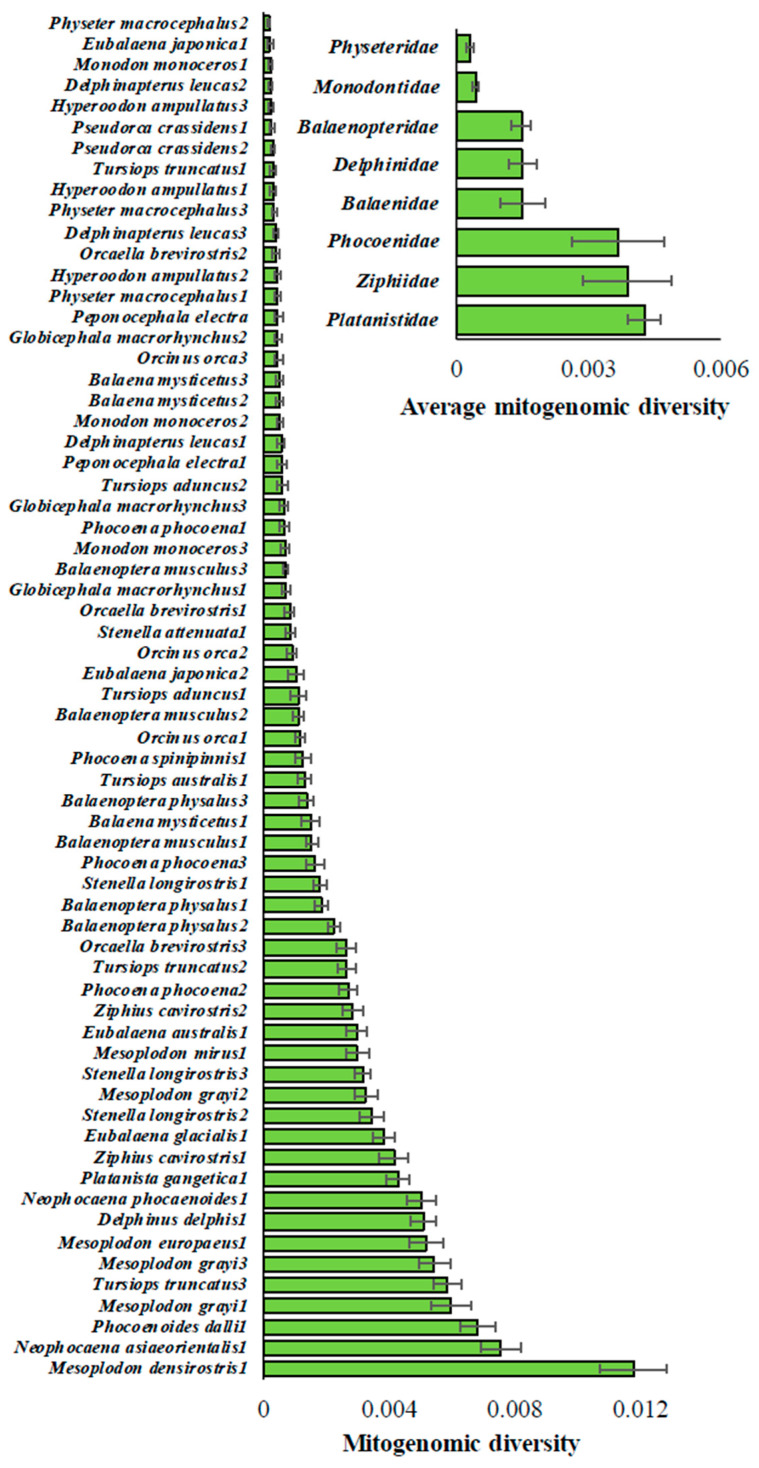 Figure 2
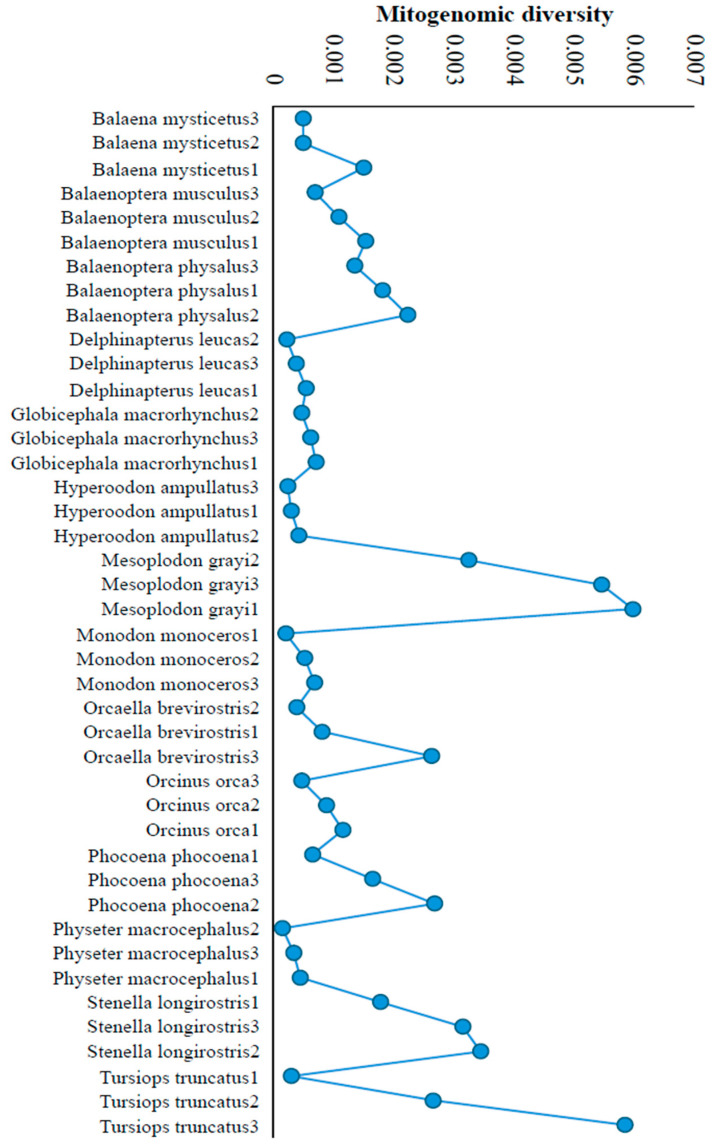 Figure 3
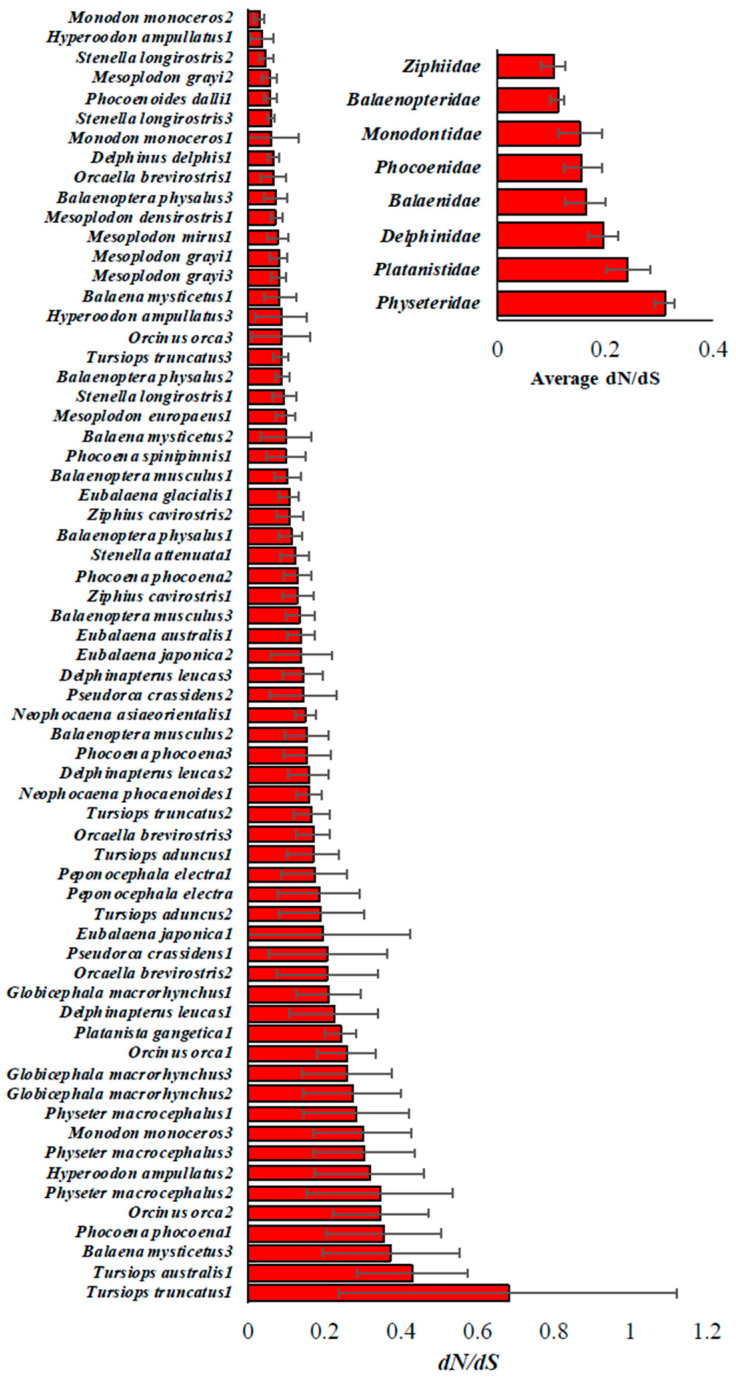 Figure 4
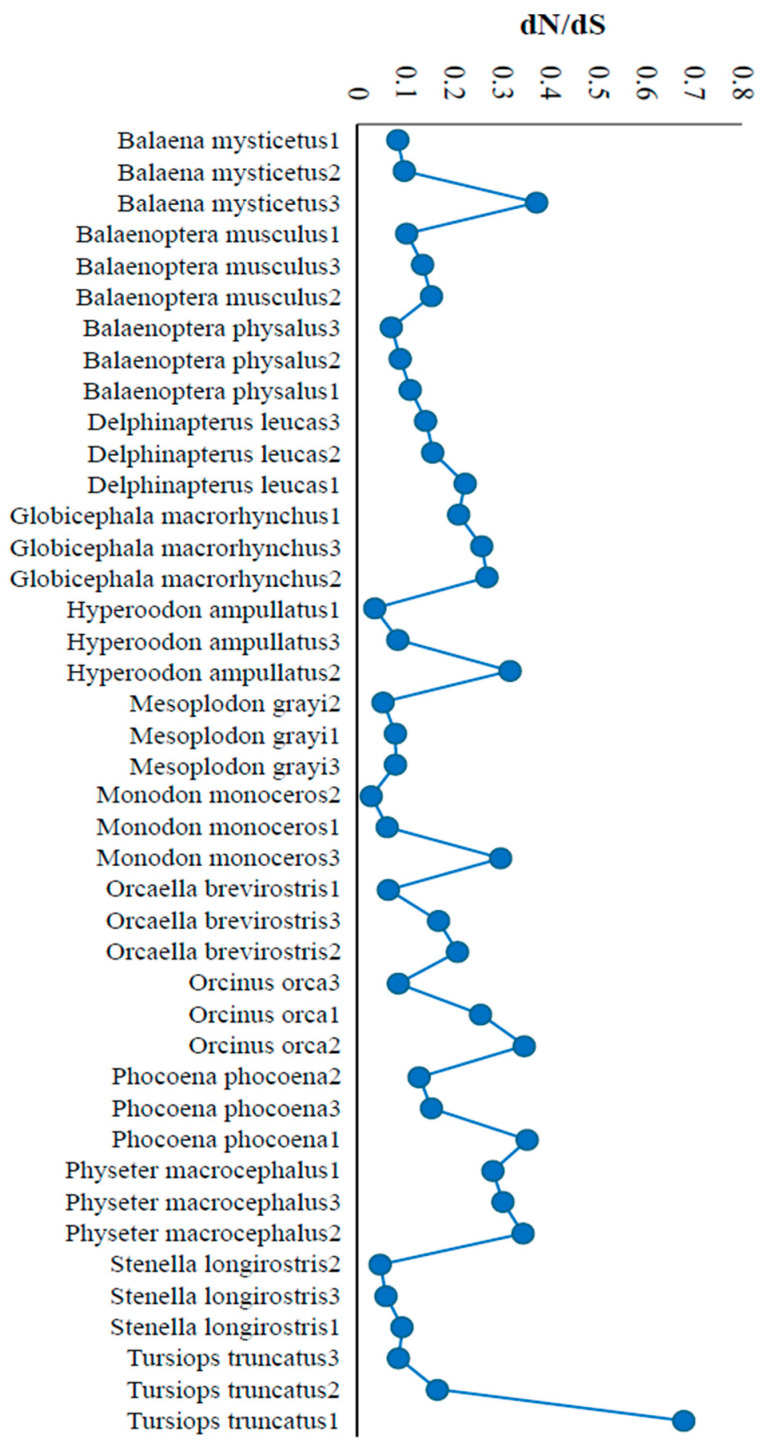 Figure 5
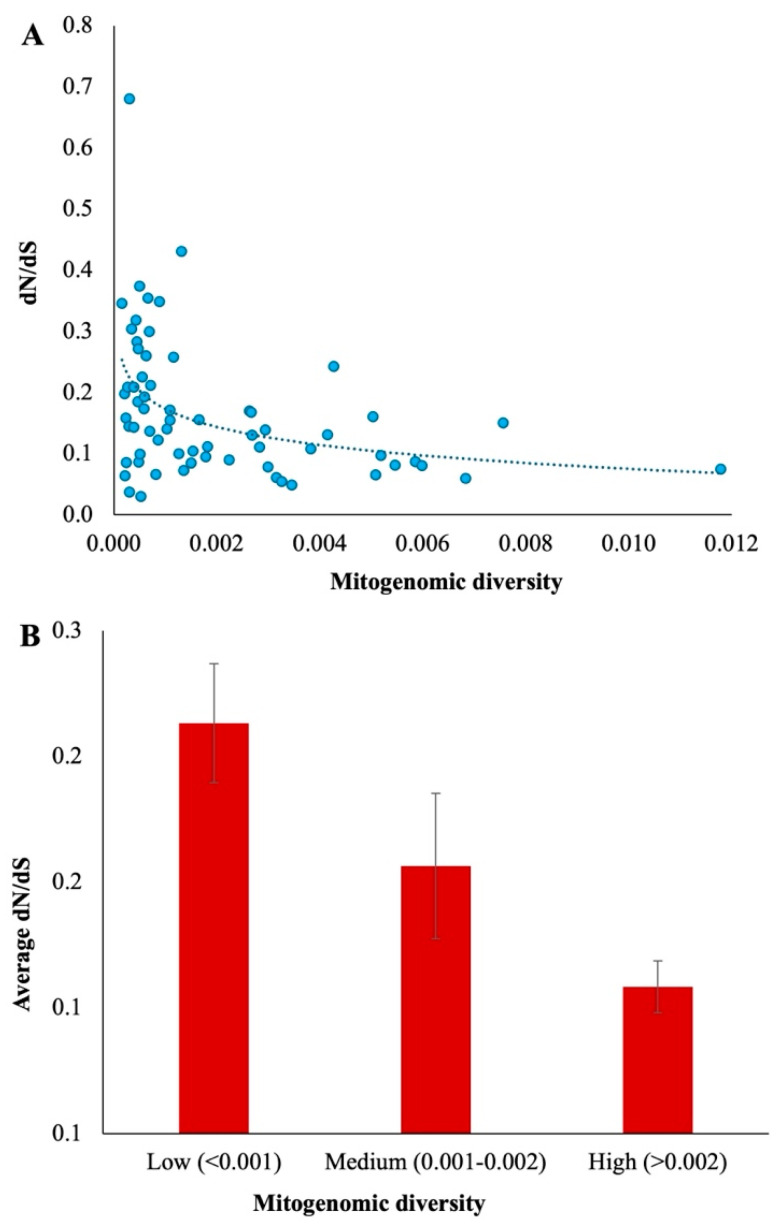 Figure 6
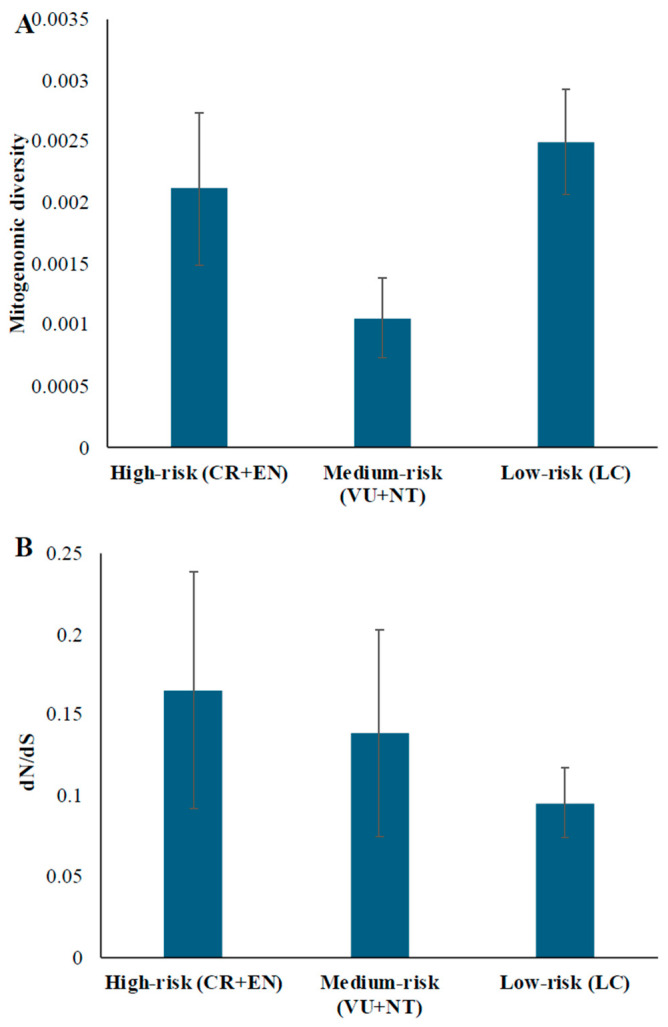 Figure 7
- —University of the Sunshine Coast
Peer Reviews
No public reviews on file for this paper yet. If you reviewed it on a platform where reviews are public (OpenReview, ICLR, NeurIPS, ICML), you can paste yours below so the community can read it here.
Videos
No videos yet. Explain this paper in a talk, walkthrough, or lecture? Add one.
Taxonomy
TopicsMarine animal studies overview · Genetic diversity and population structure · Ichthyology and Marine Biology
1. Introduction
The infraorder Cetacea refers to aquatic marine mammals, including whales, dolphins, and porpoises, that are distributed throughout the world’s oceans and freshwater bodies, inhabiting a diverse array of habitats [1]. Most of the cetaceans have been hunted by humans over a long period of time, and during the industrialisation era, the advent of steam ships and explosive harpoon guns enabled large-scale whaling in all major oceans [2]. This significantly reduced the effective population sizes (N_e_) of most cetaceans. It is well known that population size reduction causes population bottlenecks and an increased rate of inbreeding [3,4]. This results in reduced heterozygosity within cetacean populations. For example, the isolated population of Fin Whales in the Gulf of California (GOC) was further reduced by industrial whaling, resulting in a severe decline in heterozygosity [5].
Importantly, the reduction in N_e_ leads to the accumulation of deleterious mutations in nuclear and mitochondrial genomes [4]. Many previous studies have quantified the mutation loads in terrestrial mammals using the ratio of diversities (dN/dS) at nonsynonymous (dN) and synonymous sites (dS) [6,7,8,9,10,11,12,13,14,15,16,17]. Nonsynonymous mutations can harm the organism as they change the amino acid encoded by the codon, and in contrast, synonymous mutations are neutral or harmless as they do not change the amino acid encoded. Therefore, the ratio of these two reflects the proportion of harmful nonsynonymous mutations present in a population. Using this measure, previous studies compared the mutation loads of large and small or bottlenecked populations. For instance, a study comparing eastern gorillas before and after a severe population decline observed an elevated proportion of deleterious nonsynonymous mutations in the present population owing to a bottleneck [16]. Similar elevated dN/dS ratios were observed for island dingoes [9], island foxes [12], and island kakapos [6] in comparison with their mainland cousins. Higher dN/dS ratios were also observed for landlocked salmons compared to their ocean counterparts [15]. Since the N_e_ of island (or landlocked) populations are typically smaller than their mainland counterparts, the higher dN/dS ratios are caused by a reduction in N_e_. The process of domestication also introduces a severe bottleneck. This is evident from the elevated dN/dS ratio observed for the domesticated dog [11], silkworm [10], yak [18], rice [19] and sunflower [20] compared to their wild counterparts.
The mitochondrial genomes of most cetaceans have been sequenced, and this data was used to investigate their heterozygosity and phylogenetic relationship. However, the deleterious mutation load of cetacean mitogenomes has not been studied previously. Furthermore, most earlier studies were conducted on independent cetacean species, genus or families. No study has compared their diversity and the proportion of deleterious mutations across all cetaceans. Such a study is necessary as it will reveal the magnitude of difference in these measures across species and families. This is important for future conservation management strategies to estimate the extinction risk of each cetacean species and population. This is because it is well documented that accumulation of deleterious mutation load leads to eventual extinction, as observed for the Wrangel Island woolly mammoth [13].
Therefore, we conducted a comparative analysis of 2244 mitochondrial genomes from 32 cetacean species. We identified the populations within species and compared the diversity and the fraction of deleterious mutations across all cetacean populations. We also obtained the IUCN conservation status for these species and compared the proportions of deleterious mutations across species belonging to conservation statuses.
2. Methods
2.1. Genome Data
The sequences of assembled and annotated complete mitogenomes of all available Cetacean species were downloaded from the National Center for Bioinformatics Information [21]. This dataset consisted of 2347 completed mitochondrial genomes. Species with fewer than 5 individual genomes were excluded, reducing the dataset to 2253 genomes. The downloaded GenBank files were checked for 13 protein-coding DNA sequences (protein-CDS), and only genomes containing all 13 mitochondrial protein-CDS were included for further downstream analysis. This filtration removed 9 genomes, leaving a final dataset of 2244 mitogenomes from 32 species of Cetaceans and 8 families (Table 1).
2.2. CDS Extraction and Alignment
The amino acid (protein) and CDS sequences were extracted from the protein-coding genes. We included only 12 genes coded in the heavy strand (ATP6, ATP8, COX1, COX2, COX3, CYTB, ND1, ND2, ND3, ND4, ND4L, and ND5). We excluded the ND6 gene on the light strand, as its base composition and mutation patterns are drastically different from those of the other 12 genes on the heavy strand [22,23]. The extracted protein sequences of the genes were aligned using the programme MUSCLE ver 3.8 [24], and the CDS alignment was created using the protein alignments as a guide. This method generated the CDS alignment while preserving the codons within their correct reading frames. The termination codons present at the end of the CDS were removed as they are not useful in estimating heterozygosity or dN/dS ratio, and codons containing even a single ‘N’ (unknown) nucleotide were also removed. The nucleotides of the 12 protein-coding genes were concatenated into a single supergene, which was then used for further downstream analyses (Figure 1).
2.3. Identification of Distinct Populations
The species in our Cetacean dataset consist of genomes of 2244 individuals, which may belong to one or more populations within each species. To identify distinct populations, we converted the supergene in fasta format to Variant Call Format (VCF) files containing only the variable sites of the genomes using a custom script. The Multidimensional scaling (MDS) method was then used to group the genomes based on their genetic relatedness using the software Plink ver. 1.9 [25]. The MDS files were used to produce a scatter plot for each species, and groupings were manually curated via visual inspection using a custom Graphical User Interface (GUI). This allowed manual editing of the groups, removing the genomes located between two groups, which could be the result of introgression. These analyses identified 52 distinct populations across 19 species, and the remaining 13 species had only a single population (which may also be due to limited sampling) (Table 1).
2.4. Genome Data Analysis
The supergene alignment was used to calculate nucleotide diversity within a population, which was estimated using the Nei and Li method [26]. The diversities at the nonsynonymous (dN) and synonymous positions (dS) were calculated using the Pamilo-Bianchi-Li method [27,28]. All these calculations were performed using the command-line version of the software MEGA-CC ver. 11 [29], and positions in alignments with gaps were excluded using the complete-site deletion option. To compute the standard error, the bootstrap method with 1000 pseudo-replicates was used.
2.5. Conservation Status
The conservation status for each species was obtained from the IUCN Red List (https://www.iucnredlist.org/ accessed on 10 September 2025), except for the Burrunan dolphin (Tursiops australis), which lacks an IUCN assessment, the conservation status was sourced from the Victoria state government [30] (accessed on 15 October 2025). We used only the global conservation assessments for 51 species, except for the Burrunan dolphin, for which a local assessment was utilised. The conservation status for each species followed the IUCN Red List categories: NE, Not Evaluated; DD, Data Deficient; LC, Least Concern; NT, Near Threatened; VU, Vulnerable; EN, Endangered; CR, Critically Endangered; EW, Extinct in the Wild, and EX, Extinct. Species that were Data-deficient or not evaluated were excluded from analyses. The remaining species were grouped into three categories: Least Concern (LC), Vulnerable and Near Threatened (VU + NT), and Endangered and Critically Endangered (EN + CR). These three groups were named as low, medium, and high-risk (for extinction). Note that there was no extinct cetacean species in our dataset.
3. Results
3.1. Mitogenomic Diversity
Nucleotide heterozygosity was estimated using the concatenated supergene containing 12 mitochondrial protein-coding genes for each Cetacean species. Overall, the mitogenomic diversity showed a 78-fold difference among the species (Figure 2). While the highest diversity was observed for one of the Blainville’s beaked whale populations (Mesoplodon densirostris), as 0.0118, the lowest was recorded for one of the Sperm whale populations (Physeter macrocephalus) as 0.00015. After excluding the outlier (Mesoplodon densirostris), this difference was 50-fold. The average nucleotide diversity for the species within families also revealed a twelve-fold difference (Figure 2—inset). Sperm whales (Physeteridae) had the smallest (0.00058) and beaked whales (Ziphiidae) had the largest mean mitogenomic diversity (0.0072).
For most Cetacean species, diversity was largely similar across their populations (Figure 3). For example, these values for the three Beluga whale (Delphinapterus leucas) populations range between 0.0002 and 0.0005, and for the northern bottlenose whale (Hyperoodon ampullatus) populations, they range from 0.0002 to 0.0004. On the contrary, some populations, such as the common bottlenose dolphin (Tursiops truncatus), showed a 19-fold difference in diversity (0.0003–0.0058). Similarly, a 7-fold difference in diversity was observed among Irrawaddy dolphin (Orcaella brevirostris) populations (0.00039–0.00263).
3.2. Deleterious Mutations in Cetacean Populations
Synonymous mutations are neutral or harmless, whereas nonsynonymous mutations may be deleterious. Therefore, the ratio of diversities at nonsynonymous and synonymous sites (dN/dS) measures the proportion of deleterious nonsynonymous mutations segregating in a population. The dN/dS ratios estimated for the Cetacean populations showed a 22.6-fold difference (Figure 4). However, after removing the outlier (0.68—Tursiops truncatus), this difference was 14.3-fold. After the exclusion of the outlier, the dN/dS ratio of Burrunan dolphin (Tursiops australis) had the highest value (0.43), whereas Spinner dolphin (Monodon monoceros) had the lowest ratio (0.03). The mean dN/dS ratio estimated for Cetacean families showed a 4-fold difference. While Sperm whales (Physeteridae) accumulated the highest proportion of deleterious mutations (dN/dS = 0.33), and the Balaenopteridae, known also as Rorquals, had the smallest fraction of these mutations (dN/dS = 0.082) (Figure 4—inset).
Most of the dN/dS ratios were also similar among the populations of the same species (Figure 5). There were a few exceptions. The narwhal (Monodon monoceros) showed a 10-fold difference in the dN/dS ratio across populations (0.029 to 0.299). This ratio varied 8.5 times between the populations of northern bottlenose whale (Hyperoodon ampullatus) (0.037 to 0.32). Similarly, the common bottlenose dolphin (Tursiops truncatus) populations showed a 7.8-fold difference in dN/dS estimates (0.087 to 0.68).
3.3. Relationship Between Mitogenomic Diversity and the Fraction of Deleterious Mutations
To investigate the relationship between mitogenomic diversity and dN/dS ratio, we plotted these estimates against each other. This analysis produced a significant negative relationship between the two variables (Figure 6). A log curve best fitted this relationship. The correlation was highly significant with a Pearson correlation coefficient (r) of −0.41 and p = 0.0007. Since the distribution of this date is not well known, we also examined the Spearman rank correlation. This analysis also produced a highly significant negative relationship (r = −0.43, p = 0.0004). This suggests that populations with low diversity have a high dN/dS ratio, whereas those with high diversity have a low dN/dS ratio. To further investigate this, we also divided the dataset into three groups based on the level of mitogenomic diversity: Low (<0.001), Medium (0.001–0.002), and High (>0.002), and estimated the average dN/dS ratio for the populations belonging to these categories. The results showed that on average, populations with low diversity have a two-fold higher dN/dS ratio than those with high heterozygosity (0.213 vs. 0.108).
3.4. Mutation Load and IUCN Red List Status
Finally, to investigate the relationship between deleterious mutational load and conservation status of species, we obtained the IUCN Red List status for each species. These are ordered from lowest to highest level threat of extinction: LC (Least Concerned), NT (Near threatened), VU (Vulnerable), EN (Endangered), and CR (Critically Endangered). Due to the limited number of data, we combined the populations belonging to CR + EN and VU + NT and named the resulting groups as high-risk and medium-risk (for extinction). We then compared the mean diversity (Figure 7A) and dN/dS ratio (Figure 7B) of these groups with the average estimates obtained for the LC (low-risk) group. Contrary to the expectation, the heterozygosity of the high-risk group (0.0021) was higher than that of the medium-risk group (0.0011), and the heterozygosities of the high-risk and low-risk groups were similar (0.0021 and 0.0025, respectively). In contrast, the average dN/dS ratio of the high-risk group (0.165) was higher than that of the medium-risk group (0.139), which in turn is higher than that of the low-risk group (0.096).
4. Discussion
In this study, we compared the mitochondrial genetic diversity and the proportion of deleterious mutations across all Cetacean populations for which the data were available. We found a 78-fold difference in the nucleotide diversity between cetacean populations. It is well known that diversity, or heterozygosity, is determined by the product of mutation rate (μ) and effective population size (Ne). The mutation rate is expected to be similar across the species within a mammalian order. A recent study on Humpback whales (Megaptera novaeangliae) observed a mutation rate of 1.12 (0.94 − 1.3) × 10^−8^ [31]. This estimate was similar to the rate of 1.11 (0.97 − 1.25) × 10^−8^ estimated for three baleen whales (Fin whale—Balaenoptera physalus, blue whale—Balaenoptera musculus, and bowhead whale—Balaena mysticetus) [31]. Another study also estimated similar mutation rates for killer whales and bottlenose dolphins, which were 0.9 × 10^−8^ and 1.4 × 10^−8^, respectively [32]. Therefore, the observed vast difference in diversity is more likely be attributed to effective population size. Therefore, diversity directly informs us of the effective size of cetacean populations and could therefore be a good indicator for monitoring their conservation status.
Our results showed a 22-fold difference in the dN/dS ratios between cetacean populations. The fraction of deleterious mutations is expected to be higher in small populations than in large populations [33,34]. This is because purifying selection is less efficient in removing deleterious mutations in small populations due to the strong effects of genetic drift. Therefore, the most likely explanation for the large difference in dN/dS ratios is the variation in effective sizes between cetacean populations. Previously observed higher dN/dS ratios of island populations of dingoes [9], foxes [12], Orkney voles [35], and landlocked salmon were attributed to their small population sizes resulting from habitat limitation [15]. Furthermore, higher dN/dS ratios were observed in the declining mammoth population [13]. An earlier study showed a positive correlation between generation time and deleterious mutation load in mitochondrial genomes of mammals [36]. This study used generation time as the proxy for effective population size, and mammals with long generation times have small population sizes. Therefore, this study provided evidence for the negative correlation between effective population size and deleterious mutation load.
We also showed a negative correlation between diversity and dN/dS ratios estimated for the cetacean populations. This relationship suggests that small populations typically have high proportions of deleterious mutations and large populations have low proportions. Therefore, diversity and mutation loads are the two indicators of effective population size. This further confirms our suggestion that the mutation rate is largely similar across cetaceans, and the population size variation predominantly explains the patterns observed in this study. Similar correlations between genomic diversity and dN/dS ratios were reported in dingoes [9], dogs [11], cows [37], and island foxes [12].
The long-term reduction in the population size is predicted to increase the risk of extinction of a population or species [38]. This is because a reduction in the population size leads to the accumulation of deleterious mutations. Furthermore, population size reduction increases inbreeding, which further elevates the deleterious mutation load. This effect is more pronounced in mitochondrial genomes, which do not recombine, leading to mutational meltdown [3,39]. The relationship between genetic diversity and extinction risk has been debated. While some studies provide support for this [38,40], others do not [41,42]. The results of this study did not support the expected association between heterozygosity and extinction risk. Typically, endangered species are expected to have lower heterozygosity than the vulnerable and least concerned categories. However, we found that the mitogenomic diversity of endangered cetaceans was higher than that of vulnerable and near-threatened groups and was similar to that of least concerned cetaceans. In contrast, we found that the fraction of deleterious mutations is higher in endangered (high-risk) and vulnerable (medium-risk) species of Cetacea than in species belonging to the least concerned (low-risk) category. Although we see a clear trend between mutation loads and IUCN Red List status, the differences were not highly significant due to the small sample sizes, particularly for the high-risk species. Hence, further research using a large dataset is needed.
Our study has important implications for conservation management. Out of 31 cetacean species for which the IUCN Red List status was available, 45% (14) were under different levels of extinction risk (CR, EN, VU, or NT). Importantly, 23% (7) were either endangered or critically endangered. Since we showed a large variation in the two predictors of effective population sizes (diversity and the fraction of deleterious mutations), this is useful for assessing the historical demographic status of various cetaceans. This will help identify the cetacean populations and species that are declining. Therefore, this information will help conservation management agencies prioritise strategic practices and allocate resources to the species/populations that need immediate attention.
5. Conclusions
In this study, we investigated the mitochondrial genetic diversity and the fraction of deleterious mutations (dN/dS ratio) in cetacean populations. Our results showed a substantial variation in diversity and dN/dS ratio across 65 populations belonging to 32 cetacean species. The observed correlation between these two measures suggests that small cetacean populations have low diversity and a high fraction of deleterious mutations, whereas large ones have high diversity and a low proportion of harmful mutations. The high dN/dS ratio observed in endangered cetacean species indicates the accumulation of harmful mutations in their mitochondrial genomes. These results are helpful in advising conservation management agencies.
The reference list from the paper itself. Each links out to its DOI / PubMed record.
- 1Cabrera A.A. BérubéM. Lopes X.M. Louis M. Oosting T. Rey-Iglesia A. Rivera-León V.E. Székely D. Lorenzen E.D. Palsbøll P.J. A Genetic Perspective on Cetacean Evolution Annu. Rev. Ecol. Evol. Syst.20215213115110.1146/annurev-ecolsys-012021-105003 · doi ↗
- 2Rocha J.R.C. Clapham P.J. Ivashchenko Y. Emptying the Oceans: A Summary of Industrial Whaling Catches in the 20th Century Mar. Fish. Rev.201476374810.7755/MFR.76.4.3 · doi ↗
- 3Lynch M. Mutation accumulation in nuclear, organelle, and prokaryotic transfer RNA genes Mol. Biol. Evol.19971491492510.1093/oxfordjournals.molbev.a 0258349287424 · doi ↗ · pubmed ↗
- 4Hartl D.L. Andrew G.C. Principles of Population Genetics Sinauer Associates, Inc. Publishers Sunderland, MA, USA 2007
- 5Nigenda-Morales S.F. Lin M. Nuñez-Valencia P.G. Kyriazis C.C. Beichman A.C. Robinson J.A. Ragsdale A.P. Urbán R.J. Archer F.I. Viloria-Gómora L. The genomic footprint of whaling and isolation in fin whale populations Nat. Commun.202314546510.1038/s 41467-023-40052-z 37699896 PMC 10497599 · doi ↗ · pubmed ↗
- 6Dussex N. van der Valk T. Morales H.E. Wheat C.W. Díez-del-Molino D. von Seth J. Foster Y. Kutschera V.E. Guschanski K. Rhie A. Population genomics of the critically endangered kākāpōCell Genom.2021110000210.1016/j.xgen.2021.10000236777713 PMC 9903828 · doi ↗ · pubmed ↗
- 7Grossen C. Guillaume F. Keller L.F. Croll D. Purging of highly deleterious mutations through severe bottlenecks in Alpine ibex Nat. Commun.2020111001101210.1038/s 41467-020-14803-132081890 PMC 7035315 · doi ↗ · pubmed ↗
- 8Johnson K.P. Seger J. Elevated rates of nonsynonymous substitution in island birds Mol. Biol. Evol.20011887488110.1093/oxfordjournals.molbev.a 00386911319271 · doi ↗ · pubmed ↗