Validation of the Brief Assessment of Stress and Eating (BASE) in cisgender gay men and lesbian women
Jason M. Nagata, Christopher D. Otmar, Ken Murakami, Char Potes, Jason M. Lavender, Emilio J. Compte, Tiffany A. Brown, Kelsie T. Forbush, Annesa Flentje, Juno Obedin-Maliver, Mitchell R. Lunn

TL;DR
The BASE tool effectively detects eating disorders in gay men and lesbian women, offering a reliable alternative to existing tools that were mainly tested in heterosexual women.
Contribution
The BASE screening tool was validated for use in cisgender gay men and lesbian women, a population often overlooked in eating disorder research.
Findings
The BASE outperformed the SCOFF questionnaire in detecting eating disorders among gay men.
BASE showed good performance in identifying probable eating disorders in both gay men and lesbian women.
Optimal BASE thresholds varied by group, with higher sensitivity at lower cutoffs.
Abstract
Sexual minority adults are at elevated risk for eating disorders (EDs), yet existing screening tools have rarely been validated in this population. Most ED screening instruments have been validated in predominately cisgender, heterosexual female samples limiting their generalizability to populations with different symptom patterns. Validation studies in cisgender sexual minority (SM) adults are critical to improving detection and addressing disparities in ED identification. The present study evaluated the psychometric performance of the Brief Assessment of Stress and Eating (BASE), a validated 10-item screening tool that assesses DSM-5-aligned eating disorder symptoms and subclinical dysregulated eating behaviors, in a national sample of cisgender gay men and lesbian women. Participants were 1,499 cisgender SM adults (61.7% gay men, 38.3% lesbian women) recruited from The PRIDE Study,…
Genes, proteins, chemicals, diseases, species, mutations and cell lines named across the full text — each resolved to its canonical identifier and authoritative record.
Click any figure to enlarge with its caption.
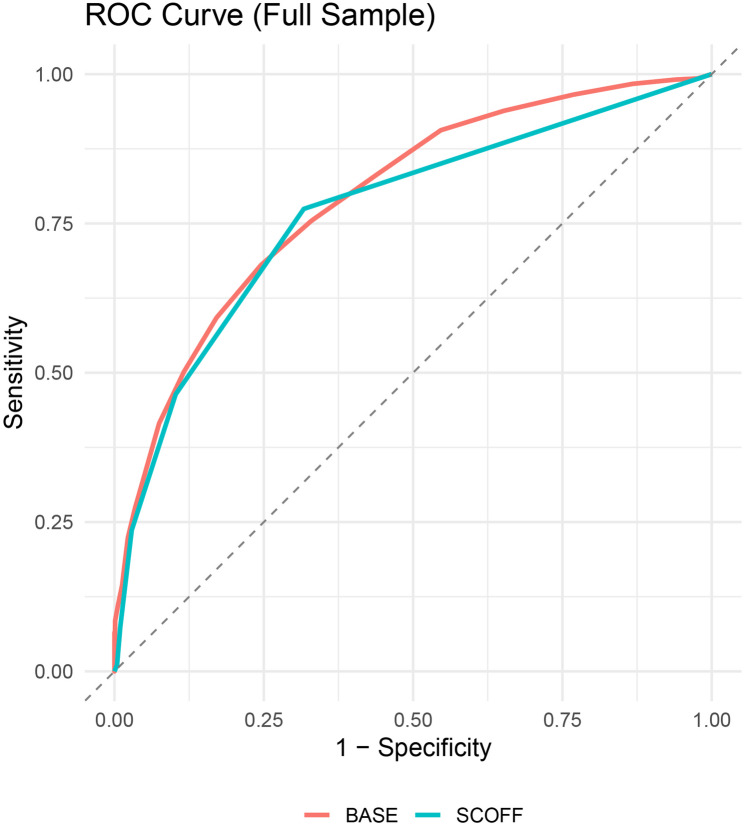 Figure 1
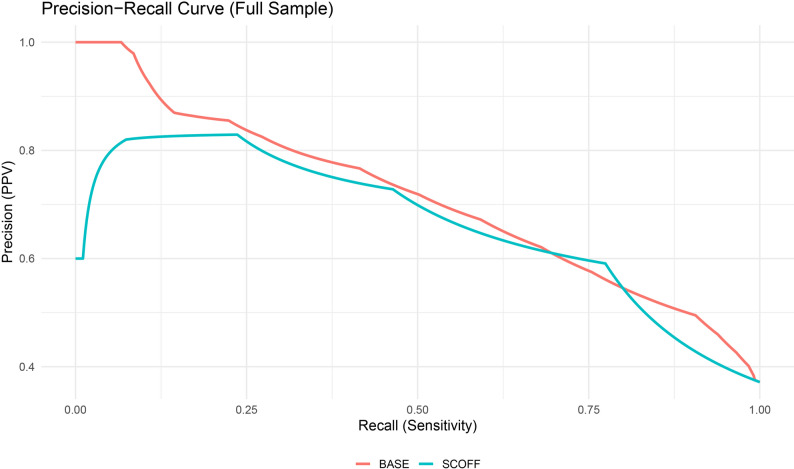 Figure 2
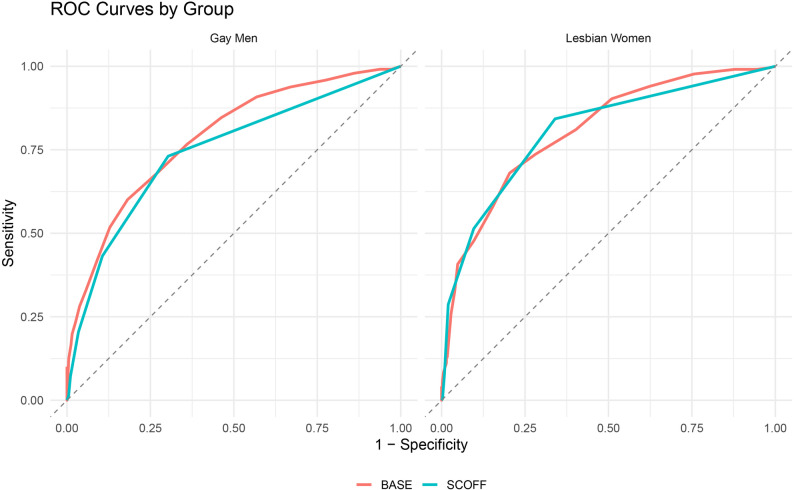 Figure 3
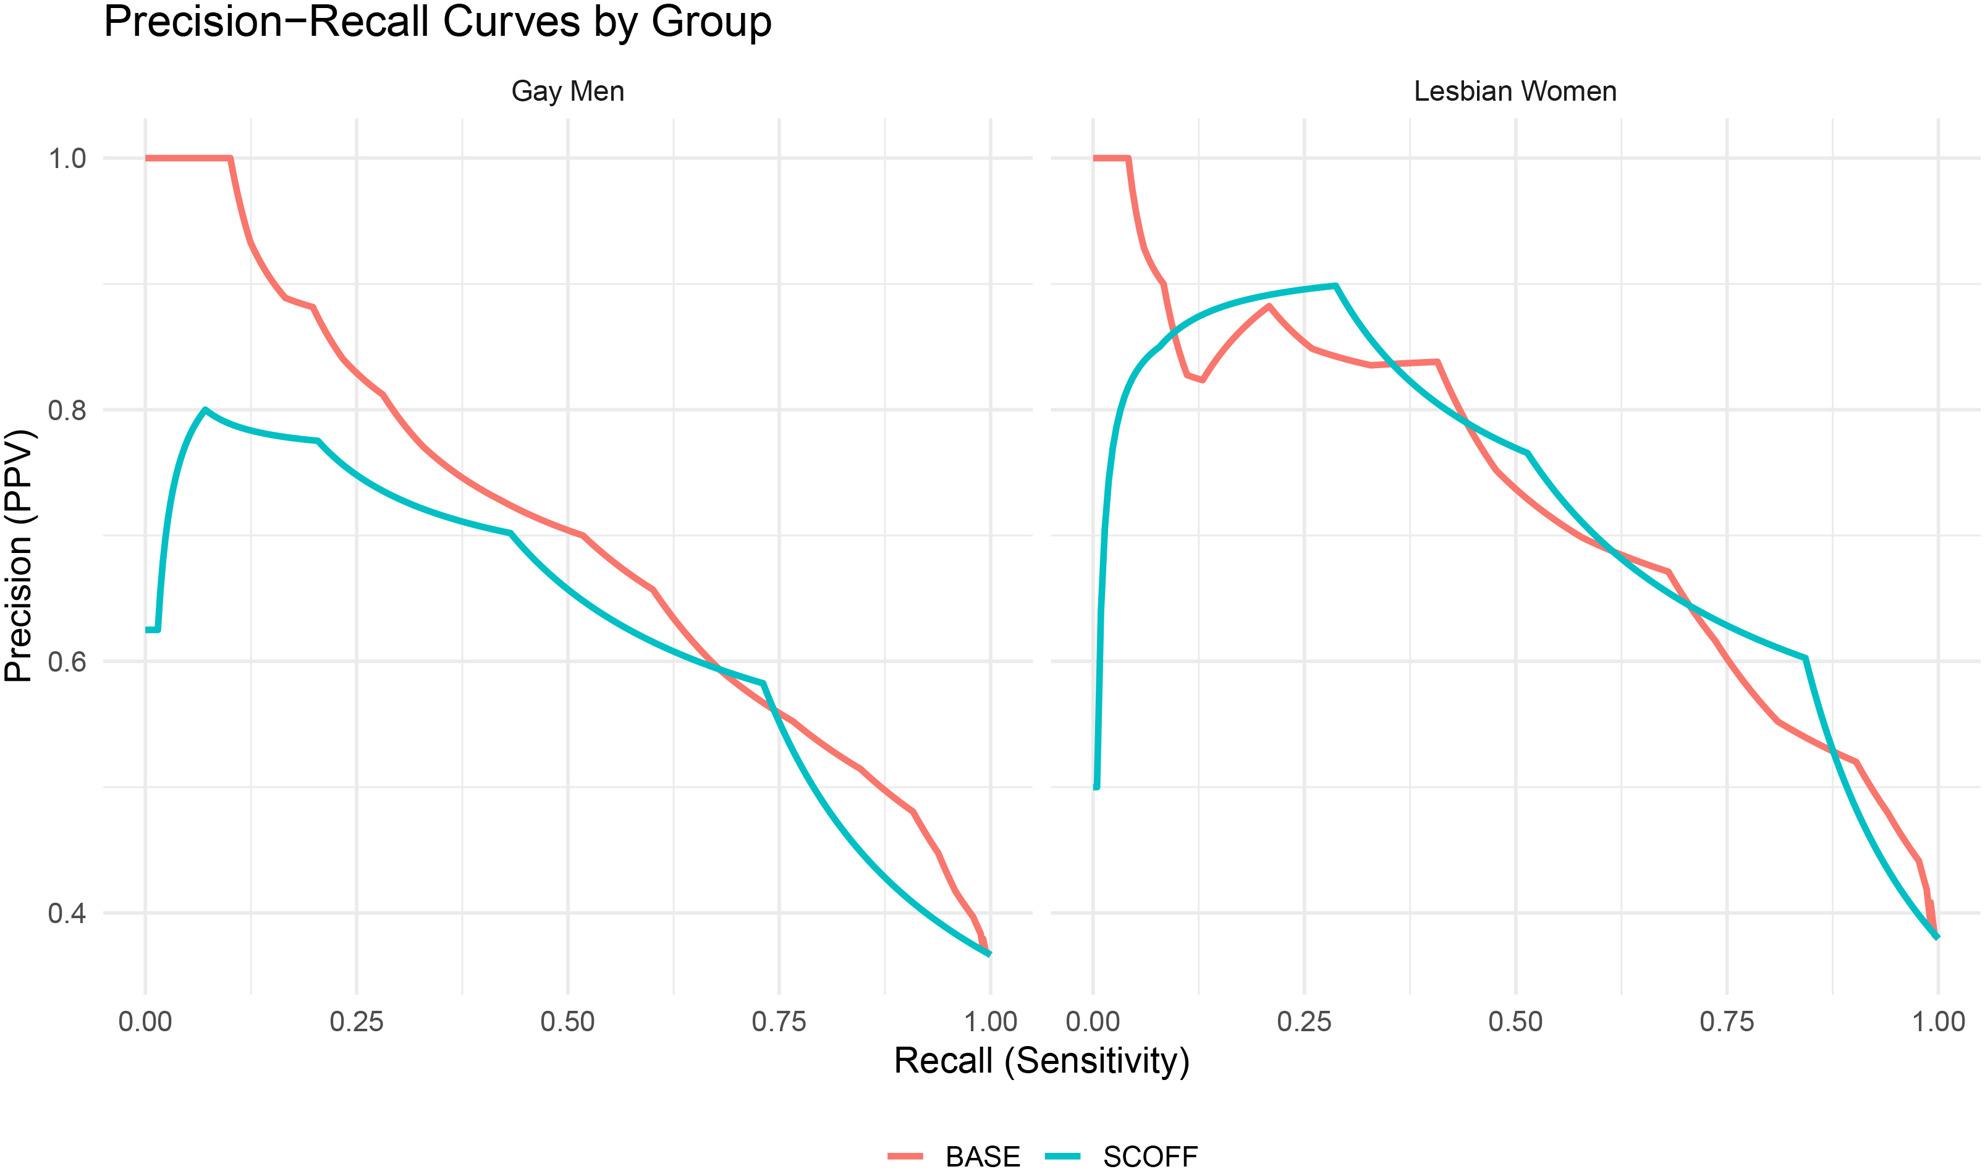 Figure 4
- —https://doi.org/10.13039/501100020884Agencia Nacional de Investigación y Desarrollo
- —https://doi.org/10.13039/100000025National Institute of Mental Health
- —https://doi.org/10.13039/100006093Patient-Centered Outcomes Research Institute
Peer Reviews
No public reviews on file for this paper yet. If you reviewed it on a platform where reviews are public (OpenReview, ICLR, NeurIPS, ICML), you can paste yours below so the community can read it here.
Videos
No videos yet. Explain this paper in a talk, walkthrough, or lecture? Add one.
Taxonomy
TopicsEating Disorders and Behaviors · LGBTQ Health, Identity, and Policy · Sexual function and dysfunction studies
Introduction
Sexual minority (SM) adults remain substantially underrepresented in psychometric studies of eating disorder (ED) screening measures [1], despite consistent evidence that disordered eating behaviors are more prevalent and differently patterned in these populations [2–4]. Compared to cisgender heterosexual adults, cisgender SM adults have two- to four-fold greater odds of meeting DSM-5 criteria for anorexia nervosa, bulimia nervosa, or binge-eating disorder with lifetime prevalence rates of 1.7%, 1.3%, and 2.2%, respectively [5]. Among cisgender gay men, disordered eating symptoms are common with 20% reporting dietary restraint, 11% reporting binge eating, and 10% reporting excessive exercise [6]. Cisgender lesbian women are more likely than gay men to show elevated rates of binge eating and restrictive eating behavior [7]—yet their symptoms are frequently overlooked due to sociocultural misperceptions that EDs primarily affect young, thin, heterosexual females [8]. As a result, existing ED symptom measures may fail to adequately capture the severity and range of eating disorder symptoms and disordered eating behaviors in diverse populations, including SM adults. In this manuscript, we use “eating disorders (EDs)” to refer to DSM-5 diagnoses, “probable ED” to refer to EDDS-5–based classifications, and “disordered eating behaviors” to describe clinically relevant eating-related behaviors that may not meet full diagnostic criteria.
ED screening instruments, in particular, may not account for the ways in which symptoms are shaped by the distinct experiences of cisgender SM adults, such as exposure to stigma-based stress [9, 10] or community-specific appearance expectations [11, 12]. Screeners that emphasize weight phobia and thinness-oriented attitudes may underrepresent ED symptoms in cisgender gay men driven by muscularity-oriented concerns and behaviors [13], or cisgender lesbian women, whose eating pathology frequently involves more binge eating rather than restrictive dieting [14]. As such, efforts to implement screening measures must address structural and interpersonal barriers to diagnosis that disproportionately affect SM adults. Lower trust in providers [21, 22] and higher rates of care avoidance are well-documented across SM populations [23], particularly for concerns related to eating and body image. Thus, self-report questionnaires that require minimal time and do not rely on face-to-face disclosure provide a pragmatic strategy for reaching individuals who may be less likely to disclose symptoms in traditional clinical contexts.
Moreover, lengthy or culturally mismatched measures are associated with lower completion rates [24], and this may be especially true among SM individuals navigating intersecting stigmas related to mental health and sexual identity [25]. Although longer forms are not inherently burdensome [26, 27], their acceptability depends on whether respondents perceive them as relevant and worth the effort [28, 29]. These considerations are particularly relevant to ED screening in community and primary-care contexts, where longer instruments may be less feasible due, in part, to the time constraints of patient-provider interactions [15, 16]. Most primary care visits in the United States last between 13 and 21 min, which leaves little room for preventive mental-health screening or discussion [17]. The limitations of provider training further complicate these challenges. Many clinicians report limited exposure to ED assessment during professional training, lack confidence in identifying atypical or subclinical cases, and express general discomfort initiating conversations about eating and weight concerns, especially when facing uncertainty about what to ask or how to respond [30]. Brief, standardized tools can support clinical judgment by offering accessible entry points for identification and may promote more equitable detection of ED risk across diverse patient populations. These brief, validated measures may also aid in reducing participant burden in ED research studies that involve completion of a variety of additional questionnaires assessing other constructs.
Brief screening tools such as the Sick-Control-One-Fat-Food (SCOFF) [18] and Eating Disorder Examination Questionnaire (EDE-Q7) [19] are available, but like most ED measures, they were developed to reflect the symptom presentations of affluent, cisgender, heterosexual, white females with minimal consideration of how EDs manifest across diverse identities [1]. The Brief Assessment of Stress and Eating (BASE) [31], a more recently developed screening questionnaire, offers a more comprehensive and potentially more inclusive alternative. The 10-item measure assesses multiple symptoms of eating disorders and disordered eating behaviors, including dietary restriction, binge eating, use of muscle-building supplements, excessive exercise, and other compensatory behaviors. Additionally, rather than focusing on weight- or shape-based concerns, the items largely address behavioral indicators of severity, which may make the measure more applicable across individuals with diverse identities and body ideals. The BASE was designed to screen for broadly defined eating pathology [31], including both DSM-aligned symptoms and subclinical behaviors that may not meet full diagnostic criteria, making it suitable for use in community and epidemiological research where early identification is prioritized. Overall, the BASE is brief, simple to administer and score, and preserves symptom breadth while reducing respondent burden.
Current study
Although the BASE has demonstrated good psychometric performance in college samples [31], its utility in cisgender SM adults remains untested. However, because the BASE was derived from the Eating Pathology Symptoms Inventory (EPSI) [32], which has demonstrated robust internal consistency and measurement invariance across cisgender gay men and lesbian women [33], there is strong rationale to expect adequate performance in this group. Brief, low-burden screening measures (like the BASE) could help address existing disparities by improving detection and enhancing opportunities for prevention or early intervention, particularly in settings where time constraints or limited resources may otherwise preclude comprehensive assessment [34]. These considerations position the BASE as a potentially valuable tool that is feasible and easily administered in a variety of clinical and research settings.
The purpose of the current study was to validate the BASE as a brief screener of eating disorder symptoms and disordered eating behaviors, with a specific focus on its ability to identify EDDS-5–derived probable EDs, in a large community-based sample of cisgender SM adults. Given that the BASE derived items from the Eating Pathology Symptoms Inventory—which has shown evidence for strong psychometric properties in SM adults [33, 35], we hypothesized that the BASE would show good internal consistency and diagnostic accuracy with similar or better performance than the widely used SCOFF questionnaire [18]. This work supports broader efforts to validate psychometrically sound, culturally appropriate instruments for sexual and gender minority populations [33, 36]. Establishing the BASE’s psychometric properties and clinical cut-offs in SM adults is a key step toward improving ED detection and promoting equity.
Methods
Participants and procedures
This research was approved by institutional review boards at Stanford University School of Medicine (Protocol #63400), the University of California, San Francisco, and the WIRB-Copernicus Group. Oversight was additionally provided by the Research and Participant Advisory Committees of The Population Research in Identity and Disparities for Equality (PRIDE) Study. The PRIDE Study is a national, longitudinal cohort study centered on understanding the health of sexual and gender minority (SGM) adults residing in the United States and its territories [37, 38]. Participants were eligible for inclusion if they were 18 years of age or older, currently living in the U.S. or its territories, and able to comprehend an English-language survey. Data from the present study came from supplemental data collection focused on eating and body image concerns that was administered between July 2023 and January 2024. Participant outreach involved a range of community-driven and digital methods, including PRIDEnet engagement efforts, announcements in email newsletters and blog posts, visibility at in-person events, targeted social media posts, and informal word-of-mouth referrals. Surveys could be completed from any internet-connected device. To encourage participation, respondents were automatically entered into a drawing for one of fifty $40 gift card.
Survey access was restricted through a secure digital infrastructure. Each individual enrolled in The PRIDE Study was assigned a unique dashboard within the study’s secure portal, from which personalized survey links could be accessed. Once a survey was submitted, it was no longer available to the participant. Each completed response was automatically associated with a unique participant ID generated and tracked by the Qualtrics survey platform.
The current analysis focused on cisgender participants who self-identified as either cisgender gay men or lesbian women. Of the 4,729 individuals who completed the ancillary survey, 1,499 (31.6%) met these inclusion criteria: 925 identified as cisgender gay men (61.7%) and 573 as cisgender lesbian women (38.3%). Eligibility was based on two items: participants selected “gay/lesbian” from a single-choice sexual orientation item and either “cisgender man” or “cisgender woman” from a single-choice gender identity item. The average age of included participants was 50.78 years (SD = 15.2) with responses spanning from 18 to 96 years. The sample was predominantly White (n = 1,251, 84.8%), with smaller proportions identifying as Hispanic or Latino (3.6%), Black or African American (2.6%), Asian (2.3%), American Indian or Alaska Native (2.1%), Middle Eastern or North African (0.5%), or Native Hawaiian or Pacific Islander (0.1%). A small proportion of participants (0.5%) reported an ethno-racial identity outside the listed categories or declined to disclose this information. Multiracial identities were reported by 9.3% of the sample, with similar rates across gay men and lesbian women. Most participants had completed a college degree or higher (79.7%), while 20.3% had not. Complete demographic and diagnostic characteristics of the sample are presented in Table 1.
Table 1. Demographic and diagnostic characteristics of cisgender sexual minority sampleCisgender Gay MenCisgender Lesbian WomenMean (SD)Mean (SD)Age, years52.8 (15.2)48.2 (17.1)BMI, kg/m^2^28.8 (6.42)30.9 (8.66)Ethnoracial identityn (%)n (%) American Indian/Alaska Native1 (0.86%)13 (2.90%) Asian5 (4.31%)23 (5.13%) Black/African American10 (8.62%)21 (4.69%) Hispanic/Latino7 (6.03%)27 (6.03%) Middle Eastern/North African1 (0.86%)3 (0.67%) Native Hawaiian/Pacific Islander1 (0.86%)0 (0.00%) White102 (87.93%)416 (92.86%) Other/Unknown2 (1.72%)2 (0.45%)BMI Category, kg/m^2^n (%)n (%) < 18.5013 (1.4%)9 (1.6%) 18.50–24.99255 (27.7%)164 (28.8%) 25.00–29.99316 (34.4%)132 (23.2%) ≥ 30.00335 (36.5%)265 (46.5%)Educationn (%)n (%) No schooling0 (0.0%)0 (0.0%) Nursery to high school, no diploma1 (0.9%)0 (0.0%) High school graduate or equivalent3 (2.6%)16 (3.6%) Trade/Technical/Vocational training2 (1.7%)9 (2.0%) Some college16 (13.8%)54 (12.1%) 2-year college degree4 (3.4%)28 (6.2%) 4-year college degree36 (31.0%)152 (33.9%) Master’s degree32 (27.6%)121 (27.0%) Doctoral degree11 (9.5%)40 (8.9%) Professional degree11 (9.5%)28 (6.2%)Incomen (%)n (%) 30,00026 (23.2%)156 (34.8%) 60,00031 (27.7%)137 (30.6%) 100,00025 (22.3%)97 (21.6%) 150,00014 (12.5%)37 (8.3%) $150,001+18 (16.1%)24 (5.3%)Eating Disorder Diagnosisn (%)n (%) Any eating disorder338 (36.5%)216 (37.7%) Anorexia nervosa3 (0.3%)5 (0.9%) Bulimia nervosa90 (9.7%)55 (9.6%) Binge-eating disorder10 (1.1%)20 (3.5%) OSFED: subthreshold anorexia nervosa24 (2.6%)13 (2.3%) OSFED: subthreshold bulimia nervosa19 (2.1%)12 (2.1%) OSFED: subthreshold binge-eating disorder22 (2.4%)42 (7.3%) OSFED: purging disorder7 (0.8%)3 (0.5%) OSFED: subthreshold purging disorder35 (3.8%)14 (2.4%) OSFED: compensatory eating disorder148 (16%)80 (14%) OSFED: subthreshold compensatory eating disorder248 (26.8%)161 (28.1%)BMI body mass index,* OSFED* other specified feeding or eating disorder
Measures
Brief Assessment of Stress and Eating (BASE)
The BASE [31] is a 17-item screening questionnaire developed using items from the Eating Pathology Symptoms Inventory (EPSI) [32] and the Inventory for Depression and Anxiety Symptoms–II (IDAS-II) [39]. The BASE is designed to assess core features of EDs, PTSD, depression, and generalized anxiety disorder over the past four weeks. For the current study, only the 10-item ED screen was used. Each item was rated on a 5-point scale ranging from 0 (never) to 4 (very often), with higher values indicating more frequent or severe eating disorder symptoms and disordered eating behaviors.
Eating Disorder Diagnostic Scale-5
The EDDS-5 [40] is a self-report instrument developed to assess probable DSM-5 ED diagnoses. The original version of the EDDS demonstrated evidence for strong psychometric properties, including high internal consistency, excellent 1-week test-retest reliability for the symptom composite, and good-to-excellent diagnostic agreement with structured clinical interviews. The present study derived probable ED diagnoses using a structured, rule-based algorithm adapted from Stice et al. (2000); [40] to align with DSM-5 diagnostic constructs and permit classification of both full and subthreshold ED presentations. The algorithm generated a set of binary diagnostic flags for each probable ED category: anorexia nervosa (full and subthreshold), bulimia nervosa (full and subthreshold), binge-eating disorder (full and subthreshold), purging disorder (full and subthreshold), and compensatory eating disorder. Consistent with earlier BASE validation research (e.g., [31]), we generated a binary composite outcome reflecting whether participants met criteria for a full or subthreshold eating disorder. This composite variable defined probable ED status and served as the criterion outcome in all prediction models. Importantly, subthreshold presentations may fall under other specified feeding and eating disorders (OSFED), which are recognized as clinically significant eating disorders.
SCOFF questionnaire
The SCOFF questionnaire [18], a five-item screener with binary (yes/no) responses, was administered as comparison screening instrument given its wide application in primary care settings. Following standard scoring procedures, responses to the five items were summed to yield a total score ranging from 0 to 5. The total score was used as a continuous predictor of probable ED status in logistic regression models and was also evaluated as a binary classifier using cutoffs derived from ROC and PR curves to determine optimal thresholds for classification.
Body mass index
Body mass index (BMI) was calculated using the standard formula: [weight (lbs) / height (in)^2^] × 703, with height reported in feet and inches and converted to inches for calculation. For descriptive analyses, BMI was categorized according to World Health Organization and Centers for Disease Control and Prevention guidelines: underweight (< 18.5 kg/m^2^), normal weight (18.5–24.99 kg/m^2^), overweight (25–29.99 kg/m^2^), and obesity (≥ 30 kg/m^2^) [41, 42]. Separately, a diagnostic low-weight indicator was derived using a three-level classification: <18.5 kg/m^2^ = low weight; 18.5–18.99 kg/m^2^ = subthreshold low weight; and ≥ 19 kg/m^2^ = above low weight threshold. This variable was used within the EDDS-5 scoring algorithm to inform diagnosis.
Statistical analysis
All analyses were conducted in R (version 4.5.1) [43]. Internal consistency of the BASE was assessed using ordinal alpha, derived from polychoric correlations to account for the ordered categorical format, in the full sample and within SM subgroups. A binary criterion variable for probable ED was created based on available diagnostic data assessed using the EDDS-5 and served as the outcome for all prediction models. For the BASE and SCOFF, total sum scores were utilized, with higher scores indicating greater severity.
Predictive validity was evaluated using binary logistic regression models with BASE total scores as the predictor of probable ED status. Models were fit in the full sample and separately within each subgroup to obtain stratified estimates. Model performance was assessed using receiver operating characteristic (ROC) curve analysis [44]. The area under the ROC curve (AUC ROC) quantified the screener’s ability to distinguish between probable ED cases and non-cases [45, 46]. In addition, precision–recall (PR) curves were generated, and the area under the PR curve (AUC PR) [47] was used as a complementary metric of classifier performance [48], particularly given the presence of class imbalance.
Optimal cut-points were identified using two approaches. First, Youden’s J index was applied to ROC curves based on total scores to determine the score that maximized the joint sensitivity and specificity [49]. Positive and negative predictive values were calculated at this threshold. Second, predicted probabilities from logistic models were used to construct PR curves, from which we extracted the threshold that maximized the F1 score (i.e., the harmonic mean of precision and recall). This approach provided a performance-optimized threshold for practical classification use. To benchmark performance, we conducted parallel analyses using the SCOFF screener. Logistic regression models, ROC and PR curves, and threshold optimization procedures were repeated using SCOFF total scores. DeLong’s test for correlated ROC curves [50] was used to compare the AUCs of the BASE and SCOFF in the full sample and within subgroups.
Results
In the analytic subsample of cisgender gay men and lesbian women (N = 1499; 926 gay men, 573 lesbian women), 36.7% of gay men and 38.0% of lesbian women screened positive for a probable ED on the EDDS-5. Ordinal alpha indicated strong internal consistency in the full sample (α = 0.818), among gay men (α = 0.829), and among lesbian women (α = 0.800); all exceeded the conventional 0.80 threshold for acceptable reliability (see Tables 2 and 3 for BASE descriptive statistics). BASE scores significantly predicted probable ED status across all models. In the full sample, each one-point increase in BASE was associated with 32% higher odds of screening positive for any probable ED (OR = 1.32, 95% CI [1.28, 1.37], p < .001). Among lesbian women, the odds were 36% higher (OR = 1.36, 95% CI [1.29, 1.45], p < .001); among gay men, the odds were 30% higher (OR = 1.30, 95% CI [1.25, 1.36], p < .001).
Table 2. Means, Medians, and standard deviations of measures by sexual orientationCisgender gay menCisgender lesbian womenFull sampleMeasureMean (SD)MedianMean (SD)MedianMean (SD)MedianSCOFF0.83 (1.12)00.95 (1.13)10.87 (1.12)0BASE-10-item8.27 (4.98)87.83 (4.50)78.10 (4.80)7
Table 3. Descriptive statistics for BASE items by groupBASE ItemCisgender gay menCisgender lesbian womenFull sampleM (SD)Med.M (SD)Med.M (SD)Med.Does not eat very much0.61 (0.98)00.70 (0.99)00.65 (0.98)0Exercise nearly every day1.74 (1.46)21.42 (1.42)11.62 (1.45)2Muscle building supplements0.39 (0.92)00.15 (0.58)00.30 (0.81)0Body dissatisfaction2.54 (1.19)32.55 (1.19)22.55 (1.19)3Binge eating behavior1.14 (1.04)11.23 (1.05)11.18 (1.05)1Vomit to lose weight0.07 (0.42)00.08 (0.42)00.08 (0.42)0Strenuous exercise (5 + days per week)0.82 (1.25)00.62 (1.08)00.74 (1.19)0Eating until feeling sick0.51 (0.81)00.65 (0.91)00.56 (0.85)0Laxatives or diuretics to lose weight0.15 (0.60)00.14 (0.54)00.15 (0.58)0Substances to reduce hunger0.28 (0.85)00.29 (0.80)00.28 (0.83)0Item summaries have been abbreviated for brevity and to comply with copyright guidance. Full BASE item wording is available at https://care.ku.edu/base
Classification thresholds were derived using Youden’s J statistic. In the full sample, the optimal threshold was 8.5 (sensitivity = 0.68, specificity = 0.76, PPV = 0.62, NPV = 0.80; see Table 4). Subgroup thresholds were 9.5 for gay men and 8.5 for lesbian women with similar diagnostic trade-offs (see Table 5). PR curve optimization selected lower thresholds: 7 in the full sample and gay men, 8 in lesbian women, resulting in increased sensitivity (range = 0.74–0.85) and NPV (0.85–0.86) but decreased specificity (0.54–0.72) and PPV (0.51–0.62), consistent with a shift toward greater case detection at the expense of precision. In the full sample, the BASE showed good overall classification (AUC = 0.79, 95% CI [0.77, 0.82]; AUCPR = 0.71) with comparable results in gay men (AUC = 0.79, AUCPR = 0.70) and slightly stronger performance in lesbian women (AUC = 0.81, AUCPR = 0.73). Although specificity at the Youden-optimal thresholds met conventional benchmarks, sensitivity fell below the ≥ 0.80 threshold favored in clinical contexts, suggesting that lower thresholds may be preferable when minimizing false negatives is a priority [44, 49].
Table 4. Predictive accuracy statistics in full sampleCutoff-PRCAUC-PRCSensitivitySpecificityPPVNPVSCOFF-optimal1.50.6660.7740.6830.5910.837BASE-10-optimal70.7110.8320.5600.5280.850BASE-10-9-cutoff90.7110.6810.7550.6210.800Cutoff-ROCAUC-ROCSensitivitySpecificityPPVNPVSCOFF-optimal1.50.7680.7740.6830.5910.837BASE-10-optimal8.50.7930.6810.7550.6210.800BASE-10-9-cutoff90.7930.6810.7550.6210.800We used a BASE-10 cutoff of 9 across both ROC and PRC analyses to maintain consistency with the c threshold established by Forbush et al. [31], where scores ≥ 9 were used to classify probable ED cases in full-sample ROC analyses. Although a lower PRC-optimal threshold (e.g., 7) yielded higher sensitivity in that study, we applied the 9-point cutoff uniformly to enable direct comparisons across screeners and performance metrics.* AUC* area under the curve, * ROC* receiver operating characteristics,* PRC * precision-recall curve,* PPV* positive predictive value,* NPV * negative predictive value,* ED* eating disorder
Table 5. Predictive accuracy statistics by sexual orientationCisgender lesbian womenCutoff-PRCAUC-PRCSensitivitySpecificityPPVNPVSCOFF-optimal1.50.7220.8430.6600.6030.873BASE-10-optimal80.7270.7360.7200.6160.817BASE-10-9-cutoff90.7270.6810.7960.6710.803Cutoff-ROCAUC-ROCSensitivitySpecificityPPVNPVSCOFF-optimal1.50.8060.8430.6600.6030.873BASE-10-optimal8.50.8070.6810.7960.6710.803BASE-10-9-cutoff90.8070.6810.7960.6710.803Cisgender gay menCutoff-PRCAUC-PRCSensitivitySpecificityPPVNPVSCOFF-optimal30.6300.7310.6970.5830.817BASE-10-optimal70.7020.8460.5380.5140.858BASE-10-9-cutoff90.7020.6800.7290.5930.798Cutoff-ROCAUC-ROCSensitivitySpecificityPPVNPVSCOFF-optimal1.50.7440.7310.6970.5830.817BASE-10-optimal9.50.7850.6010.8180.6570.780BASE-10-9-cutoff90.7850.6800.7290.5930.798We used a BASE-10 cutoff of 9 across both ROC and PRC analyses to maintain consistency with the c threshold established by Forbush et al. [31], where scores ≥ 9 were used to classify probable ED cases in full-sample ROC analyses.* AUC* area under the curve, * ROC* receiver operating characteristics,* PRC * precision-recall curve,* PPV* positive predictive value,* NPV * negative predictive value,* ED* eating disorder
The SCOFF yielded slightly lower accuracy in the full sample (AUC = 0.77, 95% CI [0.74, 0.79]), although the difference from BASE was not statistically significant (Z = 1.83, p = .067). Among lesbian women, both screeners performed equivalently (AUC = 0.81; Z = 0.05, p = .964). In gay men, however, the BASE outperformed the SCOFF (AUC = 0.79 vs. 0.74; Z = 2.27, p = .023). F1-score optimization, which balances precision and recall, yielded peak F1 = 0.65 for BASE (recall = 0.76, precision = 0.58) and F1 = 0.67 for SCOFF (recall = 0.77, precision = 0.59) in the full sample. Among lesbian women, F1 scores were nearly identical (0.70 for SCOFF, 0.68 for BASE); in gay men, the SCOFF again held a marginal advantage (0.65 vs. 0.64), driven by higher recall despite lower precision and specificity. All ROC and PR curves are presented in Figs. 1, 2, 3 and 4, including full-sample plots (Figs. 1 and 2) and subgroup-stratified plots for cisgender sexual minority adults (Figs. 3 and 4).
Fig. 1. Receiver operating characteristic curves for each screener in the full sample of cisgender sexual minority (SM) adults
Fig. 2. Precision–recall curves for each screener in the full sample of cisgender sexual minority (SM) adults
Fig. 3. Receiver operating characteristic curves for each screener stratified by cisgender SM subgroup (Lesbian Women, Gay Men)
Fig. 4. Precision–recall curves for each screener stratified by cisgender SM subgroup (Lesbian Women, Gay Men)
Discussion
The present study extends ED screening research by investigating the BASE in a demographically distinct, nationally recruited sample of cisgender SM adults. We sought to determine if the BASE would (1) demonstrate adequate internal consistency reliability; (2) match or exceed the classification accuracy of the SCOFF for probable ED overall; and (3) show utility across SM subgroups. As hypothesized, the BASE exhibited good internal consistency in gay men and lesbian women and separated probable ED cases from non-cases with good overall classification accuracy. In gay men, the BASE outperformed the SCOFF (AUC = 0.79 vs.74); whereas in lesbian women, both screeners performed equivalently. Although the BASE’s classification accuracy was statistically comparable to the SCOFF in the total SM sample and among the cisgender lesbian women subgroup, the BASE achieved superior classification accuracy in the cisgender gay men subgroup. These findings directly address the evidentiary gaps identified by the U.S. Preventive Services Task Force by offering psychometric support for brief, self-administered screening tools in a large cohort of SM adults [20]. In contexts where provider or respondent time is limited and disclosure might be shaped by stigma or uncertainty, the BASE offers a low-burden pathway for identifying individuals with a probable ED in populations historically underserved by traditional screening practices.
The BASE’s sensitivity and specificity in this study were found to fall within, and in some subgroups exceed, the performance range reported for brief ED screeners validated in predominantly cisgender female samples. For instance, the EDE-Q7 has demonstrated AUC values as high as 0.94 in at-risk university samples and sensitivity/specificity above 0.80 in general population studies. In our sample, the BASE achieved comparable discrimination (AUC = 0.79–0.81) for probable ED status and matched the SCOFF in cisgender lesbian women, which mirrored performance estimates from female-majority samples [51, 52]. In cisgender gay men, however, the BASE’s advantage over the SCOFF aligns with literature documenting limited assessment of muscularity-oriented restriction, fasting, and compensatory exercise by traditionally weight loss- and thinness-focused instruments. The inclusion of items that assess compulsive exercise, use of muscle-building supplements, and substance-based appetite control captures symptom patterns that are often underrepresented in traditional ED screeners. These features enhance the cultural responsiveness of the BASE by reflecting behaviors more salient within certain SM subgroups [2], particularly those emphasizing muscularity or performance-oriented body ideals [9]. Items in the BASE that reference compulsive exercise (feeling the need to exercise nearly every day), use of muscle-building supplements, and substance-facilitated appetite control (using medications or substances to reduce hunger or induce weight loss) may explain this differential fit [6, 53].
The BASE achieved AUCPR values around 0.71 which is markedly higher than the 0.62 threshold at which decision-curve analyses begin to yield positive net benefit for probable ED case detection in rare-event contexts. Although sensitivity at the Youden-derived cut-point of 8.5 settled below the ≥ 0.80 threshold favored by most guidelines [54], lowering the threshold to seven boosted recalls to 0.76 while maintaining acceptable negative predictive value. In primary care settings, where minimizing false negatives is critical, a lower threshold (e.g., ≥ 7) may be preferable to maximize detection of individuals with a probable ED. Conversely, epidemiological or large-scale research may prioritize specificity and adopt a higher threshold (e.g., ≥ 9) to reduce false positives. For screening purposes, erring on the side of false positives may be justified when weighed against the costs of prolonged duration of untreated illness, which averages two to three years and predicts poorer clinical outcomes. We therefore recommend referring individuals scoring ≥ 7 for further evaluation for an ED when resources allow, while adopting the more conservative ≥ 9 threshold in settings where confirmatory assessment capacity is limited or infeasible. This recommendation balances flexibility with caution and aligns with the recommended cut-point of ≥ 8 from Forbush et al. [31].
As recommended in efforts to enhance LGBTQIA + cultural sensitivity in health care settings [55], adapting intake and communication processes (including the integration of brief, inclusive tools into electronic health record platforms) can reduce interpersonal risk and support disclosure among patients who may otherwise avoid in-person conversations [56–58]. Given its brevity and broad symptom coverage, the BASE may be well-positioned for use in telehealth or patient portal contexts and in community-based outreach platforms that aim to engage populations historically underserved by traditional clinical care [55]. For researchers, The BASE demonstrates promising psychometric performance in this cross-sectional sample and may offer a feasible tool for initial ED screening for probable EDs in large SM cohort studies.
Several constraints temper the scope of our conclusions. The sample, on average, was older (M = 50.78 years), highly educated, and predominantly White. This demographic profile may limit the extent to which the findings can be generalized to younger and more racially or socioeconomically diverse sexual minority adults whose experiences of risk, stress, and care access may differ in meaningful ways [59, 60]. Younger SM adults, in particular, engage within social environments characterized by heightened appearance-related comparison and digital visibility [61, 62], often coupled with more precarious access to affirming care. It remains an open question whether the BASE performs comparably across age groups. Most prior research on disordered eating among sexual minority populations has centered on adolescents and young adults, whereas the current sample was middle-aged on average. Developmental differences in body image concerns, social comparison processes, and patterns of health care utilization suggest that both item functioning and optimal cut-points could shift across the lifespan. Future studies would benefit from explicitly testing these possibilities, particularly in more racially and economically diverse samples, where the intersecting effects of minority stress, resource constraints, and care barriers are most apparent [63].
Self-selection into The PRIDE Study and this ancillary body image and eating survey may have inflated prevalence estimates; individuals with active concerns could be more inclined to participate despite broad recruitment messaging. Third, probable diagnoses were derived from the self-report EDDS-5 questionnaire rather than structured/semi-structured interviews. Next, the BASE’s performance was evaluated only in cisgender gay men and lesbian women; bisexual, pansexual, and asexual adults often face distinct stigma profiles and body-image pressures that could influence symptom expression [64, 65]. Finally, while PR analyses help mitigate class-imbalance bias, external validation in clinical settings with lower ED prevalence is necessary to establish real-world positive predictive value.
The proportion of participants who screened positive for a probable eating disorder (36.7% of gay men, 38.0% of lesbian women) appears high relative to general population estimates [66–68]. However, this pattern is broadly consistent with prior epidemiologic evidence showing elevated and persistent risk for disordered eating among sexual minority adults, even when sociodemographic factors are taken into account [2–5]. These findings may reflect both genuine differences in underlying vulnerability and the BASE’s capacity to identify subthreshold or behaviorally oriented symptoms not captured by more traditional, weight-focused instruments. From this perspective, the higher prevalence observed may indicate more complete detection rather than inflation, aligning with theoretical accounts that link minority stress processes and chronic stigma exposure to maladaptive regulatory behaviors [69], including disordered eating [10].
Despite these limitations, the current findings represent an incremental but meaningful step forward. The use of The PRIDE Study’s national, community-engaged infrastructure enabled recruitment of a large sample of sexual minority adults without relying on clinic-based pathways, broadening the evidentiary base for ED screening research. Analytically, combining ROC and PR metrics offered a more complete view of accuracy under different prevalence conditions and situated the BASE’s performance relative to a widely used comparator, the SCOFF. Moving forward, the next phase should evaluate the BASE in clinical settings to test its sensitivity across symptom severity, assess test–retest reliability, and determine whether scores predict treatment engagement and recovery outcomes over time. Embedding the tool within primary care workflows would allow examination of feasibility and cost-effectiveness, and randomized implementation trials could clarify whether BASE-guided referrals help reduce the duration of untreated eating disorders.
Conclusion
The BASE offers a concise, reliable, and diagnostically informative option for identifying probable EDs in cisgender gay men and lesbian women, while also capturing clinically relevant disordered eating behaviors that may not meet full diagnostic criteria. Its superior performance over the SCOFF in cisgender gay men and comparable accuracy in cisgender lesbian women suggest that this brief tool can be an inclusive and useful application in a variety of clinical and research settings when the primary goal is to screen for EDDS-5-derived probable EDs and identify individuals who may benefit from further clinical evaluation.
The reference list from the paper itself. Each links out to its DOI / PubMed record.
- 1Dugdale DC, Epstein R, Pantilat SZ. Time and the patient-physician relationship. J Gen Intern Med. 1999;14(Suppl 1). 10.1046/j.1525-1497.1999.00263.x. :S 34-40.10.1046/j.1525-1497.1999.00263.x PMC 14968699933493 · doi ↗ · pubmed ↗
- 2Obedin-Maliver J, Hunt C, Flentje A, Armea-Warren C, Bahati M, Lubensky ME et al. Engaging sexual and gender minority (SGM) communities for health research: Building and sustaining PRID Enet. J Community Engagem Scholarsh [Internet]. 2024 [cited 2024 Jul 25];16. 10.54656/jces.v 16i 2.48410.54656/jces.v 16i 2.484PMC 1132644439149568 · doi ↗ · pubmed ↗
- 3Centers for Disease Control. Adult BMI categories [Internet]. BMI. 2024 [cited 2025 Jul 10]. https://www.cdc.gov/bmi/adult-calculator/bmi-categories.html. Accessed 10 Jul 2025.
- 4World Health Organization. A healthy lifestyle - WHO recommendations [Internet]. 2010 [cited 2025 Jul 11]. https://www.who.int/europe/news-room/fact-sheets/item/a-healthy-lifestyle---who-recommendations. Accessed 11 Jul 2025.
- 5R Core Team. R: a language and environment for statistical computing (Version 4.5.1) [Internet]. R Foundation for Statistical Computing. 2025. https://www.R-project.org/