Association of Obesity Severity With Cardiometabolic and Renal Disease Burden in the United States
Florina Corpodean, Michael Kachmar, Shengping Yang, Steven B. Heymsfield, Peter T. Katzmarzyk, Philip R. Schauer, Michael W. Cook, Vance L. Albaugh

TL;DR
Higher obesity severity is linked to increased risks of heart, metabolic, and kidney diseases, especially in people with a BMI of 50 kg/m² or more.
Contribution
This study quantifies how increasing BMI severity correlates with specific disease risks and earlier diabetes onset in the U.S.
Findings
BMI ≥ 50 kg/m² is strongly associated with diabetes, hypertension, and kidney disease.
Cardiovascular disease odds rise significantly with higher BMI categories.
Diabetes diagnosis occurs at younger ages in more severe obesity classes.
Abstract
This study examined the association between obesity severity and cardiometabolic and renal disease, using BMI as a surrogate for obesity severity. This is a cross-sectional study using data from the United States Behavioral Risk Factor Surveillance System (BRFSS), 2011–2023. Survey-weighted logistic regression estimated odds ratios (OR) for the diagnosis of diabetes, hypertension, hyperlipidemia, kidney disease, myocardial infarction, stroke, and coronary artery disease among increasing BMI categories. Higher BMI was associated with increased odds of all conditions. For BMI ≥ 50 kg/m2, odds were notably elevated for diabetes (OR 8.32; 95% CI: 7.78–8.91), hypertension (OR 6.07; 95% CI: 5.58–6.61), and kidney disease (OR 3.60; 95% CI: 3.21–4.03). The odds of cardiovascular disease also rose substantially, including myocardial infarction (OR 2.89; 95% CI: 2.56–3.28) and coronary artery…
Genes, proteins, chemicals, diseases, species, mutations and cell lines named across the full text — each resolved to its canonical identifier and authoritative record.
Click any figure to enlarge with its caption.
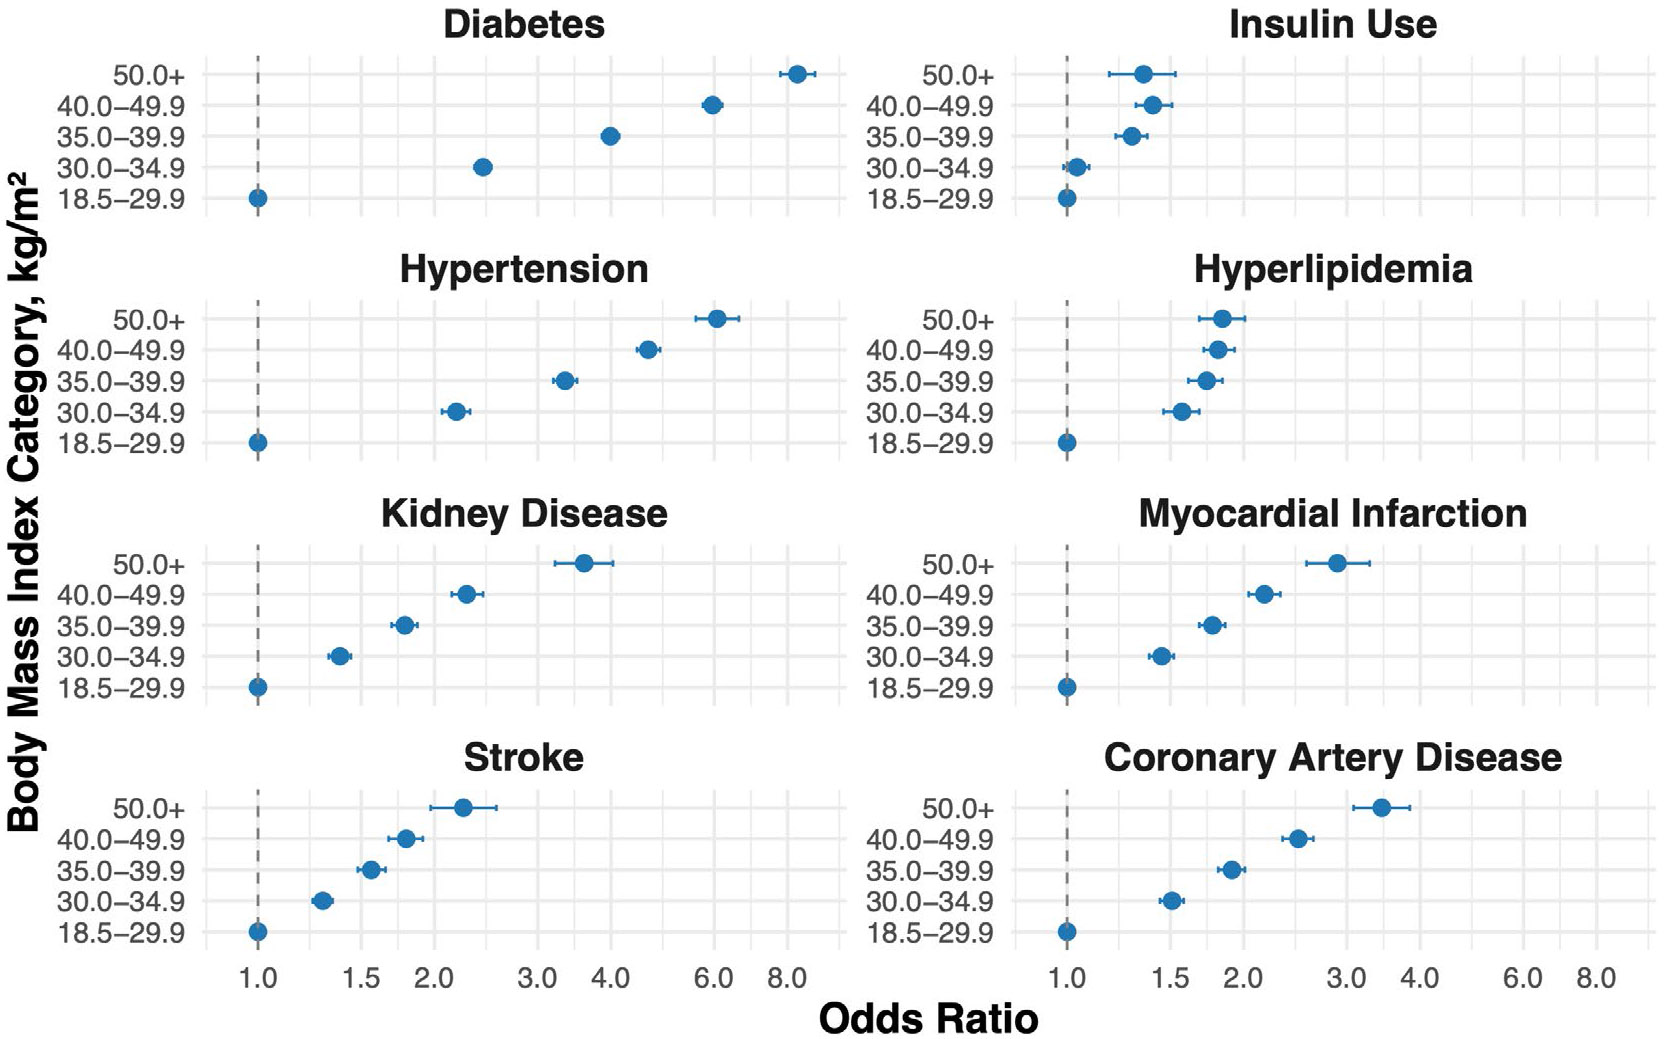 Figure 1
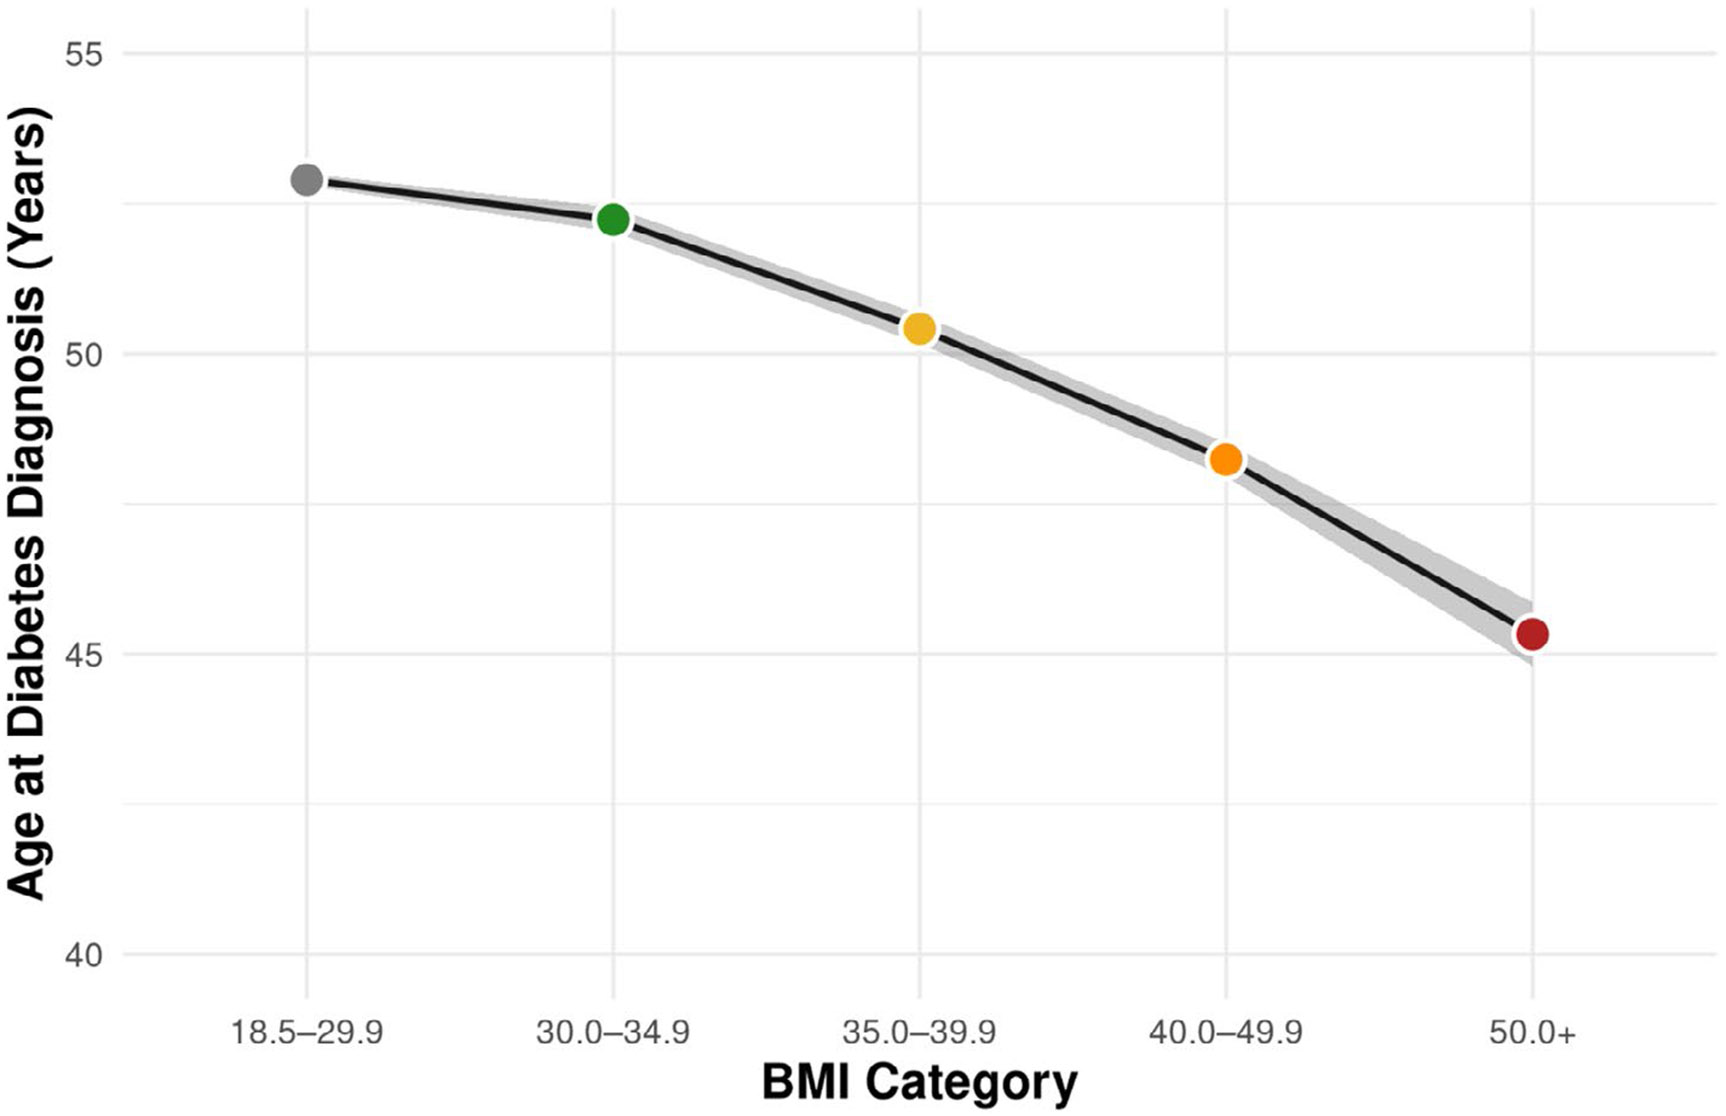 Figure 2
Peer Reviews
No public reviews on file for this paper yet. If you reviewed it on a platform where reviews are public (OpenReview, ICLR, NeurIPS, ICML), you can paste yours below so the community can read it here.
Videos
No videos yet. Explain this paper in a talk, walkthrough, or lecture? Add one.
Taxonomy
TopicsChronic Kidney Disease and Diabetes · Diabetes, Cardiovascular Risks, and Lipoproteins · Blood Pressure and Hypertension Studies
Introduction
1 ∣
Obesity prevalence in the United States (U.S.) is rising at an alarming pace [1-4]. While research demonstrates strong associations between obesity (defined as body mass index [BMI] ≥ 30 kg/m^2^) and numerous diseases affecting multiple organ systems [5], the association between obesity severity and disease burden in US adults remains largely unexplored.
Even though recent studies have focused on the clinical significance of obesity and its severity using BMI as a surrogate, unfortunately these analyses also limit “severe obesity” to BMI ≥ 40 kg/m^2^, combine BMI ≥ 30 kg/m^2^ into a single group, and/or focus on a narrow age range [6-9]. These practices are concerning, since the fastest growing categories of severe obesity in the US are BMI ≥ 50 kg/m^2^ and higher BMI subcategories [9-12]. Better appreciation of these higher BMI populations is critical, especially as these patients have increased complexity and present significant clinical challenges [13]. Thus, the objective of this study was to test the hypothesis that obesity severity is associated with higher cardiometabolic and renal disease prevalence.
Methods
2 ∣
A cross-sectional analysis was conducted using data from the U.S. Behavioral Risk Factor Surveillance System (BRFSS) collected between 2011 and 2023. BRFSS is a nationally representative, telephone-based health survey administered by the Centers for Disease Control and Prevention (CDC), which collects self-reported information on health-related risk behaviors, chronic conditions, and preventive health practices among U.S. adults. After excluding individuals with missing BMI, the final sample included over 5 million adults aged 18 years or older. To assess the impact of missing disease-specific data, a sensitivity analysis including only complete case data (n = 2,257,974) was performed (online Supporting Information), which showed nearly identical results as the primary analysis (n = 5,327,214).
BMI was used as a surrogate for obesity severity and categorized as follows: 30.0–34.9 kg/m^2^ (Class I), 35.0–39.9 kg/m^2^ (Class II), 40.0–49.9 kg/m^2^ (Class III), and ≥ 50.0 kg/m^2^ (Class IV and greater). Individuals with a non-obesity BMI (18.5–29.9 kg/m^2^) served as the reference group. BMI ≥ 50.0 kg/m^2^ was used as the highest BMI group empirically, given the incompatible sample size of individuals at higher BMI groupings for the BRFSS complex survey design.
Survey-weighted logistic regression estimated the odds of cardiometabolic and renal conditions (Table 1) across BMI categories. All models were adjusted for age (continuous), sex (female/male), and race (White/Caucasian, Black/African American, other). Models examining the extent of cardiovascular disease conditions (history of myocardial infarction, stroke, coronary artery disease) were also adjusted for hypertension and hyperlipidemia, known risk factors for coronary artery disease. Similarly, kidney disease models were also adjusted for hypertension and diabetes. Insulin use among participants with diabetes was evaluated using logistic regression, and linear regression was used to examine the association between BMI category and age at diabetes diagnosis. Age at diagnosis was only available for diabetes.
All analyses incorporated BRFSS survey weights, primary sampling units (PSUs), and stratification variables to ensure nationally representative estimates. Statistical significance was defined as p < 0.0001.
Results
3 ∣
Compared to individuals without obesity (BMI 18.5–29.9 kg/m^2^), those in higher BMI categories had progressively greater odds of cardiometabolic and renal disease (Table 2, Figure 1). Odds of having diabetes markedly increased across BMI categories, from 2.42 (95% CI: 2.34–2.50) for BMI 30.0–34.9 to 8.32 (95% CI: 7.78–8.91) for BMI ≥ 50. Insulin use was also more likely with higher BMI, reaching an odds ratio of 1.35 (95% CI: 1.18–1.53) in the highest BMI group. In addition to differences in disease burden, obesity severity was associated with a younger mean age at diabetes diagnosis (Figure 2). Individuals in the BMI 30.0–34.9 group were diagnosed with diabetes at a mean age of 52.2 years compared to 45.3 years among those with BMI ≥ 50.
The odds of hypertension rose from 2.18 (95% CI: 2.06–2.30) in the BMI 30.0–34.9 group to 6.07 (95% CI: 5.58–6.61) among those with BMI ≥ 50. For hyperlipidemia, odds increased across all BMI categories compared to reference, without a stepwise increase across BMI categories. The odds ranged from 1.57 (95% CI: 1.46–1.68) for BMI 30.0–34.9 to 1.81 (95% CI: 1.71–1.93) for BMI 40.0–49.9 and remained elevated in the BMI ≥ 50 group (OR: 1.84; 95% CI: 1.68–2.01). Kidney disease showed a strong association with obesity severity, with odds increasing from 1.38 (95% CI: 1.32–1.44) to 3.60 (95% CI: 3.21–4.03); significant but slightly attenuated associations remained after adjustment for hypertension and diabetes (OR 2.01; 95% CI: 1.73–2.34 for BMI ≥ 50).
Adverse cardiovascular conditions followed a similar pattern overall, with individuals with BMI ≥ 50 having over twice the odds of myocardial infarction (OR: 2.89; 95% CI: 2.56–3.28), stroke (OR: 2.24; 95% CI: 1.97–2.55), and coronary artery disease (OR: 3.44; 95% CI: 3.08–3.84) compared to reference. After adjustment for comorbid hypertension and hyperlipidemia, these associations persisted though were slightly attenuated (e.g., coronary artery disease OR: 2.27; 95% CI: 1.97–2.62).
Race and sex showed significant effects in all models. Independent of BMI, Black adults had higher odds of diabetes (OR: 1.79; 95% CI: 1.74–1.84), insulin use (OR: 1.23; 95% CI: 1.16–1.31), kidney disease (OR: 1.32; 95% CI: 1.26–1.39), hypertension (OR: 1.98; 95% CI: 1.90–2.05), stroke (OR: 1.80; 95% CI: 1.73–1.88), and myocardial infarction (OR: 1.17; 95% CI: 1.12–1.23) compared to White adults. Relative to males in the sample, females collectively had relatively lower odds of myocardial infarction (OR: 0.48; 95% CI: 0.46–0.50), hypertension (OR: 0.71; 95% CI: 0.65–0.77), coronary disease (OR: 0.58; 95% CI: 0.56–0.60), and insulin use (OR: 0.93; 95% CI: 0.89–0.97), but higher odds of kidney disease (OR: 1.10; 95% CI: 1.06–1.15). To better understand sex-specific effects of increasing BMI on disease burden, separate models were analyzed for males and females that revealed similar increases in odds of cardiometabolic and renal diseases as seen in the complete sample (Table S3).
Discussion
4 ∣
Leveraging nationally representative data, this analysis highlights the strong and graded association between obesity severity and cardiometabolic and renal disease burden in U.S. adults—offering novel insights into an often-overlooked population with significant implications for risk stratification and disease management [9, 10, 12]. While stepwise increases in the odds of most comorbidities were observed across increasing BMI categories, increased prevalence was even detectable for Class I obesity, a concerning finding. For example, the odds of having diabetes were over two-fold higher in the Class I obesity group compared to individuals without obesity. These findings highlight the fact that the clinical impact of obesity emerges early in the disease, emphasizing the need for early intervention and preventive measures.
As BMI is a surrogate for excess adiposity, this study provides strong evidence that the degree of adiposity may drive marked differences in cardiometabolic risk. While the exact mechanisms underlying the relationship between BMI and cardiometabolic disease burden remain unclear, numerous studies suggest that increased adiposity is associated with lipotoxicity, insulin resistance, vascular dysfunction, and higher circulating adipokines and other inflammatory mediators [14]—all of which contribute to cardiometabolic risk. Future work must focus on understanding the pathophysiologic effects of high degrees of adiposity, especially with respect to higher BMI individuals [12].
Key strengths of this study include the large, nationally representative sample and stratification of obesity severity by BMI, enabling generalizable estimates. Notably, the inclusion of individuals with BMI ≥ 50 kg/ms offers valuable insights into a high-risk group often excluded from research, despite their increasing prevalence in the U.S. population. Importantly, these individuals also experience heightened weight stigma, implicit provider bias, and structural barriers to care—all contributing factors to poor health outcomes. Such biases may discourage healthcare utilization, further compounding disease risk and health disparities. As a result, individuals with severe obesity may represent not only a metabolically high-risk population, but one that is systematically underserved.
This study also underscores racial disparities present in obesity-related health outcomes. Black adults had significantly higher odds of diabetes, hypertension, kidney disease, and stroke, even after adjusting for BMI. These findings suggest that obesity interacts with broader social and structural factors that disproportionately impact Black individuals and mirror findings from other recent studies [15]. Targeted interventions are needed to expand access to care and address systemic inequities in healthcare delivery.
Limitations of this study include the use of self-reported data with the potential for reporting and recall bias, particularly for BMI estimation. However, prior research demonstrates a consistent tendency for BMI underreporting, especially with increasing BMI [9, 10, 16]. Despite the marked increases in odds of cardiometabolic disease observed, health literacy also decreases with increasing cardiometabolic disease burden, suggesting these findings could be underestimates [17, 18]. Additionally, cross-sectional design precludes causal inference and limits the ability to evaluate the temporal relationship between BMI and disease onset. Furthermore, while the National Health and Nutrition Examination Survey (NHANES) demonstrates the fastest growing BMI category in the U.S. to be BMI > 60 kg/m^2^ [12], the sample size of this group in the BRFSS was too small to examine this group individually. This is likely because NHANES includes direct measures of height and weight, whereas BRFSS relies on self-reported data that could be even less accurate for individuals at very high BMI. Finally, while alternatives to the use of BMI are increasingly discussed with respect to obesity diagnosis [19], BMI remains a highly accurate surrogate for excess adiposity associated with clinical and preclinical obesity [20].
Conclusion
5 ∣
Further research must support the development of effective clinical and public health strategies for treating obesity as a means of preventing cardiometabolic and renal diseases. Individuals in the highest BMI categories especially benefit from early identification and comprehensive, intensive obesity management to reduce long-term complications and improve health outcomes.
Supplementary Material
supinfo
Additional supporting information can be found online in the Supporting Information section. Supporting Information. A complete-case sensitivity analysis was conducted to examine the potential effect of missing data on model estimates. Results were consistent with the main analysis (Table S1). Using the complete data set, we conducted a comorbidity-adjusted model (Table S2). Additional sex-specific analyses are summarized in Table S3.
The reference list from the paper itself. Each links out to its DOI / PubMed record.
- 1Ward ZJ, Bleich SN, Cradock AL, , “Projected U.S. State-Level Prevalence of Adult Obesity and Severe Obesity,” New England Journal of Medicine 381 (2019): 2440–2450.31851800 10.1056/NEJ Msa 1909301 · doi ↗ · pubmed ↗
- 2Zhang X, Liu J, Ni Y, , “Global Prevalence of Overweight and Obesity in Children and Adolescents,” JAMA Pediatrics 178 (2024): 800–813.38856986 10.1001/jamapediatrics.2024.1576 PMC 11165417 · doi ↗ · pubmed ↗
- 3Emmerich S, Fryar C, Stierman B, and Ogden C, “Obesity and Severe Obesity Prevalence in Adults: United States, August 2021–August 2023,” NCHS Data Brief (2024), 10.15620/cdc/159281. · doi ↗
- 4Münte E, Zhang X, Khurana A, and Hartmann P, “Prevalence of Extremely Severe Obesity and Metabolic Dysfunction Among US Children and Adolescents,” JAMA Network Open 8 (2025): e 2521170.40668581 10.1001/jamanetworkopen.2025.21170 PMC 12268495 · doi ↗ · pubmed ↗
- 5Kivimäki M, Strandberg T, Pentti J, , “Body-Mass Index and Risk of Obesity-Related Complex Multimorbidity: An Observational Multicohort Study,” Lancet Diabetes and Endocrinology 10 (2022): 253–263.35248171 10.1016/S 2213-8587(22)00033-XPMC 8938400 · doi ↗ · pubmed ↗
- 6Yao Z, Tchang BG, Albert M, Blumenthal RS, Nasir K, and Blaha MJ, “Associations Between Class I, II, or III Obesity and Health Outcomes,” NEJM Evidence 4 (2025): EVI Doa 2400229.40130972 10.1056/EVI Doa 2400229 · doi ↗ · pubmed ↗
- 7Rassy N, Straaten AV, Carette C, Hamer M, Rives-Lange C, and Czernichow S, “Association of Healthy Lifestyle Factors and Obesity-Related Diseases in Adults in the UK,” JAMA Network Open 6 (2023): e 2314741.37234008 10.1001/jamanetworkopen.2023.14741 PMC 10220514 · doi ↗ · pubmed ↗
- 8Gearon E and Backholer K, “Demographic Prevalence of Class III Obesity,” JAMA Internal Medicine 175 (2015): 2000–2001.