Phascolarctobacterium faecium reduces food intake via PYY signaling, contributing to the mitigation of body weight gain in diet-induced obese mice
Clara Bullich-Vilarrubias, Marina Romaní-Pérez, Inmaculada López-Almela, Carlos Pomares-Díaz, Silvia Basili Franzin, Giuseppe Esposito, Alfonso Benítez-Páez, Verónica Tolosa-Enguís, Yolanda Sanz

TL;DR
A gut bacterium called Phascolarctobacterium faecium helps reduce food intake and body weight in obese mice through a hormone called PYY.
Contribution
The study reveals how P. faecium mitigates obesity via PYY signaling and gut microbiota modulation in a mouse model.
Findings
P. faecium reduces food intake by increasing early PYY hormone production in diet-induced obese mice.
The bacterium modifies gut microbiota and increases branched-chain amino acids, which stimulate PYY secretion.
P. faecium also accelerates gut transit and lipid clearance, reducing adiposity independently of food intake.
Abstract
Excess energy intake contributes to adiposity in obesity. We investigated whether the human intestinal bacterium Phascolarctobacterium faecium could prevent obesity via enteroendocrine pathways in a mouse model of diet-induced obesity (DIO). Daily administration of P. faecium (2 × 10⁹ cells/mouse) reduced food intake through the early overproduction of the satiety hormone peptide YY (PYY) compared to untreated DIO mice. Moreover, P. faecium increased the intestinal levels of branched-chain amino acids, which, in turn, stimulated PYY secretion in neuroendocrine cell cultures and also modified gut microbiota composition. A pair-feeding study demonstrated that the anorexigenic effect of P. faecium contributes to its effects in attenuating body weight gain in DIO mice, but that other mechanisms are also involved in its metabolic benefits. Specifically, P. faecium accelerated gut transit and…
Genes, proteins, chemicals, diseases, species, mutations and cell lines named across the full text — each resolved to its canonical identifier and authoritative record.
Click any figure to enlarge with its caption.
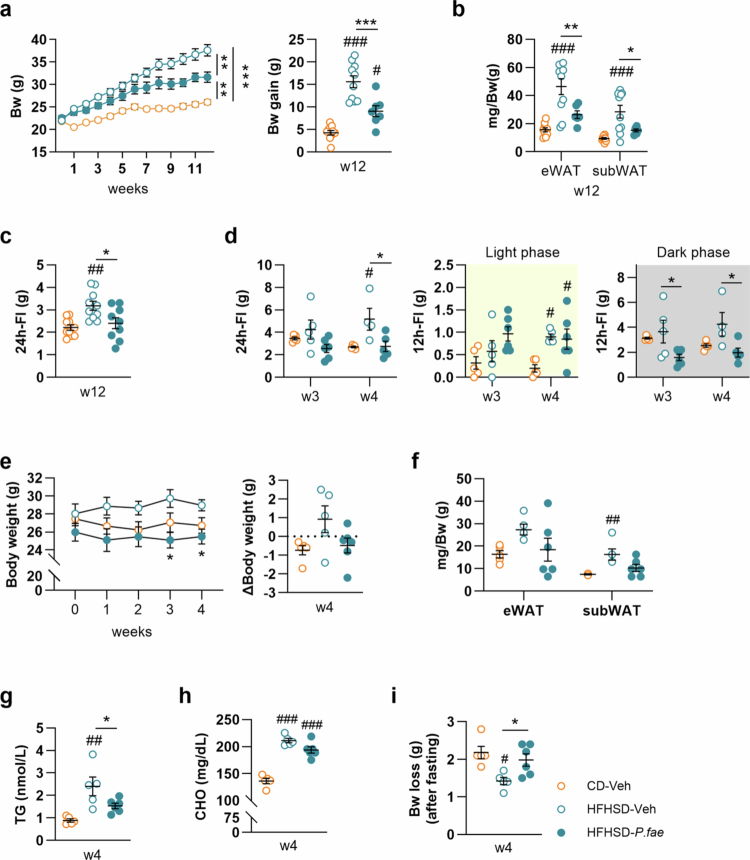 Figure 1
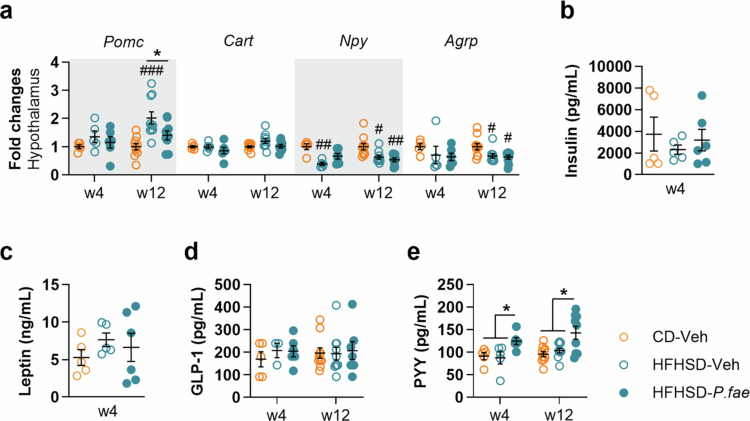 Figure 2
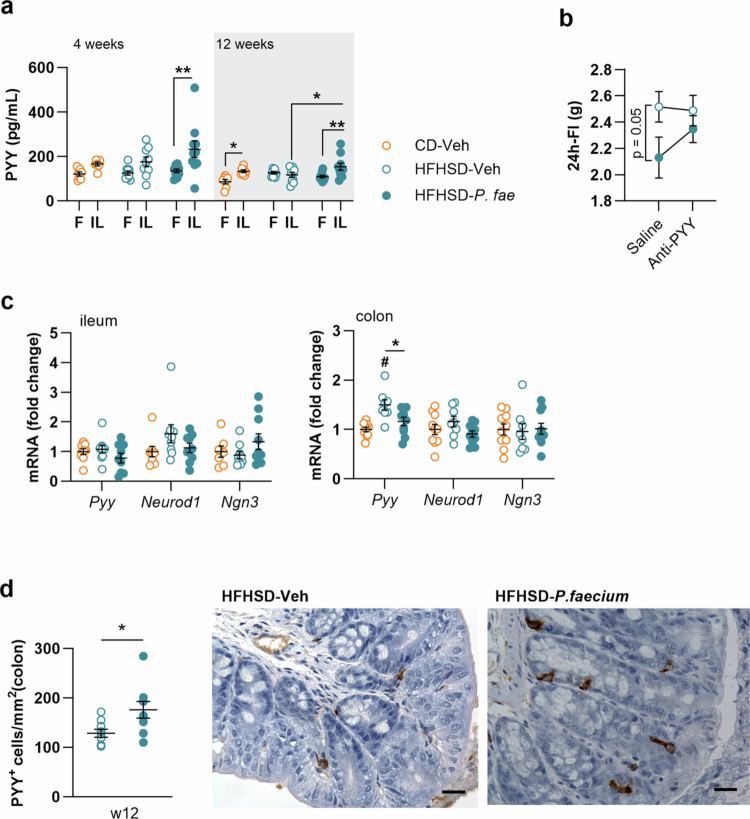 Figure 3
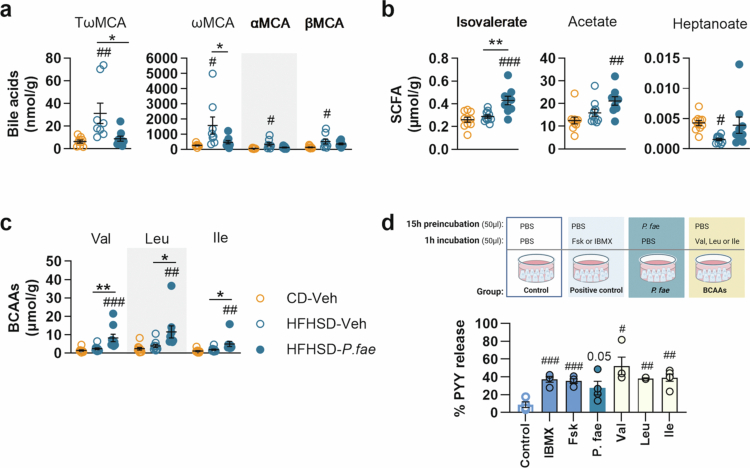 Figure 4
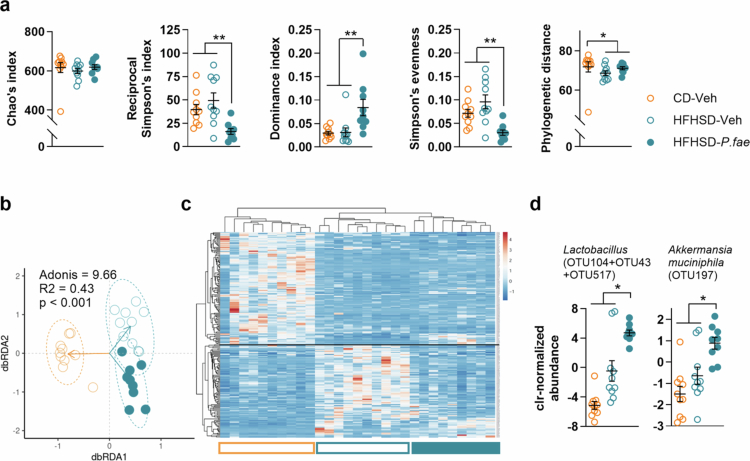 Figure 5
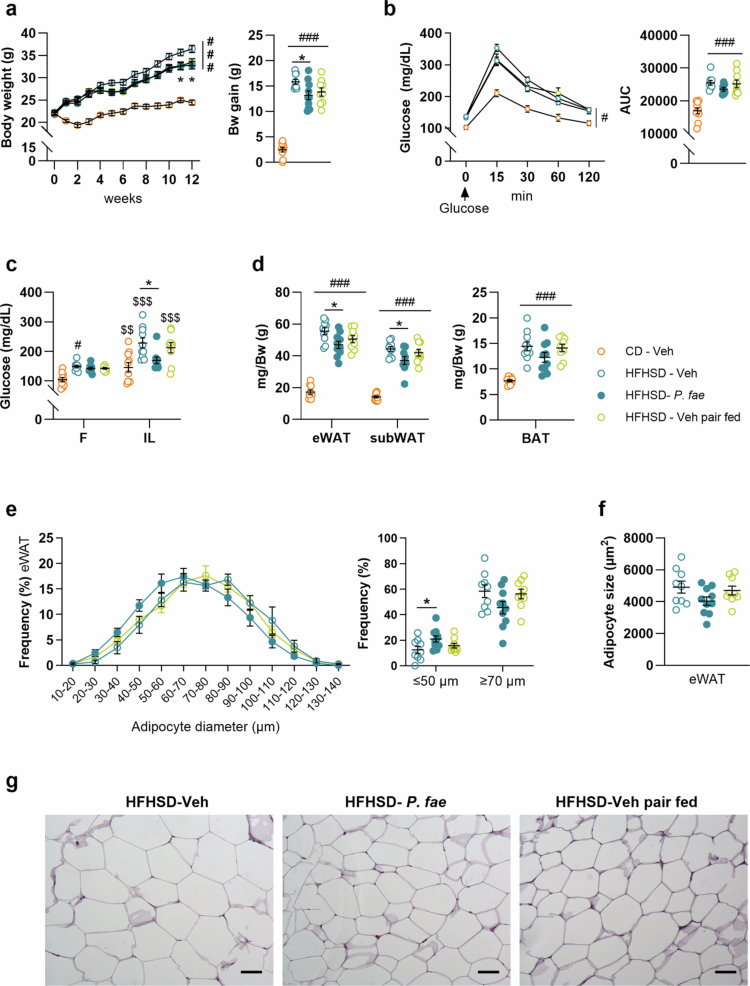 Figure 6
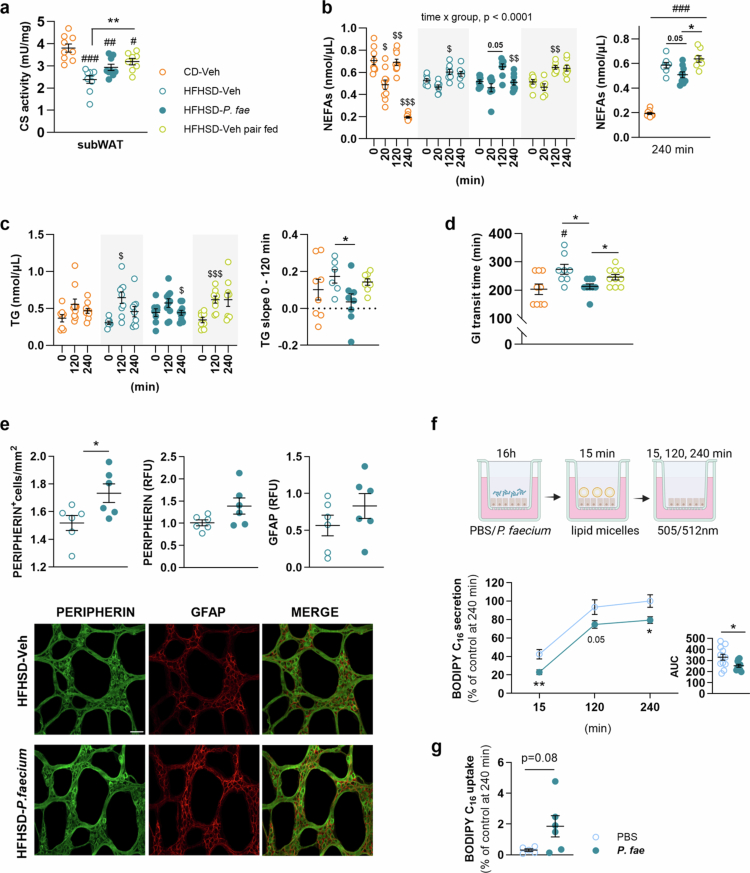 Figure 7
- —MCIU
- —EU (European Union)
Peer Reviews
No public reviews on file for this paper yet. If you reviewed it on a platform where reviews are public (OpenReview, ICLR, NeurIPS, ICML), you can paste yours below so the community can read it here.
Videos
No videos yet. Explain this paper in a talk, walkthrough, or lecture? Add one.
Taxonomy
TopicsGut microbiota and health · Probiotics and Fermented Foods · Regulation of Appetite and Obesity
Introduction
Obesity has reached epidemic proportions,1^,^2 and its multifactorial etiology complicates the development of effective therapies to curb its growing prevalence. In particular, diets high in calories, saturated fats and simple sugars disrupt energy balance, significantly disrupting hypothalamic brain circuits that govern food intake.3-9 The gut also plays an important role in controlling food intake and energy homeostasis by sensing nutrients from digested foods and transmitting this information to the brain. Nutrient sensing is mediated by specialized enteroendocrine cells (EECs) within the gut lining.10 EECs produce gut hormones10^,^11 that communicate with the brain through two primary pathways: (1) endocrine signaling, where hormones are transported through the bloodstream, and (2) paracrine signaling, involving the activation of vagal afferent neurons innervating the intestinal mucosa.12^,^13
Obesity is linked to altered secretion of anorexigenic gastrointestinal hormones, such as glucagon-like peptide 1 (GLP-1) and peptide YY (PYY), whose levels can be decreased or enhanced likely depending on the prandial phase and obesity progression.14-19 Accordingly, obesity treatments are being developed that leverage gut peptide mechanisms. These strategies aim to mimic the enteroendocrine responses observed after bariatric surgery such as enhanced postprandial secretion of GLP-1, PYY, and CCK collectively contributing to weight loss and improved glucose homeostasis.20 These approaches include gut hormone analogues21^,^22 and agonists of G-protein coupled receptors (GPCRs) that stimulate gut hormone secretion (secretagogues), with the latter currently under investigation.23 Moreover, substantial evidence indicates that consuming a Western diet alters gut microbiota composition, 24-27 contributing to obesity by increasing the amount of energy extracted from food.28 Intestinal bacteria also influence host feeding behavior by influencing satiety and reward pathways.29^,^30 Bacterial components and metabolites generated during food digestion and fermentation can stimulate EECs via toll-like receptors (TLRs) and GPCRs, respectively, leading to the synthesis and release of appetite-regulating hormones.31-34 For example, nutrient-induced growth of Escherichia coli promotes the production of the ClpB protein, which contributes to the sensation of fullness by increasing PYY secretion and activating hypothalamic proopiomelanocortin (POMC) neurons.35 Moreover, short-chain fatty acids (SCFAs) such as acetate, propionate, and butyrate, produced by bacterial fermentation of dietary fibres, activate FFAR2/3 receptors on EECs to promote the secretion of GLP-1 and PYY.36^,^37 Despite the potential of human intestinal bacteria to reduce caloric intake in obesity, direct evidence establishing their causal role remains limited. One observational study spanning four years found that the abundance of the genus Phascolarctobacterium decreased in children experiencing excessive body weight gain compared with those with normal weight gain38 and P. faecium inversely associates with overweight and obesity in a large meta-analysis including more than 7,500 adult human subjects.39 Moreover, Phascolarctobacterium has been implicated in the antidiabetic effects of metformin or berberine treatment in obese rats.40 At species level, caloric restriction in obese individuals led to an increased abundance of P. faecium alongside decreases in both body weight and visceral fat.41 However, the specific causal role of P. faecium in obesity needs further investigation in translational studies.39 Here, we investigated whether the strain P. faecium DSM 32890 (referred to as P. faecium) affects the enteroendocrine system and food intake—a largely unexplored mechanism with potential anti-obesogenic effects in diet-induced obesity (DIO). Utilizing in vivo models (hormone blocking and paired-feeding models) and in vitro experimental systems, we demonstrated that P. faecium exerts anorexigenic effects by enhancing PYY secretion, a key factor in body-weight control. Our findings also indicated that both the bacterium itself and its elevated intestinal metabolites (branched-chain amino acids, BCAAs) act as PYY secretagogues. Notably, we found that P. faecium accelerated gut transit time and reduced lipid absorption, independent of its influence on food intake, providing an additional pathway for obesity prevention.
Material and methods
Phascolarctobacterium faecium isolation and culture conditions
P. faecium DSM 32890 (referred to as P. faecium) was isolated from the feces of a healthy volunteer, as described elsewhere.42 For in vivo experiments, P. faecium was grown in modified PYG medium supplemented with sodium succinate (8 g/L) instead of glucose, at 37°C under anaerobiosis for 48 h. Following centrifugation (10000g, 10 min, 4°C) and two washes with phosphate-buffered saline (PBS), the cells were re-suspended in PBS containing 0.05% cysteine and 20% glycerol. The number of viable bacteria (cells/ml) was determined using BD TrucountTM Tubes (Becton Dickinson, Franklin Lakes, NJ) and propidium iodide staining (Sigma-Aldrich) in a BD LSRFortessa flow cytometer (Becton Dickinson).
Mice, diets and experimental design
C57BL/6 male mice, aged 6-8 weeks (Charles River Laboratories), were housed individually in a controlled environment with constant humidity and temperature (23 ± 2°C). Animals were maintained on a 12-hour light–dark schedule, with lights switched on at 06:00 and off at 18:00. For reference, zeitgeber time (ZT)0 and ZT12 correspond to lights on and lights off, respectively.
Unless otherwise specified, mice had unrestricted access to either a control diet (CD) with 10% kcal from fat and without sucrose (D12450K), or a high-fat, high-sugar diet (HFHSD) with 45% kcal from fat and 21% from sucrose (D12451), both obtained from Ssniff Spezialdiäten GmbH. Sample size, detailed in Figure S1, was based on our prior experience.43 Differences in sample sizes across figures are due to the exclusion of samples due to technical issues and/or insufficient material. Mice were weighed and randomly assigned to experimental groups, resulting in similar body weights across groups. All animal experimental procedures performed complied with the European Union 2010/63/EU and the Spanish RD 53/2013. Procedures were reviewed and approved by the ethics committee of the University of Valencia (SCSIE, UV, Spain) and authorized by the Dirección General de Agricultura, Ganadería y Pesca (Generalitat Valenciana; approval IDs: 2017/VSC/PEA/00015, 2019/VSC/PEA/0020, and 2020/VSC/PEA/0022).
We explored the effects of oral supplementation of P. faecium on DIO in mice by conducting the experiments detailed below and graphically represented in Figure S1.
Experiment 1 (Figure S1a): HFHSD-fed mice received a daily oral gavage of P. faecium (2 × 10⁹ cells/mouse in PBS plus 0.05% cysteine, 20% glycerol) or vehicle (PBS plus 0.05% cysteine, 20% glycerol) at the beginning of the dark phase (ZT12) throughout the 12-week experimental period, while CD-fed mice received only vehicle. Body weight was measured weekly and 24-h individual food intake was measured after 3, 4 and 12 weeks of HFHSD-feeding by manually weighing the provided and residual food in each cage. At week 4, body weight loss after overnight fasting was estimated in HFHSD-fed mice receiving vehicle or P. faecium. After 4, 8 and 12 weeks of HFHSD-feeding, animals were anesthetized with isoflurane following an overnight fasting, and blood samples were obtained through cardiac puncture. Immediately after cervical dislocation, brains and cecal contents were collected and snap-frozen for later processing. Mice euthanized at week 8 were used to prepare whole-mounts of colonic circular muscle myenteric plexus (CMMP) for immunostaining of enteric neurons and glia.
Experiment 2: (Figure S1b): For the pair-feeding experiment, mice were fed HFHSD for 12 weeks and received a daily oral dose of vehicle or P. faecium, as in Experiment 1. An additional group, also fed HFHSD, was pair-fed over a 24-h period, receiving an amount of food equal to the average daily consumption of the P. faecium-treated group from the previous day. The pair-fed group was orally administered with vehicle. Body weight was monitored weekly and food intake was measured daily at ZT12.
Different functional assessments were performed throughout the intervention, including intestinal absorption of lipids, PYY secretion and glycemia in response to an oral nutritional challenge, intestinal transit time and oral glucose tolerance test (OGTT).
-Intestinal absorption of lipids, PYY secretion assays and postprandial glycemia: At weeks 4 and 12, 4-h fasted mice received an oral load of intralipid 20% (300 µL per mouse, Sigma) at ZT12, as reported,44 and blood was collected from the saphenous vein at 0 (fasting), 20, 120 and 240 min after intralipid administration. NEFAs were measured at 0, 20, 120 and 240 min; triglycerides at 0, 120 and 240 min; and PYY was measured in samples collected at 0 and 20 min. For PYY analysis, intralipid administration and blood sampling were also performed at ZT0 (light phase) to determine the optimal phase of gut hormone secretion. Glycemia was determined in blood from the saphenous vein at fasting and 20 min after intralipid administration using glucose test strips and a Contour XT glucometer (Bayer).
-Gastrointestinal transit time: At week 7, intestinal transit time was determined as reported.45 Briefly, mice with free access to food were administered an oral gavage of carmine red dissolved in 0.5% methylcellulose in 0.9% PBS at ZT12. The color of fecal pellets of each mouse was examined every 30 min. Intestinal transit time was measured as the time between oral gavage and first appearance of carmine dye in feces.
-OGTT: At week 10, an OGTT was carried out as described.46
At week 12, overnight-fasted mice were intraperitoneally injected with insulin (1.5 U/kg, NovoRapid FlexPen®, Novo Nordisk). After 15 min, mice were sacrificed by cervical dislocation. Blood glucose levels were measured from the saphenous vein at fasting and after insulin administration. Epididymal white adipose tissue (eWAT), subcutaneous white adipose tissue (subWAT), and brown adipose tissue (BAT) were dissected and weighed. Fragments of eWAT, subWAT and colon were immersed in 10% neutral buffered formaldehyde for fixation and further hematoxylin-eosin staining and immunohistochemistry. Additionally, fragments of subWAT were immediately frozen for gene expression processing.
Experiment 3: (Figure S1c): Experiments were conducted in mice fed HFHSD for 4 weeks. We first performed two dose-response studies to validate the immunoneutralization of PYY by administrating a PYY antibody. Subsequently, we performed a PYY-blocking experiment to test whether P. faecium requires PYY to exert its anorexigenic effects.
In the first test, we assessed the capacity of an anti-PYY antibody (Phoenix Pharmaceuticals) to increase food intake. Two concentrations were tested: a dose 10 and 100 times higher than the PYY plasma levels in P. faecium-treated mice (i.e., 1500 pg/mouse or 15000 pg/mouse, respectively). Mice were intraperitoneally injected with saline, 10 × dose or 100 × dose of anti-PYY antibody, 1 h before the onset of the dark phase (ZT11). Ad libitum food intake was measured at ZT24 for two consecutive days. In the second test, we determined whether the lower effective dose of the anti-PYY antibody could block the anorexigenic effect of exogenously administered PYY. Mice were intraperitoneally injected: saline at ZT11 and at ZT12 (day 1 and day 2); saline followed by 5 µg/kg of PYY_3-36_ (Tocris™ Bioscience) at ZT11 and ZT12, respectively (day 3 and day 4); and a 10 × anti-PYY antibody dose followed by PYY_3-36_ at ZT11 and ZT12, respectively (day 5 and day 6). Ad libitum food intake was measured 4 h after the saline/saline, saline/PYY and anti-PYY antibody/PYY_3-36_ administrations (ZT16) for two consecutive days. For the PYY-blocking experiment, mice received a daily oral gavage of P. faecium at the same dose as in Experiment 1 or vehicle during 4 weeks. At the end of the intervention, mice were injected intraperitoneally (at ZT11) with saline and then with 10 × anti-PYY antibody, for two consecutive days each. Ad libitum food intake was determined after 24 h.
For all experiments, blood samples were collected in Microvette® 500 K3E tubes (Sarstedt). For GLP-1 analysis, blood tubes contained dipeptidyl-peptidase (DPP)-4 inhibitor (Sigma). Plasma was obtained by immediate centrifugation and stored at –80°C until analysis.
Hormone measurements
Plasma levels of total PYY, total GLP-1 and insulin were quantified using a MILLIPLEX Mouse Metabolic Hormone Expanded Panel (MMHE-44K) on a Luminex® MAGPIX System (Milliplex, Merck). Leptin plasma levels were determined with Mouse Leptin ELISA (Merck), on a CLARIOstar Microplate Reader (BMG Labtech). Mouse Insulin ELISA (Mercodia) was used to measure insulin at 0 and 15 min of OGTT. Hormone concentrations fall within the expected range of the commercial kits used, and absolute values may differ from those obtained with other assay platforms.
Triglycerides, cholesterol, NEFAs and citrate synthase measurements
Triglycerides, cholesterol and non-esterified fatty acids (NEFAs) were measured in plasma using the Triglyceride Colorimetric Assay Kit (Elabscience) or the Triglyceride Quantification Colorimetric Assay Kit (Abcam), Cholesterol Liquid Kit (Química Clínica Aplicada SA), and Free Fatty Acid Colorimetric Assay Kit (Abcam). Citrate synthase activity was measured in subWAT using the Citrate Synthase Assay Kit (Abcam).
Acute PYY secretion assay in STC-1 cell line
Enteroendocrine murine STC-1 cells (ATCC®) were grown in Dulbecco's Modified Eagle's Medium (DMEM; ATCC®) supplemented with 10% heat-inactivated fetal bovine serum (FBS) (Gibco™), 1% penicillin/streptomycin (Sigma) and 0.1% amphotericin B (Corning®) in 75 cm^2^ cell culture flasks (SPL Life Sciences) and maintained in an incubator at 37°C in a 5% CO_2_ atmosphere. Cells were then seeded in 24-well cell culture plates (SPL Life Sciences) at a density of 1 × 10^5^ cells per well and incubated at 37ºC for 48 h until reaching 80% confluence. The medium was removed and cells were washed with PBS. Cells, maintained in DMEM, were preincubated with pasteurized P. faecium (cell-to-bacteria ratio of 1:10, 50 µl) or an equivalent volume of PBS. After 15 h, PBS-preincubated cells, where further incubated for 1 h with PBS (used as control), the BCAAs valine, leucine, and isoleucine (100 µM each, Sigma), 3-isobutyl-1-methylxanthine (IBMX, 10 µM, Sigma) or forskolin (Fsk, 10 µM, Sigma), used as positive controls. After 16 h (preincubation + incubation), supernatants and cells were harvested and processed to explore the sustained PYY secretory response (induced by 16 h of P. faecium incubation) and the acute PYY secretory response (induced by 1 h of BCAAs incubation). Protein from supernatants was concentrated using Amicon® ultrafiltration tubes (0.5 mL) (Merck Millipore). Cells were removed by adding Trypsin-EDTA Solution (ATCC®) and lysed with RIPA buffer (Sigma) with protease inhibitor (Roche). Isolated proteins were stored at before PYY determination using the Mouse PYY EIA kit (RayBiotech).
Lipid secretion assays in Caco-2 cells
Human colonic Caco-2 cells (ATCC®) were grown in Eagle’s Minimum Essential Medium (EMEM; ATCC®) supplemented with 10% heat-inactivated FBS (Gibco™), 1% penicillin/streptomycin (Sigma) and 0.1% amphotericin B (Corning®) and maintained in a 5% CO_2_ humidified atmosphere at 37°C. Cultured Caco-2 cells were seeded in 12-well Corning® Transwell® plates with polycarbonate membrane inserts (12 mm diameter, 1.12 cm^2^, 0.4 μm pores; Corning®) at a density of 1 × 10^5^ cells per insert. A lipid secretion assay was conducted when cell monolayers reached a trans-epithelial electrical resistance (TEER) > 600 Ω x cm^2^, measured with a Millicell-ERS-2 voltohmmeter (Merck-Millipore).
P. faecium (cell-to-bacteria 1:10 ratio) or PBS, used as a control, was added to cells of the apical compartment and incubated for 16 h. After one wash with PBS, medium containing lipid micelles (2 mM sodium taurocholate, 0.05 mM cholesterol, 0.6 mM oleic acid, 0.2 mM 2-mono-oleoylglycerol, 0.2 mM L-α-lysophosphatidylcholine [Sigma] and 0.02 mM of the fluorescent fatty acid BODIPY™ FL C_16_ [Thermofisher]) was added to the apical compartment for 15 min. Then, medium containing micelles was replaced by fresh medium. BODIPY™ FL C_16_ secretion was determined by measuring fluorescence of both the apical and basal compartments at 15, 120 and 240 minutes after removal of micelles using a CLARIOstar Microplate Reader (BMG Labtech). At 240 min, cells were collected using Trypsin-EDTA Solution (ATCC®), lysed with 0.1% Triton^TM^ X-100 solution and sonicated in an ultrasonic bath for 15 minutes. Lysed cells were centrifuged at 16000g for 3 min at 4°C and supernatants were collected for immediate fluorescence measurements.
Metabolomic analyses in cecal content
Bile acids (BAs), short-chain fatty acids (SCFAs) and branched amino acids (BCAAs) were analyzed in the cecal content of mice from Experiment 1 according to standardized protocols of LEITAT Technological Center (Valencia, Spain). In brief, samples were extracted in a PreCellys system for BCAAs quantification by ultra-performance liquid chromatography (UPLC) following AccQ-Tag chemical derivatization. SCFAs were analyzed by gas chromatography-mass spectrometry (GC-MS) and the concentration of BAs was determined by UPLC.
Histology, immunohistochemistry and immunofluorescence
Fixed eWAT, subWAT and 3-cm proximal colon tissues were embedded in paraffin. Following standardized protocols by Patologika Laboratorio S.L. (Valencia, Spain), WAT samples were stained with hematoxylin and eosin, and intestinal samples underwent immunohistochemical staining for quantification of PYY-positive cells using a 1:9000-dilution of anti-PYY antibody (Abcam, Cat. #ab22663) and a specific horseradish peroxidase-conjugated secondary antibody. Bright-field digital images were captured with an Eclipse 90i Nikon wide-field microscope (Nikon Corporation) coupled to a CFI Plan Fluor DIC M/N2 (MRH00200) Nikon dry-air objective of 20 × combined with an optical zoom factor of 0.8 × for adipose tissue samples and 4 × for intestinal samples. Individual adipocyte areas were selected using Fiji software (ImageJ 1.49q Software, National Institutes of Health, USA) and quantified by Nis elements BR 3.2 software (Nikon Corporation). Data are based on measurements of 70-300 adipocytes from 4-6 sections per mouse. For intestinal samples, PYY-positive cells and mucosal areas were selected and quantified using Nis elements BR 3.2 software, and the number of PYY-positive cells was calculated per unit of mucosal area.
Immunostaining of enteric neurons and glia in colon was conducted in CMMP whole-mount preparations obtained as previously described.47 Whole-mount preparations were fixed in ice-cold 4% PFA, washed with 1X PBS containing 0.1% Triton X-100 (T-PBS), and incubated for 45 minutes at room temperature in blocking solution (4% normal donkey serum, 0.1% Triton X-100, 1% BSA in PBS). Samples were then treated overnight at 4°C with rabbit anti-GFAP (1:200 v/v, Bioss) and mouse anti-peripherin (1:200 v/v, Santa Cruz Biotechnology). Secondary antibodies (1:400, v/v) donkey anti-rabbit Alexa Fluor 564 (ThermoFisher Scientific) and donkey anti-mouse Alexa Fluor 488 (Jackson Immuno Research) were applied for 2 h at room temperature. Washes in 1X PBS were conducted after each incubation. Sections were mounted in ProLong Diamond Antifade mountant (ThermoFisher Scientific). Images were acquired through the × 20 objective on a Zeiss LSM 980 confocal microscope (SCSIE-UV). Images were anlayzed using Fiji software (ImageJ 1.49q Software, National Institutes of Health, USA) to quantify the average relative fluorescence units (RFU) from 15–20 tissue cross-sections or to determine the number of peripherin-positive neurons per mm^2^.
RNA extraction and RT-qPCR analysis
For total RNA extraction of hypothalamus and subWAT, TRIsure™ reagent (Bioline) was used according to the manufacturer’s instructions. For reverse transcription, between 1-2 μg of total RNA were incubated at 25°C for 10 min, 37°C for 120 min and 85°C for 5 min with the High-Capacity cDNA Reverse Transcription Kit (Thermo Fisher Scientific) in an Eppendorf thermocycler. Real-time qPCR was carried out by incubating previously validated cDNA dilutions with 300 nM of gene-specific primer pair sequences (Table S1, Isogen) and LightCycler 480 SYBR Green I Master Mix (Roche) in a LightCycler® 480 Instrument (Roche). Relative mRNA levels were calculated for each gene according to the 2^–(ΔΔCt)^ method. The amount of target gene, normalized to the housekeeping gene ribosomal protein L19 (Rpl19), is represented as mRNA fold-change expression relative to the control group.
Fecal microbiota analysis
Microbiota analysis was conducted as previously described.48^,^49 Briefly, fecal DNA was isolated using the QIAamp PowerFecal DNA kit (Qiagen). The V3–V4 variable regions of the bacterial 16S ribosomal RNA (rRNA) gene were amplified from fecal DNA by PCR, and products were purified, quantified and pooled in equimolar quantities and sequenced with a 2 × 300 PE configuration in the Illumina MiSeq platform (Eurofins Genomics GmbH). Raw data was downloaded and processed for pair-end assembly,50 de-multiplexing,51 and chimera removal,52 based on a reference dataset (SILVA database, Release 138).53 Operational Taxonomic Unit (OTU) approach was implemented from rarefied dataset (10,000 sequences per sample, randomly selected) and following reference-free methods.54 Alpha diversity descriptors were computed via QIIME v1.9.1.55 allowing calculation of phylogenetic distances.56 The assessment of community structure across groups was carried out by distance-based redundancy analysis (dbRDA). For taxonomy assessment, we used the full denoised dataset and compositional microbiota-derived (centered log-ratio - CLR) data with prior execution of zero imputation (Bayesian-Multiplicative replacement). The taxonomic identification of OTUs was supported by SINA aligner57 and SILVA database (Release 138).
Statistical analysis
Statistics were performed with GraphPad Prism version 9.5.1 for Windows (GraphPad Software). Normality and equality of variances of data were assessed through the D’Agostino & Pearson test and Bartlett’s test, respectively. One-way analysis of variance (ANOVA) followed by Tukey’s post hoc test was conducted to compare three independent groups, either CD-Veh, HFHSD-Veh and HFHSD-P. faecium or HFHSD-Veh, HFHSD-P. faecium and HFHSD-Veh paired groups. The Kruskal-Wallis test followed by Dunn’s test for multiple comparisons was used for nonparametric data. Two or three-way ANOVA were used to assess the main effects and interactions between variables. When interactions were identified, Tukey’s post hoc tests were conducted. Differences were considered significant when p-values were p < 0.05. Graphs were plotted using GraphPad Prism version 9.5.1. Statistical analyses on microbiota data were conducted in R (version 4.1.2), employing non-parametric methods, such as the Kruskal-Wallis test and pairwise Wilcoxon Rank Sum test for unpaired samples. To account for multiple comparisons among alpha diversity descriptors, Benjamini-Hochberg post hoc correction was applied. Statistical robustness for differences of the microbial community structure, evaluated through interpretative approaches, was completed using the permutation-based adonis function from the vegan package. Differences in OTU abundance between groups were determined using the Kruskal-Wallis test, followed by Benjamini-Hochberg correction. OTUs displaying highly divergent abundance were selected when the Kruskal-Wallis corrected p-value was ≤ 0.01. Correlations were determined using Kendall rank correlations. GraphPad Prism version 9.5.1, and ggplot2 and grid R v4.1.2 packages were used to generate graphs and plots. Heatmap hierarchical clustering of OTUs (scaled DNA read counts) was achieved using Euclidean distance and the complete clustering method.
Results
P. faecium reduces food intake in diet-induced obese mice by amplifying the production and secretion of PYY
Oral administration of P. faecium to mice fed HFHSD for 12 weeks led to a significant decrease in body weight gain (Figure 1a, p < 0.001) accompanied by lower weights of eWAT (Figure 1b, p = 0.019) and subWAT adipose tissue (Figure 1b, p = 0.050). Twenty-four-hour food intake was significantly higher in untreated DIO mice than in CD-fed mice (Figure 1c, p = 0.003), and this was reduced by P. faecium administration, reaching levels comparable with CD-fed mice after the 12-week intervention (Figure 1c, p = 0.020). To determine when P. faecium started to suppress food intake during HFHSD feeding, we measured food intake weekly in a separate experiment. P. faecium administration prevented the development of hyperphagia in HFHSD-fed mice at 4 weeks, but not at 3 weeks (Figure 1d, CD-Veh vs HFHSD-Veh, p = 0.014; HFHSD-Veh vs HFHSD-P. fae, p = 0.016). Specifically, food intake suppression was observed during the dark phase, but not the light phase, after 12 hours of ad libitum feeding (Figure 1d: week 3, p = 0.019; week 4, p = 0.019).
*P. faecium improves the metabolic phenotype of diet-induced obese mice and reduces food intake. In mice fed CD or HFHSD treated with Veh or with P. fae, we measured: (a) Body weight (Bw) follow-up and Bw gain, (b) eWAT and subWAT weight normalized by body weight, and (c) 24 h-FI after 12 weeks of intervention. (d) 24 h- and 12 h- (light and dark phase) FI after 3 and 4 weeks of intervention. (e) Bw evolution and variations (Δ Body weight) after 4 weeks of intervention. (f) Weight of eWAT and subWAT normalized by body weight, after 4 weeks of intervention. Plasma levels of (g) TG and (h) CHO after 4 weeks of intervention. (i) Bw loss after an overnight fast, after 4 weeks of intervention. Abbreviations: Bw: body weight; CD: control diet; CHO: cholesterol; eWAT: epididymal white adipose tissue; FI: food intake; HFHSD: high-fat, high-sugar diet; P. fae: Phascolarctobacterium faecium; subWAT: subcutaneous white adipose tissue; TG: triglycerides; Veh: vehicle; w- week. a−c (12-week intervention): CD/HFHSD-Veh n = 10 per group and HFHSD-P. fae n = 6−9; d-i (4-week intervention): CD/HFHSD-Veh n = 5 per group and HFHSD-P. fae n = 6. HFHSD-P. fae measurements were excluded due to invalid values in Figure 1a (BW—3 data points excluded due to mouse aggression), Figure 1b (adiposity—4 data points excluded due to inadequate sample collection), and Figure 1c (FI—1 data point excluded due to food spillage). Data shown as mean ± SEM. One-way ANOVA followed by Tukey’s post-hoc test (a-body weight gain, b, c, e-ΔBw gain, d, f−i); two-way ANOVA followed by Tukey’s post-hoc test (a and e [body weight evolution]). Significant effects at #p < 0.05, ##p < 0.01 and ###p < 0.001 versus CD-Veh group; *p < 0.05, **p < 0.01 and **p < 0.001.
We next investigated whether the anorexigenic effects of P. faecium in the early stages of DIO correlated with metabolic improvements. P. faecium treatment reduced body weight during the 3- and 4-week administration periods (Figure 1e: week 3, p = 0.017; week 4, p = 0.020), although there were no significant net differences in body weight change at the end of the 4-week intervention (Δ Body weight), except for a tendency of P. faecium to prevent weight gain compared to untreated HFHSD-fed mice (t-test, p = 0.060). Compared to CD-fed mice, untreated HFHSD-fed mice showed an increase in subWAT weight (Figure 1f: CD-Veh vs HFHSD-Veh, p = 0.009), whereas this effect was not observed in P. faecium-treated mice (Figure 1f). No significant differences were detected in eWAT weight among the groups (Figure 1f). Similarly, after 4 weeks of intervention, the elevated plasma triglyceride levels observed in untreated HFHSD-fed mice (Figure 1g: CD-Veh vs HFHSD-Veh, p = 0.022) were reduced by P. faecium treatment (Figure 1g: HFHSD-Veh vs HFHSD-P. fae, p = 0.054). However, cholesterol levels remained elevated in both untreated and P. faecium-treated HFHSD-fed mice (Figure 1h). Furthermore, P. faecium administration resulted in significantly greater body weight loss following a 12-hour fast compared to untreated HFHSD-fed mice (Figure 1i: CD-Veh vs HFHSD-Veh, p = 0.010, and HFHSD-Veh vs HFHSD-P. fae, p = 0.045), suggesting that the bacterium enhanced the utilization of energy stores, likely from adipose tissue, during fasting in the early stages of DIO.
Given these findings, we analyzed the gene expression of hypothalamic neuropeptides involved in the central control of food intake at weeks 4 and 12 of HFHSD feeding. Analysis of anorexigenic neuropeptide mRNA levels revealed that Pomc gene expression was significantly higher in untreated HFHSD-fed mice than in CD-fed mice, but only at the end of the intervention (week 12, Figure 2a: CD-Veh vs HFHSD-Veh, p < 0.001), and this was normalized by P. faecium administration (Figure 2a: HFHSD-Veh vs HFHSD-P. fae, p = 0.047). By contrast, Cart expression was unaffected by HFHSD feeding or P. faecium treatment (Figure 2a). Regarding orexigenic neuropeptides, the mRNA levels of Npy were significantly lower in untreated HFHSD-fed mice than in CD-fed mice at both 4 and 12 weeks of HFHSD feeding (Figure 2a: week 4, p = 0.002 and week 12, p = 0.011). Lower expression of Npy was also found after 12 weeks of P. faecium treatment, but not after 4 weeks (Figure 2a, p = 0.002). The transcript levels of the orexigenic neuropeptide Agrp mirrored the Npy gene expression profile, showing reductions only after 12 weeks of HFHSD feeding, irrespective of whether the mice were treated or not with P. faecium (Figure 2a: CD-Veh vs HFHSD-Veh, p = 0.037 and CD-Veh vs HFHSD-P. fae, p = 0.020).
*P. faecium increases the plasma levels of the anorexigenic hormone PYY in diet-induced obese mice. In mice fed CD or HFHSD treated with Veh or with P. fae, we measured: (a) Gene expression of anorexigenic (Pomc and Cart) and orexigenic (Npy and Agrp) neuropeptides in the hypothalamus after 4 and 12 weeks of intervention. (b) Plasma levels of insulin and (c) leptin after 4 weeks of intervention. (d) Plasma levels of GLP-1 and (e) PYY after 4 and 12 weeks of intervention. Abbreviations: CD: control diet; HFHSD: high-fat, high-sugar diet; P. fae: Phascolarctobacterium faecium; Veh: vehicle; w- week. 12-week intervention: CD/HFHSD-Veh n = 10 per group and HFHSD-P. fae n = 9-10; 4-week intervention: CD/HFHSD-Veh n = 4-5 per group and HFHSD-P. fae n = 5-6. Measurements were excluded due to invalid values in Figure 2a (gene expression of hypothalamic neuropeptides—1 data point excluded from HFHSD-P. fae due insufficient RNA material), Figure 2d (GLP-1—1 and 3 data points from HFHSD-Veh and HFHSD-P. fae, respectively, excluded due to levels below the detection range), and Figure 2e (PYY—1 data point from HFHSD-Veh and HFHSD-P. fae due to levels below the detection range). Data shown as mean ± SEM. One-way ANOVA followed by Tukey’s post-hoc test. Significant effects at #p < 0.05, ##p < 0.01 and ###p < 0.001 versus CD-Veh group; p < 0.05. See also Table S1.
To investigate how P. faecium might reduce appetite in DIO mice, we measured plasma levels of hormones involved in energy intake regulation. Insulin and leptin, which play a role in long-term energy balance, were not significantly altered by either HFHSD or P. faecium treatment after 4 weeks (Figure 2b and 2c). We also measured the anorexigenic hormones GLP-1 and PYY, which are postprandially secreted by EECs, after 4 and 12 weeks of HFHSD feeding. P. faecium treatment did not change GLP-1 levels in DIO mice at either time point (Figure 2d), but it significantly increased plasma PYY levels at both 4 and 12 weeks of HFHSD feeding (Figure 2e: HFHSD-Veh vs HFHSD-P. fae week 4, p = 0.047; week 12, p = 0.019), whereas PYY levels in untreated HFHSD-fed mice were similar to those in CD-fed mice (Figure 2e).
Taken together, these data suggest that P. faecium administration induces an appetite-reducing effect from the early stages of DIO, potentially through increased PYY secretion. This early hormonal change might precede the longer-term metabolic benefits observed on body weight and adiposity.
To further explore how P. faecium might stimulate PYY, we examined PYY secretion in response to a nutritional challenge of a 20% lipid emulsion (intralipid). We first determined the optimal phase of the light-dark cycle to observe PYY secretion after intralipid administration in both untreated and P. faecium-treated mice after 4 weeks of HFHSD feeding. We observed that PYY plasma levels were influenced by the treatment (vehicle/P. faecium), the feeding state (fasting/intralipid) and the daily phase (light/dark). The highest PYY levels were found in P. faecium-treated mice after intralipid administration during the dark phase (Figure S2a). Post-hoc analyses confirmed that postprandial PYY levels in P. faecium-treated mice were significantly higher in the dark phase than in the light phase (Figure S2a). Based on these findings, we conducted the secretion assay in the dark phase after 4 and 12 weeks of HFHSD feeding. After 4 weeks, a significant main effect of nutritional status (fasting vs. intralipid; p < 0.001) was observed (Figure 3a), indicating elevated PYY levels following intralipid administration. Post-hoc analysis indicated that, in response to intralipid, PYY levels were particularly increased in P. faecium-treated mice, which tended to exhibit higher PYY concentrations compared to untreated HFHSD-fed mice (Figure 3a; p = 0.080). On the other hand, after 12 weeks of HFHSD feeding, an interaction between the nutritional status and the treatment was found (Figure 3a, p = 0.027). Post-hoc analysis showed that P. faecium-treated mice had higher circulating PYY levels after intralipid administration compared to untreated mice (Figure 3a, p = 0.032). Additionally, intralipid administration induced PYY secretion in CD-fed mice and P. faecium-treated mice, not in untreated mice, when compared to fasting levels (Figure 3a: Fasting vs Intralipid, p = 0.012 for CD-Veh and p = 0.006 for HFHSD-P. fae), highlighting a benefit of P. faecium in maintaining proper gut hormone responses in the context of prolonged HFHSD feeding.
*P. faecium increases PYY levels and the number of PYY-producing cells after an intralipid oral load in diet-induced obese mice, and requires PYY to suppress food intake. In mice fed CD or HFHSD treated with Veh or with P. fae, we measured PYY levels in plasma at fasting and 20 min after an oral load of intralipid 20% at the beginning of dark phase after 4 and 12 (a) weeks of the intervention. (b) 24 h-FI 1 h after intraperitoneal administration of PYY antibody after 4 weeks of intervention. (c) Gene expression of Pyy, Neurod1 and Nng3 in ileum and colon (d) Quantification of PYY-positive cells in colon and representative bright field images of PYY immunohistochemical staining at 40 × magnification (scale bar = 20 μm). Abbreviations: F: fasting; FI: food intake; HFHSD: high-fat, high-sugar diet; IL: 20 min after intralipid; P. fae: Phascolarctobacterium faecium; Veh: vehicle; w- week. CD-Veh n = 7−10 and HFHSD-Veh/P. fae n = 8-10 per group. Measurements were excluded due to invalid values in Figure 3a (PYY levels—3 and 1 data points excluded from CD/HFHSD-veh, respectively, due to levels below the detection range), Figure 3b (FI—3 and 1 data points after saline or PYY antibody injections, respectively, from HFHSD-Veh and HFHSD-P. fae), Figure 3c (gene expression values—3 data points in the ileum and 2 data points in the colon due to insufficient RNA material). Data shown as mean ± SEM. Two-way ANOVA followed by Tukey´s post-hoc test (a and b); One-way ANOVA followed by Tukey´s post-hoc test (c); Student´s t-test (d). Significant effects at #p < 0.05 versus CD-Veh group and *p < 0.05 and *p < 0.01. See also Figure S2.
As these data further support that P. faecium enhances PYY secretion in DIO mice over both short and long durations, we next investigated whether blocking PYY could reverse the food intake-suppressing effects of P. faecium. We first tested the effectiveness of PYY immunoneutralization by intraperitoneally injecting an IgG antibody against PYY and measuring food intake. In a dose-response experiment, we found that HFHSD-fed mice pretreated with a 10 × concentration of anti-PYY antibody, but not a 100 × concentration, showed a significant increase in 12-hour food intake in the dark phase compared with control mice receiving saline (Figure S2b). Furthermore, in a subsequent 4-week preliminary experiment to confirm antibody efficacy, we found that a 10 × dose of the anti-PYY antibody significantly attenuated the reduction in food intake caused by exogenous PYY administration in HFHSD-fed mice (Figure S2c). Based on these findings, we then measured food intake after 4 weeks of HFHSD feeding in both untreated and P. faecium-treated mice that received a 10 × dose of the anti-PYY antibody. Consistent with earlier results (Figure 1c), P. faecium administration decreased food intake in HFHSD-fed mice receiving saline compared with untreated HFHSD-fed mice (Figure 3b, p = 0.051). However, this reduction in food intake was not observed when mice were administered simultaneously the PYY antibody (Figure 3b).
To elucidate whether P. faecium also affects PYY production in the gut, we first examined ileal and colonic gene expression of Pyy and the transcription factors Neurod1 and Neurogenin 3, which play essential roles in the development and differentiation of EECs. In the colon, transcript levels of Pyy were elevated in untreated HFHSD-fed mice (Figure 3c: CD-Veh vs HFHSD-Veh, p < 0.001), and P. faecium restored these levels to those of CD-fed mice (Figure 3c: HFHSD-Veh vs HFHSD-P. fae, p = 0.019). No significant differences were detected in the expression of transcription factors in the colon; likewise, these genes remained unaffected by either the HFHSD or the bacterial treatment in the ileum (Figure 3c).
Finally, immunohistochemical analysis of the colon revealed that the density of PYY-positive cells per unit of mucosal area was significantly greater in P. faecium-treated mice than in untreated mice on HFHSD (Figure 3d, p = 0.027). This apparent divergence between Pyy mRNA expression and PYY protein levels is biologically plausible as additional post-transcriptional and post-secretory regulatory processes may occur. All in all, our results indicate that P. faecium increases both the number of PYY-producing EECs and the secretion of PYY, and this PYY hypersecretion is likely required for reducing food intake in DIO mice treated with P. faecium.
P. faecium drives changes in gut microbiota composition and derived metabolites
We next analyzed cecal contents for PYY secretagogues such as BAs, SCFAs and their branched forms (BCFAs), and BCAAs, associated with protein-induced anorexigenic hormone secretion58^,^59. Among all BAs analyzed (Figure 4a and S3a), we found that the concentrations of the secondary BA ωMCA and its taurine-conjugated form TωMCA, as well as the primary BAs αMCA and βMCA, were significantly higher in the cecum of untreated HFHSD-fed mice than in CD-fed mice (Figure 4a, ωMCA p = 0.017; TωMCA p = 0.006; αMCA p = 0.010; βMCA p = 0.029). Notably, P. faecium administration completely restored the levels of TωMCA and ωMCA to those observed in CD-fed mice (HFHSD-Veh vs HFHSD-P. fae, p = 0.013 for TωMCA and p = 0.048 for ωMCA), whereas the levels of αMCA and βMCA were only partially normalized and were not significantly different to those in untreated HFHSD-fed mice (Figure 4a).
*P. faecium increases the cecal levels of branched-chain amino acids, which act as PYY secretagogues in SCT-1 neuroendocrine cells. Levels of (a) bile acids, (b) SCFAs and (c) BCAAs in the cecum content of mice fed CD or HFHSD treated with Veh or with P. fae, after 12 weeks of intervention. (d) Percentage of PYY secretion in vitro by STC-1 cells incubated with PBS (control conditions), P. fae or BCAAs. Abbreviations: αMCA: α-muricholic acid; βMCA: β-muricholic acid, ωMCA: ω-muricholic acid; BCAAs: branched-chain amino acids; CD: control diet; HFHSD: high-fat, high-sugar diet; Ile: isoleucine; Leu: leucine; Val: valine; P. fae: Phascolarctobacterium faecium; SCFAs: short-chain fatty acids; TωMCA: tauro-ω-muricholic acid; Veh: vehicle. a−c: CD-Veh n = 9-10, HFHSD-Veh n = 8−10 and HFHSD-P. fae n = 9; d: n = 4 for all conditions, except Leu (n = 3) and Ile (n = 5). Measurements were excluded due to invalid values in Figure 4a (bile acids—1 data point excluded from CD-Veh and HFHSD-P. fae and 2 data points excluded from HFHSD-Veh, due to levels below the detection range), Figure 4b and 4c (SCFAs and BCAAs –1 data point from HFHSD-P. fae due to levels below the detection range). Data shown as mean ± SEM. One-way ANOVA followed by Tukey’s post-hoc test (a−c); Student’s t-test (d) Significant effects at *p < 0.05, **p < 0.01 and **p < 0.001 and #p < 0.05, ##p < 0.01 and ###p < 0.001 versus CD-Veh group in (a−c); #p < 0.05 versus control (PBS) in (d). See also Figure S3.
Analysis of SCFAs (Figure 4b and S3b) revealed that the level of the BCFA isovalerate was significantly higher in P. faecium-treated HFHSD-fed mice than in untreated mice fed either HFHSD or CD (Figure 4b: vs CD-Veh, p < 0.001 and vs HFHSD-Veh, p = 0.002). Similarly, acetate levels were higher in P. faecium-treated mice than in CD-fed mice (Figure 4b: vs CD-Veh, p = 0.003), but this difference was statistically significant only when the HFHSD-fed groups were compared (Student’s t-test, p = 0.040) (Figure 4b). By contrast, heptanoate levels were significantly lower in untreated HFHSD-fed mice than in CD-fed mice (Figure 4b, p = 0.045), but this decrease was not observed in mice treated with the bacterium (Figure 4b). Assessment of BCAAs demonstrated that P. faecium-treated mice had higher cecal concentrations of valine, leucine and isoleucine than untreated mice fed either HFHSD or CD (Figure 4c).
To explore whether P. faecium affects PYY secretion via metabolites, we conducted in vitro experiments using the murine EEC line STC-1. For these experiments, we selected BCAAs as the most probable candidates involved, because their levels were increased by P. faecium administration. We also hypothesized that, in P. faecium-treated mice, BAs changes were less relevant to PYY secretion, as the bacterium reduced, rather than increased, their levels. These levels were enhanced in untreated HFHSD-fed mice and their reduction induced by P. faecium treatment was probably a consequence of the decreased lipid intake attributed to the bacterium.
Incubating the murine EEC line STC-1 with the BCAAs valine, leucine, or isoleucine increased PYY secretion over control conditions (Figure 4d: Control vs valine, p = 0.017; vs leucine, p = 0.002; vs isoleucine p = 0.005; and Figure S3c). Additionally, P. faecium itself enhanced PYY release by STC-1 cells compared with the control (Figure 4d, p = 0.051).
To understand how P. faecium treatment affected the gut microbiota, we analyzed alpha and beta diversity based on the 696 different operational taxonomic units (OTUs) identified. With regards to alpha diversity, we found no significant difference in richness between the study groups, as indicated by the Chao index (KW = 4.09, p < 0.390), which suggests no loss of bacterial species due to the treatments (Figure 5a). However, other alpha diversity measures including the reciprocal Simpson’s index, dominance and evenness, were significantly altered by P. faecium administration, suggesting shifts in the relative abundance of specific OTUs (the balance among species), partially counteracting the effects observed in HFHSD-fed mice and reaching values beyond those of the CD group (Figure 5a). With regards to beta diversity, multivariate analysis using the Bray-Curtis dissimilarity index and redundancy analysis (RDA) revealed a substantial shift in the microbial community structure due to the HFHSD feeding (Adonis = 9.66, p < 0.001) (Figure 5b). P. faecium did not reverse the HFHSD-induced gut microbiota changes back to the CD state, but instead generated a distinct microbiota structure (Figure 5b). When examining the effects on individual taxa, we found that approximately one-third of the OTUs detected showed differential abundance across all experimental groups (N = 209) (Supplementary_Data_1.xlsx). HFHSD-feeding led to a decrease in several OTUs belonging to the Muribaculaceae family, which are predominant in murids (top-half of heatmap in Figure 5c). This loss of commensal gut bacteria was not completely restored by P. faecium administration; however, P. faecium administration did reduce the abundance of Lachnospiraceae-enriched OTUs (also including some species of the families Ruminococcaceae, Oscillospiraceae, Eggerthellaceae and Erysipelotrichaceae) that were increased in untreated HFHSD-fed mice (bottom-half of heatmap in Figure 5c), bringing their levels closer to those observed in CD-fed mice. Compared with untreated CD- and HFHSD-fed mice, P. faecium-HFHSD-treated mice showed a significant increase in Lactobacillus spp. (OTU43, OTU104 OTU517, p = 0.031) and Akkermansia muciniphila (OTU197, p = 0.017) (Figure 5d). Both Lactobacillus and Akkermansia species showed slight, but significant positive correlations with cecal BCAA levels: specifically, OTU104, OTU517 and OTU197 with valine (Figure S4a), leucine (Figure S4b) and isoleucine (Figure S4c). Additionally, undefined species from the family Erysipelotrichaceae, such as OTU3, OTU94 and OTU595, were significantly increased by P. faecium administration (KW > 15.5, p < 0.005), and exhibited positive correlations with BCAA cecal levels (Kendall’s tau > 0.45, p < 0.001) (data not shown). In another study, P. faecium was detected in the cecal content of P. faecium-treated DIO mice, whereas it remained undetectable in vehicle-treated controls (data not shown).
P. faecium drives changes in gut microbiota composition. In mice fed CD or HFHSD treated with Veh or with P. fae, we assessed in feces: (a) Alpha diversity, including the observed OTUs, Simpson’s reciprocal index, Simpson’s evenness index, dominance index, and phylogenetic distance descriptors. (b) Beta diversity evaluation of microbial community structure using distance-based redundancy analysis (dbRDA). The two gradients of dataset dispersion in ordination space explaining more variation are shown in a scatter-plot fashion. (c) Scaled read counts for top differentially abundant OTUs (n = 209, chi-squared test ≥ 11.5, corrected p ≤ 0.01) across groups are shown as a heatmap. Clustering of OTUs was carried out using Euclidean distance and the “complete” clustering method. OTUs from major clusters were identified using SINA aligner. Heat scale is based on Z-scores resulting from rarefied read counts per OTU (raw scaling). A horizontal black line divides OTUs clustering into two major groups supporting the effect of HFHSD (top half) and of P. faecium (bottom half). (d) Distribution of clr-normalized DNA read counts for OTUs identified as Lactobacillus (OTU104, OTU43, OTU517) and Akkermanisa muciniphila (OTU197), n = 9−10 per group. Kruskal-Wallis (KW) test and pairwise comparisons with respective adjusted (FDR) p-values are indicated in each graph (a); Adonis test with centroids of data dispersion indicated with arrow heads (b); pairwise comparisons between groups and adjusted (FDR) p-values (d). CD/HFHSD-Veh n = 10 per group and HFHSD-P. fae n = 9 (1 data point was excluded due to invalid sample collection). Abbreviations: CD: control diet; clr: centered log-ratio; HFHSD: high-fat, high-sugar diet; P. fae: Phascolarctobacterium faecium; Veh: vehicle. See also Figure S4.
Altogether, these findings suggest that P. faecium supplementation promotes PYY secretion through several mechanisms: these likely include direct pathways involving P. faecium structural components and indirect pathways driven by the bacterium-induced gut microbiota and metabolite changes influencing BCAAs signaling.
The anorexigenic effects of P. faecium help prevent diet-induced obesity in mice
To assess how the anorexigenic effects of P. faecium contribute to the long-term attenuation of body weight gain and adiposity in DIO (Figure 1), we conducted a controlled feeding experiment in HFHSD-fed mice using untreated and P. faecium-treated ad libitum-fed groups and an untreated pair-fed group whose food intake was restricted to match the amount consumed by P. faecium-treated mice.
After 12 weeks of intervention, P. faecium treatment, but not pair-feeding, resulted in significantly decreased body weight gain when compared with untreated ad libitum-fed mice (Figure 6a and Table S2: HFHSD-Veh vs HFHSD-P. fae, p = 0.042 and HFHSD-Veh vs HFHSD-Veh pair fed, p = 0.198). We next questioned whether P. faecium administration influenced postprandial glucose homeostasis. Mice fed HFHSD showed higher glycemia and AUC during the OGTT compared to CD-fed mice, and neither the *P. faecium-*treated nor the pair-fed groups improved the OGTT (Figure 6b). Post-hoc analysis of the AUC neither revealed significant differences induced by P. faecium or pair-feeding compared to untreated HFHFSD ad libitum-fed mice. However, when analyzing only untreated (ad libitum-fed) and P. faecium-treated mice, P. faecium administration tended to decrease the AUC of the OGTT (Student’s t-test, p = 0.050), a result not seen when comparing ad libitum and pair-fed untreated groups (Student’s t-test, p = 0.810).
*The effect of P. faecium reducing food intake partially prevents body weight gain, postprandial hyperglycemia and adiposity in diet-induced obese mice. In mice fed CD or HFHSD treated with Veh (fed ad-libitum or pair-fed as P. fae-treated group) or treated with P. fae, we measured: (a) Bw follow-up and Bw gain. (b) glycemia after 0, 15, 30, 60, and 120 min of the OGTT (2 g/kg) after 4 h of fasting, and AUC at week 10 of the intervention. (c) Blood glucose levels in fasting and 20 min after an oral load of Intralipid 20% at week 10 of the intervention. (d) Weights of BAT, eWAT and subWAT normalized by body weight, after 12 weeks of intervention. (e) Frequency of adipocytes (diameters) in eWAT after 12 weeks of intervention in HFHSD-fed mice. (f) Quantification of individual adipocyte area in eWAT and (g) representative images of hematoxylin and eosin staining (scale bar = 50 μm, 16 × magnification). Abbreviations: CD: control diet, HFHSD: high-fat, high-sugar diet; Veh: vehicle; P. fae: Phascolarctobacterium faecium; Bw: Body weight; OGTT: oral glucose tolerance test; AUC: area under the curve; BAT: brown adipose tissue; eWAT: epididymal white adipose tissue; subWAT: subcutaneous white adipose tissue; F: fasting; IL: 20 min after intralipid. CD-Veh n = 10, HFHSD-Veh/P. fae n = 7−10 per group and HFHSD-Veh pair fed n = 9. Measurements were excluded due to invalid values in Figure 6a (Bw—1 data point excluded from HFHSD-Veh and HFHSD-VEH pair fed, due to stress signs), Figure 6b (OGTT—1 data point excluded from HFHSD-Veh and HFHSD-Veh pair fed and 3 data points from HFHSD-P. fae due to invalid glucose administration), Figure 6c (Glycemia - 1 data point excluded from HFHSD-P. fae and HFHSD-Veh pair fed due to invalid intralipid administration), and Figure 6d (adiposity - 1 data point excluded from CD-Veh and HFHSD-Veh pair fed due to invalid sample collection). Data shown as mean ± SEM. One-way ANOVA followed by Tukey’s post-hoc test (a [Bw gain], b [AUC], d, e [right graph], f); two-way ANOVA followed by Tukey’s post-hoc test (a [Bw follow-up] b, c and e). Significant effects at $$p < 0.01 and $$$p < 0.001 versus fasting conditions; ###p < 0.001 versus CD-Veh group; and p < 0.05. See also Figure S5a−f.
No differences in insulin levels were observed in fasting conditions or after 15 min of oral glucose administration across the three experimental groups fed HFHSD (Figure S5a). Likewise, glycemia was reduced 15 min after intraperitoneal insulin injection in all groups (Figure S5b). We also examined postprandial glycemia after oral administration of the 20% intralipid, a major component of the HFHSD. An interaction trend was observed between the prandial condition (fasting or intralipid) and the treatment groups (Figure 6c, p = 0.050). Post-hoc analysis revealed that, compared with fasting levels, glycemia increased 20 min after the oral intralipid load in untreated mice (CD-Veh, p = 0.006 and HFHSD-Veh, p < 0.001 and pair-fed, p < 0.001) but not in P. faecium-treated mice (Figure 6c). Additionally, fasting blood glucose levels were slightly reduced in P. faecium-treated and pair-fed groups, as these levels were only higher in HFHSD ad libitum-fed mice compared to CD-fed mice (Figure 6c, p = 0.035). Notably, after intralipid administration glycemia was lower in P. faecium-treated mice than in untreated mice fed a HFHSD ad libitum (Figure 6c, p = 0.004).
Analysis of WAT components revealed that the weight of eWAT and subWAT was significantly lower in P. faecium-treated mice than in untreated HFHSD ad libitum-fed mice, but not in pair-fed mice [Figure 6d and Table S2 (eWAT: HFHSD-Veh vs HFHSD-P. fae, p = 0.018 and HFHSD-Veh vs HFHSD-Veh pair fed, p = 0.301; subWAT: HFHSD-Veh vs HFHSD-P. fae, p = 0.031; HFHSD-Veh vs HFHSD-Veh pair fed, p = 0.235). The weight of BAT was not affected by either P. faecium treatment or pair-feeding (Figure 6d and Table S2). Analysis of adipocytes in hematoxylin-eosin stained eWAT, in HFHSD-fed groups, suggested a potential interaction between treatment groups and adipocyte size frequency (p = 0.080) (Figure 6e). Specifically, P. faecium treatment, but not pair-feeding, increased the frequency of smaller adipocytes (≤50 µm) compared with untreated ad libitum-fed mice (Figure 6e and 6g, p = 0.044). Furthermore, P. faecium-treated mice tended to have smaller adipocytes in eWAT than untreated ad libitum-fed mice (p = 0.090, Figure 6f), while this was not observed in pair-fed mice. In subWAT, neither the distribution of adipocyte sizes nor the average adipocyte size itself was significantly altered in either treatment group (Figure S5c-S5e). Gene expression analysis of molecular markers in subWAT revealed increased β-oxidation and reduced lipogenesis and thermogenesis in all HFHSD-fed groups compared to CD-fed mice, with no specific changes attributable to P. faecium or pair feeding (Figure S5f).
These findings again demonstrated that P. faecium-treated mice showed improved metabolic phenotype compared to untreated HFHSD ad libitum-fed mice. Nevertheless, pair-fed mice did not show significant differences compared to both untreated and P. faecium-treated mice fed ad libitum in the explored metabolic parameters. This suggests that the anorexigenic effect of P. faecium contributes to improved energy metabolism but is not the sole mechanism, as pair-fed mice showed an intermediate phenotype.
P. faecium accelerates gastrointestinal transit in diet-induced obese mice and reduces lipid absorption in colonocytes
Because the reduction in food intake alone did not fully explain how P. faecium prevented increased body weight and adiposity in response to HFHSD-feeding, we investigated other pathways involved in energy homeostasis, including thermogenesis and intestinal functions, such as gastrointestinal transit and lipid absorption.
Gene expression analysis of thermogenesis markers in subWAT revealed no significant alterations in response to the bacterium or pair-feeding (Figure S5f). However, citrate synthase activity, a proxy for mitochondrial density frequently employed to assess thermogenesis,60^,^61 was reduced in all HFHSD-fed groups compared to CD-fed mice (Figure 7a: vs HFHSD-Veh, p < 0.001,; vs HFHSD-P. fae, p = 0.003; vs HFHSD-Veh pair fed, p = 0.049). Pair-feeding increased the activity of this enzyme compared to untreated HFHSD ad libitum fed mice (Figure 7a, p = 0.008), while a tendency to increase this activity was observed due to P. faecium treatment (Figure 7a, p = 0.090).
*P. faecium accelerates clearance of non-esterified fatty acids in blood and gastrointestinal transit, and limits intestinal lipid absorption in vitro. In mice fed HFHSD treated with Veh (fed ad-libitum or pair-fed as P. fae-treated group) or treated with P. fae, we measured: (a) Citrate synthase activity in subWAT. (b) Plasma NEFAs and (c) TGs after an oral load of intralipid 20%. (d) Gastrointestinal transit time: time between oral gavage and first appearance of dye in feces in mice fed ad libitum. (e) Number of peripherin-positive neurons and protein expression of peripherin and GFAP in colonic CMMP whole-mount preparations (f) BODIPY C16 secreted into the basolateral compartment by Caco-2 cells at 4 h after addition of lipid micelles, and AUC. (g) BODIPY C16 uptake by Caco-2 cells at 240 min after addition of lipid micelles. Amount of BODIPY C16 is expressed as percentage (%) fluorescence relative to control (PBS). Abbreviations: HFHSD: high-fat, high-sugar diet; Veh: vehicle; CS: citrate synthase; CMMP: circular muscle myenteric plexus; NEFAs: non-esterified fatty acids; P. fae: Phascolarctobacterium faecium; TG: triglycerides; AUC: area under the curve; RFU: relative fluorescence units. a-d: CD-Veh, HFHSD-P. fae and HFHSD-Veh pair fed n = 8−10 per group and HFHSD-Veh n = 7-10; e: n = 6 per group; f: PBS n = 12 and P. fae n = 10; g: PBS n = 5 and P. fae n = 6. Measurements were excluded due to invalid values in Figure 7a (Citrate synthase activity—1 data point excluded from CD/HFHSD-Veh and HFHSD-P. fae and 2 data points from HFHSD-Veh pair fed due to values below the detection range), Figure 7b (NEFAs—1 data point from CD-Veh, 2 or 3, data points from HFHSD-Veh/P. fae, and 2 or 4 data points from HFHSD-Veh pair fed due to invalid blood collection), Figure 7c (TGs—2 data points from CD-Veh and HFHSD-P. fae, 1 or 3 data points from HFHSD-Veh and 1 or 2 data points from HFHSD-Veh pair fed, due to invalid blood collection), and Figure 7d (Gut transit—1 data point from CD/HFHSD-Veh and HFHSD-Veh pair fed, and 2 data points from HFHSD-P. fae due to inadequate carmine red administration). Data shown as mean ± SEM. One-way ANOVA followed by Tukey’s post-hoc test (a, d and right graphs in b and c); two-way ANOVA followed by Tukey’s post-hoc test (b, c and f); unpaired Student’s t-test (e, f [AUC] and g). Significant effects at $p < 0.05, $$p < 0.01 and $$$p < 0.001 versus previous time point: #p < 0.05, ##p < 0.01 and ###p < 0.001 versus CD-group; *p < 0.05 and **p < 0.001. Scale bar (50μm) is represented only in the first photograph. See also Figure S5g, S5h and S6.
To investigate the role of P. faecium in intestinal lipid absorption and clearance, we measured plasma levels of NEFAs and triglycerides in mice fed HFHSD for 12 weeks following an intralipid oral load.
Compared with fasting levels (0 min), only CD-fed mice showed a significant reduction of circulating NEFAs 20 min after intralipid administration (Figure 7b, p = 0.011), indicating functional inhibition of fasting-induced lipolysis after intralipid intake in the CD group but not in any of the HFHSD-fed groups. All groups exhibited an increase in plasma NEFA levels 120 minutes after intralipid administration (Figure 7b, 20 min vs 120 min: p = 0.068 for CD-Veh; p = 0.016 for HFHSD-Veh, p = 0.053 for HFHSD-P. fae; p = 0.004 for HFHSD-Veh pair fed), whereas only the CD-fed and P. faecium-treated groups exhibited a decrease in NEFAs after 240 minutes compared with their levels after 120 minutes (Figure 7b, 120 min vs 240 min: p < 0.001 for CD-Veh; p = 0.009 for HFHSD-P. fae). Moreover, statistical analysis revealed an interaction between time and treatment groups (p < 0.001), and post-hoc analysis further showed that P. faecium-treated mice exhibited reduced NEFA levels 240 minutes after the intralipid oral load compared with untreated mice fed ad libitum or pair-fed mice (Figure 7b, right graph: p = 0.053 vs HFHSD-Veh; p < 0.001 vs HFHSD-Veh pair fed). These findings suggest that P. faecium treatment facilitates a more rapid clearance of circulating postprandial NEFAs, independent of food intake.
Plasma triglyceride levels were increased in untreated mice ad libitum fed HFHSD and in pair-fed mice 120 minutes after intralipid administration compared with fasting levels (Figure 7c, 0 min vs 120 min: p = 0.026 for HFHSD-Veh; p < 0.001 for HFHSD-Veh pair fed), while no changes were detected in equivalent P. faecium-treated and CD-fed mice. In addition, compared to untreated HFHSD ad libitum fed mice, the P. faecium group showed a reduced rate of increase for triglycerides between 0 and 120 minutes (slope) compared to untreated HFHSD ad libitum-fed mice (Figure 7c, right graph: p = 0.029), supporting a reduced absorption. NEFAs and triglyceride plasma levels in response to intralipid administration were also measured after 4 weeks of HFHSD-feeding, but no significant differences were found between groups (Figure S5g and S5h).
Given the association of obesity with prolonged gastrointestinal transit time, which can lead to increased intestinal lipid absorption and subsequent body weight gain,62 we assessed gastrointestinal transit time after 7 weeks of HFHSD-feeding. Only untreated mice fed HFHSD ad libitum showed increased gastrointestinal transit time compared to CD-fed mice (Figure 7d, p = 0.035). In addition, P. faecium-treated mice exhibited a faster transit time compared with untreated mice fed HFHSD ad libitum or pair-fed (Figure 7d: HFHSD-Veh vs HFHSD-P. fae, p = 0.033; HFHSD-P. fae vs HFHSD-Veh pair fed, p = 0.027). This indicated that, independent of food intake, the bacterium accelerates gut transit, potentially influencing intestinal lipid absorption. Immunofluorescent analysis of the neuronal marker peripherin in colonic myenteric plexus, in untreated and P. faecium-treated HFHSD ad libitum fed mice, revealed that the bacterium increased the number of peripherin-positive cells (Figure 7e, p = 0.033) and tended to enhance peripherin expression (Figure 7e, p = 0.070). No significant changes were observed in the expression of the glial marker GFAP (Figure 7e). To note, we also found that, compared to CD, ad libitum HFHSD feeding led to a reduction in peripherin protein expression (Figure S6).
To investigate the impact of P. faecium on lipid absorption in the distal gut, we used Caco-2 cells cultured in Transwell plates and incubated with fluorescent fatty acid BODIPY™ FL C_16_. Compared with the control, pre-treatment with P. faecium (16 hours) resulted in significantly decreased secretion of BODIPY™ FL C_16_ into the basolateral compartment (Figure 7f: 15 min, p = 0.004; 120 min: p = 0.051; 240 min: p = 0.018), while the amount of non-absorbed BODIPY™ FL C_16_ in the apical compartment remained unaffected by the bacterium (not shown). BODIPY™ FL C_16_ cellular uptake showed a non-significant trend for increased uptake at 240 min in P. faecium-treated Caco-2 cells compared with the control (Figure 7g, Student’s t-test, p = 0.080).
Overall, our data suggest potential mechanisms by which P. faecium may attenuate DIO independently of its effects on food intake. These mechanisms include accelerated gastrointestinal transit —likely mediated through protection of the enteric nervous system— along with improved lipid clearance, which could contribute to limiting fat accumulation.
Discussion
This study reveals how commensal gut bacteria may protect against obesity by interacting with the enteroendocrine system and intestinal transit. Specifically, P. faecium provides metabolic benefits by suppressing appetite via increased PYY secretion in early-stage DIO in mice. Furthermore, P. faecium influences intestinal functions that help alleviate obesity, including accelerating intestinal transit and limiting intestinal lipid absorption, leading to enhanced postprandial lipid clearance.
Our study provides strong evidence that P. faecium has appetite-suppressing effects in DIO mice, highlighting its potential for obesity management. We demonstrate that P. faecium prevents hyperphagia in DIO mice, associated with increased plasma levels of the anorexigenic hormone PYY and a greater number of PYY-producing cells in the colon. These findings align with other research supporting the role of gut bacteria in obesity treatment; for example, preclinical and clinical studies have shown that the commensal intestinal bacterium Hafnia alvei 4597 can aid in weight management due to the anorexigenic effects of its heat shock protein ClpB, an antigen-mimetic of α-MSH.63^,^64Other studies have identified intestinal bacteria with PYY secretagogue capacity.65-67 For instance, Liang et al. reported that oral supplementation with Ligilactobacillus salivarius LCK11 increased intestinal and plasma PYY levels in mice after 8 weeks.67 However, the direct causal link between that bacterium and obesity has yet to be definitively established using loss-of-function models.
Oral administration of P. faecium increased the plasma levels of PYY but not GLP-1. The elevated plasma levels of PYY, observed from the early stages of obesity development through the end of the intervention, strongly suggest a primary role of PYY in the ability of P. faecium to modulate food intake. Consistent with preventing hyperphagia, P. faecium appeared to restore hypothalamic control of food intake. This was evidenced by the fact that P. faecium-treated mice did not overexpress the anorexigenic neuropeptide POMC, a compensatory mechanism seen in untreated obese mice in response to excessive energy intake. Our findings indicate that early hypersecretion of PYY explains the anorexigenic effects of the bacterium, as immunoneutralization of PYY after 4 weeks of treatment blunted the food intake-suppressing effect of the bacterium. Furthermore, P. faecium only suppressed food intake during the dark phase, aligning with our observation that PYY secretion in response to lipid intake occurs specifically during this period. P. faecium was administered immediately prior to the onset of the active phase, suggesting that its effect on reducing food intake may be transient. Nevertheless, further studies are warranted to determine whether the anorexigenic properties of this bacterium depend on the timing of administration.
Additionally, the finding that the anorexigenic effects of P. faecium occur during the active period in rodents suggests that it may require active food consumption. This could enhance the intestinal availability of dietary and/or microbial molecules to activate gut-to-brain nutrient sensing, in line with the bacterial growth dynamic-based model of appetite control.35^,^68 Although we did not specifically explore light/dark variations in intestinal metabolites, we did find increased levels of the BCAAs valine, leucine, and isoleucine in the cecum of P. faecium-treated mice. This increase could stem from the ability of P. faecium to shape the gut microbiota by decreasing the population of bacterial species involved in BCAA uptake and degradation,69-71 while simultaneously increasing those involved in de novo BCAA biosynthesis.69^,^70 Indeed, we found a higher abundance of Akkermansia muciniphila in P. faecium-treated mice, a bacterium known to synthesize BCAAs from glucose,72 and which showed a positive correlation with cecal BCAAs levels. While BCAAs have been associated with insulin resistance, glucose intolerance and obesity,70^,^73-78 other studies have demonstrated metabolic benefits. For instance, isoleucine reduced postprandial glycemia in rats,79^,^80 and leucine and isoleucine supplementation reduced body weight gain and fat mass in DIO mice.81-83 Our mechanistic studies using STC-1 neuroendocrine cells suggest that the increase in PYY release may be mediated by a BCAA-dependent pathway, as these metabolites can act as PYY secretagogues. In line with our findings, Genton et al. reported that 4-month oral supplementation with valine, leucine and isoleucine increased plasma PYY levels in patients with chronic kidney disease,59 a frequent complication of type 2 diabetes.84
P. faecium could also be the direct mediator of the PYY increase, as we found that it stimulates PYY secretion by SCT-1 cells. Similar in vitro studies have demonstrated the PYY secretagogue properties of Ligilactobacillus salivarius LCK11, mediated by the ability of its peptidoglycan to activate TLR2/NF-κB signaling.67 Given the expression of TLRs in EECs32^,^33^,^67 and their role in promoting Pyy gene expression in L cells,85 TLR ligands could mediate the effects of P. faecium on the enteroendocrine system to boost PYY release. Notably, P. faecium prevented exacerbated energy intake from the early stages of HFHSD feeding, indicating that modulating feeding behavior is a key mechanism through which the bacterium prevents metabolic alterations. Indeed, body weight changes and plasma levels of triglycerides and cholesterol improved after only 4 weeks of treatment.
We investigated whether the ability of the bacterium to regulate food intake contributes to obesity prevention by conducting a pair-feeding experiment. Pair-fed and P. faecium-treated mice showed similar decreases in body weight, adiposity and postprandial glycemia. These similarities are particularly evident for body weight, suggesting that the bacterium ´ s effect in attenuating body weight gain in DIO is influenced, at least in part, by food intake. The limitations inherent of the pair-feeding paradigm, including altered feeding behavior and hormonal secretion caused by food restriction, might mask the precise contribution of food intake to the effects of P. faecium on energy homeostasis.
Pair-feeding did not fully replicate the improved metabolic phenotype induced by P. faecium. In contrast to P. faecium treatment, there were no significant differences between pair-fed and untreated ad libitum-fed mice in body weight gain, fat depot weight, number of small adipocytes in eWAT, and glycemia in response to lipid intake. Therefore, we hypothesize that P. faecium also triggers food intake-independent mechanisms that collectively contribute to its metabolic benefits.
We next investigated additional mechanisms that could mediate the observed metabolic improvement, specifically examining effects on gastrointestinal transit and lipid absorption. Gastrointestinal motility is often impaired in obesity, characterized by delayed transit and reduced peristalsis due to the reduction of enteric neurons induced by hypercaloric diets, 86^,^87 leading to a longer timeframe for nutrient absorption and body weight gain.62^,^88-90 The pair-feeding protocol indicated that, independent of lower food intake, P. faecium accelerated gastrointestinal transit, probably due to its effect increasing the enteric neurons density in the circular muscle myenteric plexus in colon. This may accelerate the movement of nutrients through the intestine, resulting in a greater quantity of unabsorbed dietary products reaching the colon. This could represent a source of BCAAs that, together with BCAAs synthesized de novo by gut bacteria, could contribute to a greater BCAA pool to subsequently stimulate PYY secretion.
Irrespective of food intake, the ability of P. faecium to accelerate gastrointestinal transit could limit intestinal lipid absorption, thereby helping to prevent increased fat storage. Consistent with this, both 4 and 12 weeks of P. faecium supplementation reduced the weight of subWAT. The 12-week supplementation also resulted in lower eWAT weight and a higher frequency of smaller adipocytes. Furthermore, P. faecium prevented, albeit modestly, the 120 minutes postprandial triglyceride peak seen in untreated DIO mice after intralipid administration, suggesting lower intestinal lipid absorption. P. faecium also induced earlier clearance of postprandial NEFAs from blood 240 minutes after intralipid administration, indicating faster NEFA storage in adipose tissue. Considering the lower fat depot weights in P. faecium-treated mice, this quicker NEFA clearance appears to prevent the HFHSD-induced dyslipidemia without contributing to adiposity.
Assuming that accelerated gastrointestinal transit could increase the amount of unabsorbed lipids reaching the colon in mice treated with P. faecium, we investigated its effects on lipid absorption in the distal gut. Our in vitro experiments demonstrated that P. faecium enhanced cellular lipid uptake and utilization by colonocytes. Specifically, the bacterium prevented the crossing of lipids from the apical to basolateral sides of Caco-2 cells, thereby limiting lipid absorption and helping to prevent increased adiposity. Interestingly, some gut bacteria have been shown to promote lipid storage in enterocytes, restricting chylomicron secretion.91
The mechanism by which P. faecium modulates intestinal physiology to control energy homeostasis independently of food intake warrants further investigation. However, in light of our results, we can speculate that these effects can be partially driven by P. faecium-induced changes in the gut microbiota. These could reinforce the beneficial metabolic effects of P. faecium in DIO mice, thereby explaining part of the metabolic discrepancies between pair-fed mice and P. faecium-treated mice. Interactions through cross-feeding mechanisms between A. muciniphila and P. faecium are plausible since A. muciniphila is a succinate producer and P. faecium is a succinate consumer.92 Additionally, A. muciniphila grown in a mucin-supplemented medium has been shown to increase the production of leucine and valine,93 which could explain the observed increase in BCAAs in our study. These mechanisms could facilitate metabolic cooperation between P. faecium and A. muciniphila, ultimately influencing host energy homeostasis in P. faecium-treated mice. Additionally, P. faecium may directly impact gut physiology through either intestinal colonization or transient passage, as its presence was confirmed in the cecal content of treated DIO mice (unpublished data).
Overall, our preclinical findings suggest that the anorexigenic effects of P. faecium, mediated by PYY hypersecretion, contribute to improved body weight control in diet-induced obese mice. The ability of the bacterium to also accelerate gastrointestinal transit time and reduce fat absorption further supports its contribution to a healthier metabolic profile. Consequently, our findings could potentially inform the future development of new therapies aimed at modulating food intake and eating behavior (major contributors to obesity), as well as intestinal transit and fat absorption. However, the translational potential should be interpreted cautiously, considering the inherent limitations of the present study model, which does not replicate the complexity of the human gut microbiota and human physiology, and the need to establishing clinically relevant dose equivalence, and assessing possible colonization or persistency of the bacterium in the intestine.
Supplementary Material
Supplementary materialSupplementary_Data_1.
Supplementary materialSupplementary_Data_2.
Supplementary materialSupplemental_material_clean.docx
The reference list from the paper itself. Each links out to its DOI / PubMed record.
- 1Obesity and overweight. 2024. https://www.who.int/news-room/fact-sheets/detail/obesity-and-overweight.
- 2NCD Risk Factor Collaboration (NCD-Ris C) Trends in adult body-mass index in 200 countries from 1975 to 2014: a pooled analysis of 1698 population-based measurement studies with 19·2 million participants. Lancet. 2016;387(10026):1377–1396. doi: 10.1016/S 0140-6736(16)30054-X.27115820 PMC 7615134 · doi ↗ · pubmed ↗
- 3Ahima RS, Saper CB, Flier JS, Elmquist JK. Leptin regulation of neuroendocrine systems. Front Neuroendocrinol. 2000;21(3):263–307. doi: 10.1006/frne.2000.0197.10882542 · doi ↗ · pubmed ↗
- 4Briggs DI, Enriori PJ, Lemus MB, Cowley MA, Andrews ZB. Diet-induced obesity causes ghrelin resistance in Arcuate NPY/Ag RP Neurons. Endocrinology. 2010;151(10):4745–4755. doi: 10.1210/en.2010-0556.20826561 · doi ↗ · pubmed ↗
- 5Colley DL, Castonguay TW. Effects of sugar solutions on hypothalamic appetite regulation. Physiol Behav. 2015;139:202–209. doi: 10.1016/j.physbeh.2014.11.025.25449399 · doi ↗ · pubmed ↗
- 6Loh K, Zhang L, Brandon A, Wang Q, Begg D, Qi Y, Fu M, Kulkarni R, Teo J, Baldock P, Brüning JC, Cooney G, Neely G, Herzog H. Insulin controls food intake and energy balance via NPY neurons. Mol Metab. 2017;6(6):574–584. doi: 10.1016/j.molmet.2017.03.013.28580287 PMC 5444095 · doi ↗ · pubmed ↗
- 7Adamska-Patruno E, Ostrowska L, Goscik J, Fiedorczuk J, Moroz M, Kretowski A, Gorska M. The differences in postprandial serum concentrations of peptides that regulate satiety/hunger and metabolism after various meal intake, in men with normal vs. excessive BMI. Nutrients. 2019;11(3):493. doi: 10.3390/nu 11030493.30813625 PMC 6471764 · doi ↗ · pubmed ↗
- 8Blundell JE, Caudwell P, Gibbons C, Hopkins M, Näslund E, King NA, Finlayson G. Body composition and appetite: fat-free mass (but not fat mass or BMI) is positively associated with self-determined meal size and daily energy intake in humans. Brit J Nutr. 2012;107(3):445–449. doi: 10.1017/S 0007114511003138.21733267 · doi ↗ · pubmed ↗