Metabolic obesity phenotypes and risk of ischemic stroke: The Rural Chinese Cohort Study
Lu Cao, Lin Zhu, Wei Zhang, Ming Zhang, Dongsheng Hu, Que Wang

TL;DR
This study found that certain obesity-related metabolic profiles increase the risk of ischemic stroke in a rural Chinese population.
Contribution
The study identifies metabolically unhealthy normal weight and obesity as significant risk factors for ischemic stroke in a rural Chinese cohort.
Findings
Metabolically unhealthy normal weight (MUNW) and metabolically unhealthy obesity (MUO) are associated with increased ischemic stroke risk.
Sensitivity analyses using abdominal obesity confirmed similar results as the main findings.
Over 40% of individuals with general obesity had 1 or 2 metabolic risk factors and higher stroke risk than metabolically healthy normal weight individuals.
Abstract
The association of metabolic obesity phenotypes and ischemic stroke remains controversial. We aimed to determine the risk of ischemic stroke according to metabolically healthy and obesity status. A total of 14,707 study participants from The Rural Chinese Cohort Study (RCCS) who were free of stroke and cardiovascular disease (CVD) were stratified by metabolic risk and body mass index (BMI) status at baseline during 2007–2008 and further followed up during 2013–2014. Hazard ratio (HR) and 95% confidence intervals (CIs) of incident ischemic stroke associated with different metabolic-obesity categories were estimated by using Cox regression analysis. During a median follow-up of 6.02 years, we identified 522 newly diagnosed ischemic stroke cases. Risk of ischemic stroke was increased with MHO (HR: 1.87; 95%CI: 0.25–14.18), metabolically unhealthy normal weight (MUNW; HR: 2.36, 95%CI:…
Genes, proteins, chemicals, diseases, species, mutations and cell lines named across the full text — each resolved to its canonical identifier and authoritative record.
Click any figure to enlarge with its caption.
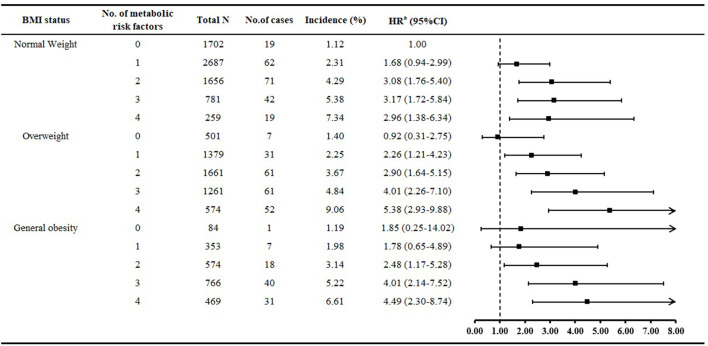 Figure 1
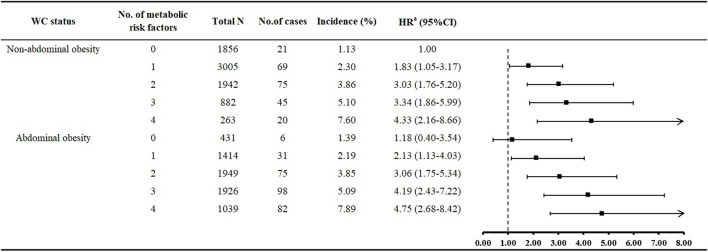 Figure 2
|
|
|
|---|---|
| Metabolically unhealthy: Meeting 1–4 of MetS criteria indicated above (WC excluded) | |
| Obesity status [According to BMI based on Chinese criteria ( | 1. |
|
| |
| 1. Metabolically healthy normal weight (MHNW): normal weight with 0 MetS criteria (WC excluded) | |
| 2. Metabolically healthy overweight (MHOW): overweight with 0 MetS criteria (WC excluded) | |
| 3. Metabolically healthy obesity (MHO): general obesity with 0 MetS criteria (WC excluded) | |
| 4. Metabolically unhealthy normal weight (MUNW): normal weight with 1–4 MetS criteria (WC excluded) | |
| 5. Metabolically unhealthy overweight (MUOW): overweight with 1–4 MetS criteria (WC excluded) | |
| 6. Metabolically unhealthy obesity (MUO): general obesity with 1–4 MetS criteria (WC excluded) | |
|
|
|
|
| ||||
|---|---|---|---|---|---|---|---|
| Age, years | 45.4 (13.3) | 46.4 (10.5) | 45.7 (9.8) | 50.7 (13.8) | 50.9 (11.7) | 50.5 (11.1) | < 0.001 |
| Men | 962 (56.5) | 222 (44.3) | 27 (32.1) | 2,176 (40.4) | 1,645 (33.7) | 561 (25.9) | < 0.001 |
| Married | 1,534 (90.1) | 478 (95.4) | 78 (92.9) | 4,788 (88.9) | 4,510 (92.5) | 2,018 (93.3) | < 0.001 |
| High school or above | 237 (13.9) | 58 (11.6) | 8 (9.5) | 585 (10.9) | 487 (10.0) | 196 (9.1) | < 0.001 |
| Monthly income >500 Yuan | 140 (8.2) | 31 (6.2) | 4 (4.8) | 336 (6.2) | 328 (6.7) | 158 (7.3) | 0.179 |
| Smoking | 709 (41.7) | 165 (32.9) | 17 (20.2) | 1,559 (29.0) | 1,146 (23.5) | 394 (18.2) | < 0.001 |
| Alcohol drinking | 315 (18.5) | 89 (17.8) | 9 (10.7) | 554 (10.3) | 549 (11.3) | 226 (10.5) | < 0.001 |
| Tea consumption | 369 (21.7) | 99 (19.8) | 25 (29.8) | 952 (17.7) | 948 (19.4) | 398 (18.4) | 0.001 |
| Physical activity | < 0.001 | ||||||
| Low | 396 (23.3) | 116 (23.2) | 24 (28.6) | 1,614 (30.0) | 1,479 (30.3) | 763 (35.3) | |
| Moderate | 339 (19.9) | 82 (16.4) | 17 (20.2) | 1,131 (21.0) | 1,135 (23.3) | 527 (24.4) | |
| High | 967 (56.8) | 303 (60.5) | 43 (51.2) | 2,638 (49.0) | 2,261 (46.4) | 872 (40.3) | |
| Family history of stroke | 188 (11.0) | 70 (14.0) | 6 (7.1) | 687 (12.8) | 783 (16.1) | 299 (13.8) | < 0.001 |
| Sleep duration, h | 8.5 (1.5) | 8.4 (1.3) | 8.2 (1.4) | 8.6 (1.6) | 8.7 (1.6) | 8.7 (1.6) | < 0.001 |
| BMI, kg/m2 | 21.3 (1.5) | 25.5 (1.1) | 29.7 (1.8) | 21.8 (1.4) | 25.8 (1.1) | 30.3 (2.1) | < 0.001 |
| WC, cm | 74.1 (5.7) | 84.8 (6.1) | 93.6 (7.2) | 76.3 (6.1) | 86.8 (6.2) | 96.9 (7.3) | < 0.001 |
| RHR, beats/min | 72.9 (10.6) | 72.2 (9.4) | 73.6 (7.9) | 75.1 (11.1) | 75.1 (10.4) | 75.9 (9.8) | < 0.001 |
| SBP, mmHg | 111.8 (9.5) | 114.2 (8.7) | 116.4 (7.8) | 124.0 (20.0) | 129.1 (19.9) | 134.5 (21.1) | < 0.001 |
| DBP, mmHg | 70.1 (6.8) | 73.1 (6.2) | 75.5 (5.2) | 76.6 (10.9) | 81.1 (10.7) | 85.7 (11.4) | < 0.001 |
| FPG, mmol/L | 5.0 (0.4) | 5.0 (0.4) | 5.1 (0.4) | 5.6 (1.4) | 5.8 (1.6) | 6.0 (1.7) | < 0.001 |
| TC, mmol/L | 4.2 (0.7) | 4.4 (0.8) | 4.5 (0.7) | 4.3 (0.9) | 4.6 (1.0) | 4.7 (0.9) | < 0.001 |
| TG, mmol/L | 1.0 (0.3) | 1.0 (0.3) | 1.1 (0.3) | 1.5 (0.9) | 2.0 (1.3) | 2.2 (1.4) | < 0.001 |
| HDL-C, mmol/L | 1.4 (0.2) | 1.4 (0.2) | 1.4 (0.2) | 1.1 (0.2) | 1.1 (0.2) | 1.1 (0.2) | < 0.001 |
| LDL-C, mmol/L | 2.4 (0.7) | 2.6 (0.7) | 2.7 (0.7) | 2.5 (0.7) | 2.7 (0.8) | 2.7 (0.8) | < 0.001 |
|
|
|
|
|
|
|
|---|---|---|---|---|---|
| Metabolically healthy | Normal weight | 19 | 1.12 | 1.00 | 1.00 |
| Overweight | 7 | 1.40 | 1.42 (0.60–3.39) | 0.92 (0.31–2.77) | |
| General obesity | 1 | 1.19 | 1.36 (0.18–10.20) | 1.87 (0.25–14.18) | |
| Metabolically unhealthy | Normal weight | 194 | 3.60 | 2.49 (1.55–4.01) | 2.36 (1.40–3.98) |
| Overweight | 205 | 4.21 | 3.28 (2.04–5.27) | 3.23 (1.92–5.43) | |
| General obesity | 96 | 4.44 | 3.73 (2.27–6.14) | 3.22 (1.84–5.62) |
|
|
|
|
|
|
|
|---|---|---|---|---|---|
| Metabolically healthy non-abdominal obesity | 1,856 | 21 | 1.13 | 1.00 | 1.00 |
| Metabolically healthy abdominal obesity | 431 | 6 | 1.39 | 1.42 (0.57–3.52) | 1.17 (0.39–3.51) |
| Metabolically unhealthy non-abdominal obesity | 6,092 | 209 | 3.43 | 2.47 (1.58–3.88) | 2.54 (1.54–4.20) |
| Metabolically unhealthy abdominal obesity | 6328 | 286 | 4.52 | 3.52 (2.23–5.53) | 3.37 (2.02–5.61) |
- —National Natural Science Foundation of China10.13039/501100001809
Peer Reviews
No public reviews on file for this paper yet. If you reviewed it on a platform where reviews are public (OpenReview, ICLR, NeurIPS, ICML), you can paste yours below so the community can read it here.
Videos
No videos yet. Explain this paper in a talk, walkthrough, or lecture? Add one.
Taxonomy
TopicsAcute Ischemic Stroke Management · Diabetes, Cardiovascular Risks, and Lipoproteins · Cardiovascular Disease and Adiposity
Introduction
Globally, stroke was the second-leading cause of death in 2023 (1). In 2019, China recorded 3.94 million new stroke cases, marking an 86.0% increase in the incidence rate since 1990 (2). With the aging of the population, the burden of stroke is expected to increase, and the morbidity associated with stroke will cause physical disability, with excessive medical resources used and increased healthcare costs.
Obesity, which is often accompanied by metabolic syndrome (MetS), is a modifiable risk factor of stroke (3, 4). A meta-analysis based on 1.8 million participants from 97 cohort studies found that 76% of the effect of body mass index (BMI) on risk of stroke was mediated by metabolic risk factors including blood pressure, glucose, and cholesterol levels (5). However, not all obese individuals exhibited MetS but had a healthy metabolic profile, called “metabolically healthy obesity” (MHO) (6). Correspondingly, a group of lean individuals tended to have a cluster of metabolic risk factors, called metabolically unhealthy normal weight (MUNW). Taking both MHO and MUNW phenotypes into consideration in clinical work and understanding their effect on stroke risk are necessary for stroke prevention and control.
Nevertheless, most previous studies focused on the association of MHO and cardiovascular disease (CVD), often considered coronary heart disease, heart failure, stroke, and CVD death together as the primary outcome, instead of examining stroke alone; thus, whether MHO is specifically associated with increased risk of stroke remains unclear (7). The Whitehall II cohort study reported that MHO individuals were at increased risk of stroke as compared with metabolically healthy normal weight (MHNW) individuals (8). However, data from US, Spanish and Korean populations showed conflicting results (9–11). Moreover, obesity usually begins with 1–2 MetS components, and non-obesity also seems to be accompanied by varying degrees of MetS, but few studies have investigated the influence of an accumulated number of metabolic risk factors on stroke risk across BMI status (12, 13).
Considering that the risks of ischemic stroke (accounts for 80% of stroke) among MHO and MUNO people were still not clear and studies focused on MHO–ischemic stroke association in Chinese population were limited (14, 15). Thus, we aimed to explore the association of MetS–BMI categories and the incidence of ischemic stroke in a rural Chinese population. As a secondary aim, we investigated the association of BMI status with different numbers of metabolic risk factors and risk of ischemic stroke.
Materials and methods
Study population
The Rural Chinese Cohort Study (RCCS) is a population-based prospective cohort study started during 2007 and 2008 with 20,194 participants randomly recruited from Xin'an county, Luoyang, Henan province, in the middle of China (16). The follow-up examination was conducted during 2013 and 2014. Detailed descriptions of the study design, study participants and data collection method were published previously (17). Briefly, participants aged ≥18 years who were free of severe psychological disorders, Alzheimer's disease, dementia, AIDs or other infectious diseases underwent questionnaire interview, anthropometric measurements, physical examination and laboratory measurements at both baseline and follow-up examinations. The study protocol was approved by the Medical Ethics Committee of Zhengzhou University, and all study participants gave their signed informed consent.
For the scope of the present study, we excluded participants who (1) had missing data on physical examination and anthropometric and laboratory measurements (N = 57) at baseline; (2) were underweight (BMI < 18.5 kg/m^2^; N = 709) at baseline; and (3) had history stroke and cardiovascular diseases (myocardial infarction and heart failure; N = 1,004) at baseline; (4) were lost to follow-up (N = 3,717). Finally, 14,707 eligible study participants were included to assess the association of metabolically healthy and obesity status and ischemic stroke risk.
Data collection
At both baseline and follow-up examinations, study participants completed a designed questionnaire asking about socio-demographic characteristics (age, sex, marital status, monthly income, and education level), lifestyle (smoking, alcohol drinking, tea consumption, physical activity, and sleep duration), family and individual history of diseases and medication history by face-to-face interviews. Smoking was defined as smoking at least 100 cigarettes during the lifetime and was classified as current/ever smokers and never smokers. Alcohol drinking was defined as consuming alcohol 12 or more times in the last year and was classified as current/ever drinkers and never drinkers. Participants who drank tea more than 3 times a week for 6 months were defined as tea drinkers (18). Physical activity was classified as low, moderate or high according to the International Physical Activity Questionnaire (IPAQ) (19). Sleep duration was defined as the total sleep duration in a day including day and night.
Participants were told to wear light clothing during anthropometric measurements. Weight, height and waist circumference (WC) were measured twice by well-trained investigators. Weight was measured to the nearest 0.5 kg on a vertical weight scale. Height was measured to the nearest 0.1 cm with participants standing erect in bare feet. With participants gently breathing, WC was measured at the mid-point between the lowest rib and the iliac crest to the nearest 0.1 cm. BMI was calculated as weight (kg) divided by height (m) squared. Blood pressure and resting heart rate were measured 3 times, at an interval of 30 s, with an electronic sphygmomanometer (HEM-770AFuzzy, Omron, Japan), and the average of measurements was used for systolic blood pressure (SBP) and diastolic blood pressure (DBP). Overnight fasting blood samples were collected for assessing levels of fasting plasma glucose (FPG), total cholesterol (TC), triglycerides (TG) and high-density lipoprotein cholesterol (HDL-C). Low-density lipoprotein cholesterol (LDL-C) was calculated by the Friedewald formula (20).
Definition of metabolically healthy and obesity status
Metabolically health status was based on MetS criteria (21). Considering that BMI was highly correlated with WC, most researchers suggest excluding WC among the MetS criteria when defining MHO according to the harmonized definition (21). Metabolically healthy was defined as having 0 of the 4 MetS criteria (blood pressure and FPG, TG and HDL-C). If participants had 1–4 of the MetS criteria, they were considered metabolically unhealthy. Obesity status was classified as normal weight (BMI 18.5–24 kg/m^2^), overweight (BMI 24–28 kg/m^2^) and general obesity (BMI ≥ 28 kg/m^2^) based on Chinese criteria (22). According to metabolically healthy and obesity status, 6 specific obesity phenotypes were further identified: metabolically healthy normal weight (MHNW), metabolically healthy overweight (MHOW), MHO, MUNW, metabolically unhealthy overweight (MUOW), and metabolically unhealthy obesity (MUO; Table 1).
Assessment of ischemic stroke
Participants were followed up for fatal and non-fatal ischemic stroke event during the follow-up examination. If participants reported they had stroke, investigators further confirmed the type of stroke by checking the medical records and certificates of diagnosis (CT or MRI scans) (23), or verified it with relatives and village physicians. Participants who failed to provide reliable certificates of diagnosis were considered as uncertain type of stroke and were excluded in current analyses. Fatal ischemic stroke was collected by cause-of-death surveillance system.
Statistical analysis
Baseline characteristics of the study participants are summarized as mean ± SD for continuous variables and number (percentage) for categorical variables. ANOVA test or chi-square test was used to test differences in baseline variables across 6 MetS–BMI categories. Cox regression analysis was used to calculate the hazard ratio (HR) and 95% confidence intervals (CIs) of incident ischemic stroke associated with different metabolically healthy and obesity status. We established 2 models to adjust for baseline confounding factors: (1) Model 1: age and sex; and (2) Model 2: age, sex, marital status, monthly income, education, smoking, alcohol drinking, tea consumption, physical activity, family history of stroke, resting heart rate, sleep duration, and LDL-C level. We further grouped participants according to the number of metabolic risk factors and obesity status, and considered MHNW as the reference.
To assess whether some traditional risk factors of stroke (age, sex, smoking, alcohol drinking, and physical activity) would influence the results, we further added the interaction terms of the 6 obesity phenotypes ^*^ risk factors to Model 2. To investigate the association of metabolically healthy and abdominal obesity status and incident ischemic stroke, we additionally used WC to define abdominal obesity according to Chinese criteria (24) instead of BMI and re-estimated the HRs for incident ischemic stroke associated with MetS–WC categories as a sensitivity analysis. The definition of MHO based on WC were presented in Supplementary Table 1.
All statistical analyses were performed with SAS v9.4 and all reported p values were 2-sided, with p < 0.05 considered statistically significant.
Results
Baseline characteristics
The prevalence of overweight and general obesity in metabolically healthy individuals was 21.9% and 3.7%, and in the metabolically unhealthy group was 39.3% and 17.4%. Among different MetS–BMI categories, significant differences were found in terms of age, sex, marital status, education level, smoking, alcohol drinking, tea consumption, physical activity, family history of stroke, and sleep duration (all p < 0.05; Table 2). Anthropometric and laboratory measurements including BMI, WC, resting heart rate, SBP, DBP, FPG, TC, TG, HDL-C, and LDL-C also showed significant differences across groups (all p < 0.05).
Obesity phenotype and incident ischemic stroke
During a median follow-up of 6.02 years, 522 newly diagnosed ischemic stroke cases occurred. Among metabolically healthy participants, the incidence of ischemic stroke was 1.12%, 1.40%, and 1.19% for MHNW, MHOW, and MHO groups, respectively (Table 3). In the metabolically unhealthy group, the incidence was 3.60%, 4.21%, and 4.44% for MUNW, MUOW, and MUO groups, respectively. Adjusted risk of ischemic stroke was increased with MUNW (HR: 2.36, 95%CI: 1.40–3.98), MUOW (HR: 3.23; 95%CI: 1.92–5.43), and MUO (HR: 3.22, 95%CI: 1.84–5.62) as compared with MHNW. No significant association was found between MHO and ischemic stroke (HR: 1.87; 95%CI: 0.25–14.18). On interaction analysis, the association of obesity phenotypes and ischemic stroke was not further modified by sex, age, smoking, alcohol drinking, and physical activity (all pinteraction > 0.05, data not shown).
Figure 1 shows that the incidence of ischemic stroke increased with increased number of metabolic risk factors. Overall, 41.3% of people with general obesity had 1 or 2 metabolic risk factors, and both groups showed greater risk of ischemic stroke than MHNW people. For overweight individuals, those with 1 or 2 metabolic risk factors, risk of ischemic stroke was 2.26- and 2.90-fold increased as compared with MHNW individuals. Risk of ischemic stroke was increased for normal-weight people with 2–4 metabolic risk factors than those with metabolically healthy status.
Multivariate relative risk of ischemic stroke associated with number of metabolic risk factors in different BMI groups. aAdjusted for age, sex, marital status, monthly income, education, smoking, alcohol drinking, tea consumption, physical activity, family history of stroke, resting heart rate, sleep duration, and low-density lipoprotein cholesterol.
Sensitivity analysis
When we used WC to define abdominal obesity, we found similar results as for the main analysis (Table 4). 6.4% abdominal obese people was in metabolically healthy condition. Adjusted risk of ischemic stroke was increased with metabolically healthy abdominal obesity vs. metabolically healthy non-abdominal obesity, however, this association was not statistically significant (HR: 1.17; 95%CI: 0.39–3.51). The risk of ischemic stroke was 2.54-fold increased with metabolically unhealthy but non-abdominal obesity (HR: 2.54, 95%CI: 1.54–4.20); and the highest risk was with metabolically unhealthy abdominal obesity (HR: 3.37, 95%CI: 2.02–5.61). Risk of ischemic stroke was significantly increased with non-abdominal obesity with accumulated number of MetS risk factors as compared with no metabolic risk factors (Figure 2). Except for no MetS risk factor, the risk of ischemic stroke was increased with abdominal obesity regardless of MetS risk-factor status.
Multivariate relative risk of ischemic stroke associated with number of metabolic risk factors in different waist circumference (WC) groups. aAdjusted for age, sex, marital status, monthly income, education, smoking, alcohol drinking, tea consumption, physical activity, family history of stroke, resting heart rate, sleep duration, and low-density lipoprotein cholesterol.
Discussion
In the present study, 15.3% of rural Chinese people had general obesity and 3.7% of these were “metabolically healthy”. We also observed a large proportion of the MUNW phenotype, which was a major risk factor for ischemic stroke, among normal-weight individuals (76.0%). Furthermore, although the lowest and highest risks of ischemic stroke were not always in people with 0 and 4 metabolic risk factors, respectively, our results suggest to some extent that excess metabolic risk factors is associated with increased risk of ischemic stroke regardless of obesity status. These findings were replicated when using WC to define abdominal obesity in a sensitivity analysis. Our findings indicated that weight loss programs should be emphasized for obese people regardless of their metabolically healthy status. Behavior modification and medical therapy aiming to control blood pressure, glucose and lipid profiles may have potential and efficient benefit for stroke prevention in normal-weight people.
Early and precise identification and modification of risk factors is imperative for stroke prevention (25, 26). Although epidemiological studies have identified a series of modifiable risk factors (smoking, obesity, hypertension, diabetes, and dyslipidemia) for stroke and targeted intervention programs have been implemented, the global burden of stroke is still high, with a large impact in developing countries (27). The subset of MHO phenotype has been identified, but the association of MHO and ischemic stroke was still not well documented and remained controversial (28). A recent meta-analysis based on 43 cohort studies reported a significant linear dose–response relation between BMI and CVD risk among metabolically healthy individuals (7). However, most studies considered stroke as one component of CVD events and did not further consider the association of MHO and different types of stroke (29–31). Results from the Atherosclerosis Risk in Communities study of 14,658 US people demonstrated that during a mean follow-up of 18.7 years, MHO individuals had the lowest risk of stroke (9). Similar results were found in Spanish and Korean studies (10, 11). In contrast, the Whitehall II cohort study first reported a positive association between MHO and stroke among 7,122 civil servants aged 39–63 years during a median follow-up of 17.4 years, but the findings may not generalize to a general population (8). Another large-scale cohort study of 3.5 million UK people with 5.4 years follow-up also showed MHO associated with a 1.07-fold risk of stroke as compared with MHNW (13). However, both studies did not distinguish the type of stroke.
A cross-sectional study aiming to explore the MHO–stroke association in a Chinese population reported that the prevalence of ischemic stroke was lowest with MHO (1.7%) but higher with MUNO (4.9%) and MUO (4.8%), and MHO was not significantly associated with ischemic stroke (32). Results from the Kailuan cohort reported a positive association between MUNW and stroke among occupational population; however, the association between MHO and stroke was not statistically significant (33). Similar results were also found in another Chinese cohort study, which was based on 34,294 community residents (15). Both aforementioned Chinese cohort studies did not distinguish the risk of ischemic stroke. Our study first generated this research question in a Chinese population by using a prospective cohort study design and reported both MUO and MUNW associated with increased risk of ischemic stroke. We also observed a positive but not significant association between MHO and ischemic stroke. The reason may due to the short-term follow-up or small proportion of the MHO phenotype. Further studies based on various populations are still needed to replicate our findings.
Additionally, most studies used BMI to define MHO because BMI is highly correlated with WC (21, 34). However, previous studies demonstrated that Asian populations tend to have lower BMI but higher WC as compared with Western populations because the body fat is commonly distributed in the abdominal cavity (35). Thus, metabolically healthy abdominal obesity may be more prevalent in Chinese populations. Therefore, we conducted a sensitivity analysis and found similar results as main analyses. Our findings implied that obesity or metabolically unhealthy status were associated with future development of ischemic stroke. MHO may not be a benign condition and should not be considered “healthy”. Management of weight and WC is recommended for MHO individuals in terms of stroke prevention.
Of note, the inconsistent aforementioned results may be related to several factors, such as the definition of MHO, different populations and follow-up times or other confounding factors. Particularly, the definition of MHO may be the major issue that leads to the controversial findings (36). Some investigators suggest that MHO should refer to obese people without any metabolic risk factors (21, 37); however, most studies commonly used the less strict MHO definitions: obese people with 1 or 2 MetS risk factors (7). Our study, using a strict criteria definition, found only 3.7% of obese individuals considered “metabolically healthy”. If using the Adult Treatment Panel-III (ATP-III) definition (38), with < 2 MetS risk factors considered metabolically healthy, more general obese participants would exhibit the MHO phenotype. In contrast, nearly three quarters of normal-weight people had varying degrees of metabolic abnormality. Thus, the impact of the number of metabolic risk factors on stroke risk should be clarified across different BMI status groups. A UK study reported increased risk of stroke with increased number of metabolic abnormalities in normal-weight, overweight, and general obese groups, which was in line with our study (13). In the present study, the incidence rate basically increased with increasing number of MetS risk factors and the HR increased accordingly regardless of obesity status defined by BMI or WC. Future studies using a strict definition of MHO are still needed to compare with our results.
Our study was based on a prospective cohort design with a large sample size and well-controlled covariates, which could provide high-quality and reliable evidence. Furthermore, although numerous studies emphasized the weakness of the MHO definitions [i.e. ATP III (38), Karelis and Rabasa-Lhoret (39), and Wildman et al. (40)] and recommended considering metabolically healthy strictly with 0 of the 4 MetS criteria (WC excluded), most previous studies still used a less reasonable definition. Our study chose a highly recognized definition of MHO and also estimated the influence of MetS risk factors and BMI combination on risk of ischemic stroke, which could provide more detailed evidence for stroke prevention.
However, our study has several limitations. First, the study was based on a rural Chinese population from one county in the middle of China, so the current results may not be generalized to other populations. Future studies are still needed to estimate the MHO–stroke association in multi-ethnic and multicenter populations. Second, MHO seems to be a transient status of MUO. Because we completed only one follow-up examination, we could not investigate whether dynamic metabolically healthy and obesity status were associated with risk of ischemic stroke. Third, although we built models to adjust confounding factors associated with stroke, there is still a possibility of residual confounding caused by other covariates, such as psychological factors, medication for diseases, and other unknown factors.
Conclusion
In conclusion, our data showed increased risk of incident ischemic stroke for MUNW and MUO individuals. An excess number of metabolic risk factors was positively associated with risk of ischemic stroke. The term MHO may not be suitable because of its related unhealthy outcome. The identification and management of MUNW phenotype may have potential clinical implications for future stroke prevention and control.
The reference list from the paper itself. Each links out to its DOI / PubMed record.
- 1Global Burden of Disease Study 2023. Global burden of 292 causes of death in 204 countries and territories and 660 subnational locations, 1990–2023: a systematic analysis for the Global Burden of Disease Study 2023. Lancet. (2025) 406:1811–72. doi: 10.1016/S 0140-6736(25)01917-841092928 PMC 12535838 · doi ↗ · pubmed ↗
- 2Ma Q Li R Wang L Yin P Wang Y Yan C . Temporal trend and attributable risk factors of stroke burden in China, 1990–2019: an analysis for the Global Burden of Disease Study 2019. Lancet Public Health. (2021) 6:e 897–906. doi: 10.1016/S 2468-2667(21)00228-034838196 PMC 9047702 · doi ↗ · pubmed ↗
- 3Boehme AK Esenwa C Elkind MS. Stroke risk factors, genetics, and prevention. Circ Res. (2017) 120:472–95. doi: 10.1161/CIRCRESAHA.116.30839828154098 PMC 5321635 · doi ↗ · pubmed ↗
- 4Liu X Zhang D Liu Y Sun X Hou Y Wang B . A J-shaped relation of BMI and stroke: systematic review and dose-response meta-analysis of 4.43 million participants. Nutr Metab Cardiovasc Dis. (2018) 28:1092–9. doi: 10.1016/j.numecd.2018.07.00430287124 · doi ↗ · pubmed ↗
- 5Global Global Burden of Metabolic Risk Factors for Chronic Diseases Collaboration Lu Y Hajifathalian K Ezzati M Woodward M Rimm EB . Metabolic mediators of the effects of body-mass index, overweight, and obesity on coronary heart disease and stroke: a pooled analysis of 97 prospective cohorts with 1.8 million participants. Lancet. (2014) 383:970–83. doi: 10.1016/S 0140-6736(13)61836-X 24269108 PMC 3959199 · doi ↗ · pubmed ↗
- 6Karelis AD. Metabolically healthy but obese individuals. Lancet. (2008) 372:1281–3. doi: 10.1016/S 0140-6736(08)61531-718929889 · doi ↗ · pubmed ↗
- 7Yeh TL Chen HH Tsai SY Lin CY Liu SJ Chien KL. The relationship between metabolically healthy obesity and the risk of cardiovascular disease: a systematic review and meta-analysis. J Clin Med. (2019) 8:1228. doi: 10.3390/jcm 808122831443279 PMC 6723711 · doi ↗ · pubmed ↗
- 8Hinnouho GM Czernichow S Dugravot A Nabi H Brunner EJ Kivimaki M . Metabolically healthy obesity and the risk of cardiovascular disease and type 2 diabetes: the Whitehall II cohort study. Eur Heart J. (2015) 36:551–9. doi: 10.1093/eurheartj/ehu 12324670711 PMC 4344958 · doi ↗ · pubmed ↗