Machine Learning Prediction of Analyte-Induced Fluorescence Perturbations in DNA-Functionalized Carbon Nanotubes
Sayantani Chakraborty, Andrew T. Krasley, Colby H. Smith, Abraham G. Beyene, Lela Vuković

TL;DR
This paper uses machine learning to predict how small molecules affect the fluorescence of DNA-functionalized carbon nanotubes, helping design better nanosensors.
Contribution
The study introduces ML models to predict analyte-induced fluorescence changes in DNA–SWCNT nanosensors using chemical features and cross-validation.
Findings
ML models achieved mean R² values of 0.2–0.4 and F1 scores of ∼0.8 for predicting fluorescence responses.
Cross-validation outperformed ensemble methods in predicting responses for a blind set of molecules.
ML captures structure–response patterns in small datasets, aiding nanosensor design.
Abstract
Single-walled carbon nanotubes (SWCNTs) functionalized with single-stranded DNAs can function as near-infrared nanosensors for molecular analytes. However, predicting which analytes elicit strong optical responses for specific nanosensors remains challenging. We developed machine learning (ML) models to predict analyte-induced fluorescence changes in a DNA–SWCNT dopamine nanosensor. Using a data set of 63 small molecules sampling chemical space around dopamine, we encoded analytes with RDKit fingerprints, with or without HOMO and LUMO energies, and applied principal component analysis to identify structural motifs associated with optical response strength. We trained support vector regression and classification models using two strategies: ensembles of 200 models and cross-validation. Regression models achieved mean R 2 values of 0.2–0.4, with cross-validation outperforming ensembles,…
Genes, proteins, chemicals, diseases, species, mutations and cell lines named across the full text — each resolved to its canonical identifier and authoritative record.
Click any figure to enlarge with its caption.
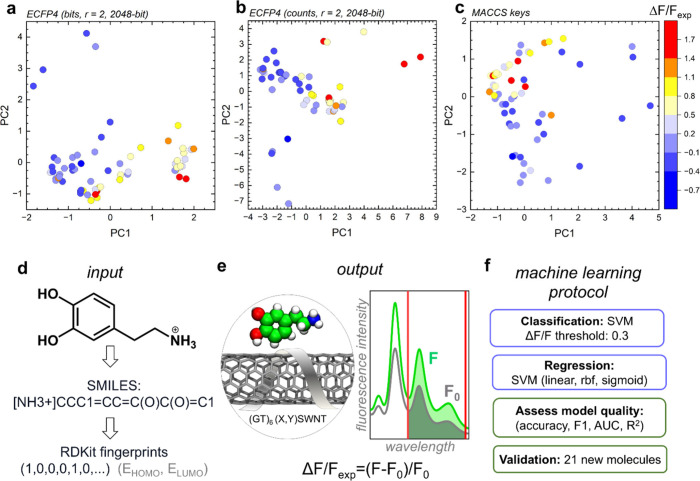 Figure 1
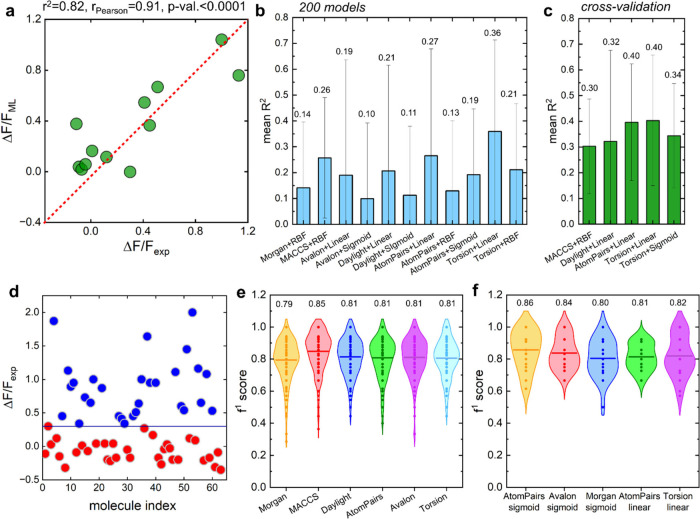 Figure 2
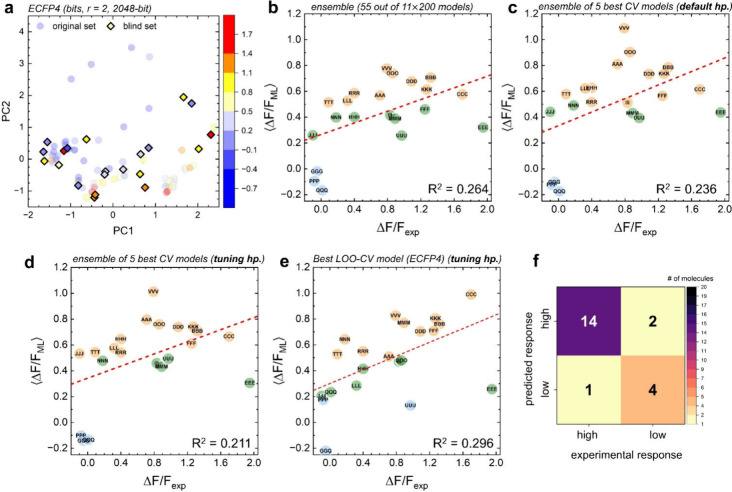 Figure 3
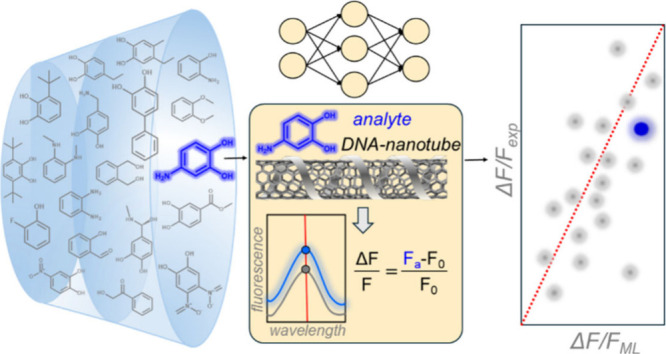 Figure 4
 Figure 5
- —Howard Hughes Medical Institute10.13039/100000011
- —Division of Chemical, Bioengineering, Environmental, and Transport Systems10.13039/100000146
Peer Reviews
No public reviews on file for this paper yet. If you reviewed it on a platform where reviews are public (OpenReview, ICLR, NeurIPS, ICML), you can paste yours below so the community can read it here.
Videos
No videos yet. Explain this paper in a talk, walkthrough, or lecture? Add one.
Taxonomy
TopicsCarbon Nanotubes in Composites · Advanced biosensing and bioanalysis techniques · Carbon and Quantum Dots Applications
Single-walled carbon nanotubes (SWCNTs) are unique nanomaterials with remarkable optical, electronic, and mechanical properties, enabling applications in biosensing, molecular imaging, drug delivery, and nanoelectronics. ?−? ? ? ? ? ? ? ? ? ? A critical step in harnessing these properties is functionalization, often achieved by noncovalent adsorption of polymers that form a corona phase around the nanotube. Such coatings solubilize and stabilize SWCNTs in aqueous environments, without impeding SWCNTs’ inherent near-infrared fluorescence, rendering them biocompatible and useful as reagents for biosensing. Among functionalization strategies, wrapping with single-stranded DNA (ssDNA) oligonucleotides has found widespread use, producing sensors with sequence-dependent specificity toward small molecules, ?−? ? nucleic acids,? and proteins. ?−? ? The optical response of ssDNA-wrapped SWCNTs is dictated by the interplay between the ssDNA sequence and target analyte. ?,?−? ? Despite their potential, identifying ssDNA sequences that simultaneously enable analyte recognition and elicit strong optical signals remains a bottleneck. Typical approaches rely on low-throughput experimental screening of ssDNA libraries, which have occasionally led to serendipitous discoveries of responsive sequences for analytes such as dopamine and norepinephrine. ?,? More systematic strategies such as SELEC (systematic evolution of ligands by exponential enrichment on carbon nanotubes) have expanded sequence discovery, ?,? but experimental screening of ssDNA–SWCNT responses remains constrained to modest throughput (tens to hundreds of conditions). ?,?,?
Recent studies have explored the use of machine learning (ML) models trained on small ssDNA–SWCNT data sets to predict ssDNA sequence motifs that recognize specific analytes. ?,?,?,? Such models have guided in silico sequence selection for analytes such as serotonin, reducing experimental effort while achieving success rates of 60–90% when predicting new DNA–SWCNT sensors with strong and weak responses to serotonin. ?,? These advances suggest that even modest data sets contain chemically meaningful signals that ML can exploit. However, whether ML can predict analyte-induced responses for a given ssDNA–SWCNT conjugate remains largely unexplored. Such a capability would help identify responsive analytes or potential interferents in complex biological environments.
In prior work, we constructed a data set of optical responses of (GT)6–SWCNT dopamine nanosensors screened against 63 small molecules spanning the chemical space around dopamine (Figure S1).? This data set provides a foundation to investigate whether analyte structure alone is sufficient to predict fluorescence modulation. Here, we analyzed the data set using principal component analysis (PCA) to identify structural motifs linked to response strength and developed support vector regression (SVR) and support vector classification (SVC) models trained on molecular fingerprints and orbital descriptors. We compared ensemble and cross-validation approaches, evaluated predictive performance, and tested model generalizability using a blind set of 21 molecules. Recent studies have demonstrated the power of high-throughput DNA library screening and multisensor arrays for optimizing detection of specific targets through broad sequence exploration and signal diversity. These methods excel at identifying high-performance sensors for defined analytes and yield robust classifiers for clinical or diagnostic applications. ?−? ? ? In contrast, our single-sensor, multianalyte framework focuses on sensor selectivity by modeling responses across a structurally diverse chemical space using a single, fixed DNA–SWCNT nanosensor. By emphasizing analyte-driven prediction, our study complements previously reported sequence-focused ML efforts and demonstrates how predictive modeling can inform nanosensor design.
Our data set comprised 63 small molecules tested for ΔF/F exp responses with (GT)6–SWCNT dopamine nanosensors (Figure S1 and Table S1). ΔF/F exp is defined as the change in fluorescence intensity from baseline (ΔF/F exp = (F – F 0)/F 0, where F 0 and F are areas under the fluorescence intensity curves in the wavelength range from 1100 to 1400 nm before and after analyte addition, respectively). The data set was generated using (GT)6–SWCNT nanosensors prepared from mixed-chirality SWCNT samples, as described in the extended methods in the Supporting Information; example fluorescence spectra of the nanosensor solution before and after the addition of dopamine analyte are reported in Figure S2. To evaluate whether the analyte structure correlates with the response magnitude, we performed PCA using three molecular encoding methods: extended connectivity fingerprint (ECFP4) bit vectors (radius 2, 2048 dimensions),? ECFP4 count vectors, and molecular access system (MACCS) keys? (Figurea–c). Across all representations, molecules producing strong optical responses could be separated from those producing weak responses in the principal component space. For ECFP4 bit vectors, PC1 values correlated strongly with ΔF/F exp (ρ_PC1_ = 0.602, and p < 0.0001; ρ refers to the Spearman coefficient here and below), while PC2 correlated with weakly responding analytes (ρ_PC2_ = −0.221, and p = 0.08). Similarly, PC1 values for ECFP4 count vectors correlated with ΔF/F exp (ρ_PC1_ = 0.649, and p < 0.0001). MACCS keys also differentiated strong-response molecules, clustering them in the top left region of PCA space (Figurec). These consistent separations across encoding methods confirm that analyte structure encodes information predictive of the sensor response.
Since PC1 values for ECFP4 bit vectors significantly correlated with the sensor response, we examined the structural features associated with this component and identified chemotypes and molecular descriptors associated with the largest absolute PC1 coefficients (Tables S2 and S3). Negative PC1 coefficients, enriched with weak-response molecules, corresponded primarily to unsubstituted aromatic carbons and phenoxide motifs. Positive PC1 coefficients, enriched with strong-response molecules, corresponded to phenolic and oxygenated aromatic fragments. Correlations with simple molecular descriptors supported this trend, as PC1 correlated with hydrogen bond donors (ρ = 0.55), topological polar surface area (ρ = 0.36), and oxygen count (ρ = 0.34). Together, these results highlight oxygenated aromatics as a structural motif driving strong nanosensor responses.
To predict continuous ΔF/F values, we trained SVR and SVC models with multiple fingerprint-kernel combinations. The workflow (Figured–f) involved encoding molecules into RDKit fingerprints,? with or without highest occupied molecular orbital (HOMO) and lowest unoccupied molecular orbital (LUMO) energy descriptors, to train models that either predict continuous ΔF/F ML values (regression, SVR) or classify responses as high (class 1) or low (class 0) (classification, SVC). Individual models occasionally achieved strong performance (e.g., linear SVR with AtomPairs fingerprints; R ^2^ = 0.82; r Pearson = 0.91; p < 0.0001 (Figurea)). However, given the small data set size, model training exhibited stochastic variability. To systematically evaluate the model stability, we used two complementary approaches. First, we trained 200 SVR models for each fingerprint-kernel combination with various random seeds. Performance distributions were broad (Figures S3 and S4), with R ^2^ values ranging from negative (as low as −7) to near 0.9. Mean R ^2^ values across ensembles ranged from −0.65 to 0.36 (Figureb and Figures S3 and S4). Inclusion of HOMO and LUMO descriptors generally did not improve the performance, indicating that molecular fingerprints alone were more effective. These results highlight both the potential and instability of SVR on small data sets. Second, we employed repeated 5 × 5 nested cross-validation, with and without hyperparameter optimization. Cross-validation models with default hyperparameters achieved mean R ^2^ values of 0.3–0.4 (Figurec and Table S5), outperforming ensemble averages. In contrast, models with tuned hyperparameters afforded slightly lower R ^2^ values (0.28–0.33 (Figure S5 and Table S6)). These findings suggest that hyperparameter tuning overfit the limited data set while default hyperparameters yielded more transferable models.
We next simplified the prediction task to binary classification, separating molecules into strong- and weak-response classes using a ΔF/F threshold of 0.3 (Figured). This threshold produced an approximately balanced distribution (class 0, 34; class 1, 29; Figured), which is recommended because pronounced class imbalance can hinder classifier learning.? Using this threshold, molecules with negative ΔF/F exp values were also grouped into the weak-response class for simplicity, with only four of the 63 molecules in our library observed to have negative ΔF/F exp values of less than −0.3 (Table S1). Ensembles of 200 SVC models achieved mean accuracy and F1 scores of ∼0.8 across fingerprints, with slightly better performance for weak-response predictions (Figuree and Figures S6 and S7). Cross-validation SVC models showed similar performance, with mean F1 scores of 0.80–0.86 (Figuref and Table S7). As with regression, models trained with default hyperparameters generalized more effectively than tuned models. These results demonstrate that even under data-limited conditions, classifiers robustly distinguish strong- from weak-response analytes.
To evaluate generalizability, we applied an ensemble of our best models, selected from our trained models (listed in Table S4), to a blind set of 21 molecules not included in training (Figure S8 and Table S8). PCA confirmed that these molecules occupied a similar chemical space to the training set (Figurea). Regression predictions from 200-model ensembles achieved an R ^2^ of 0.264 (Figureb). Nested 5 × 5 cross-validation ensembles with default hyperparameters achieved an R ^2^ of 0.236, while tuned hyperparameters gave an R ^2^ of 0.211 (Figurec,d), therefore indicating that tuning for training performance transferred less effectively to blind data. However, because initial testing showed higher R ^2^ values (Figurec) but blind validation resulted in lower R ^2^ values (Figurec,d), we also decided to examine the models that use the maximum amount of data per fold, the nested leave-one-out cross-validation approach (LOO-CV). Using Morgan/ECFP4 fingerprints and tuned hyperparameters (C = 0.03, and ε = 0.05) achieved an R ^2^ value of 0.296 (Figuree). LOO-CV with default hyperparameters (C = 1.0, and ε = 0.1) achieved a similar R ^2^ value. The best-performing individual model from the nested 5 × 5 CV model (MACCS keys, RBF kernel, default hyperparameters) achieved an R ^2^ of 0.423. The other top models from the nested LOO-CV approach are reported in Figure S9. Classification models achieved consistent blind-set performance, maintaining F1 scores around 0.8 (Figuref). Together, these results show that default hyperparameter cross-validation models offer the best balance of training performance and transferability.
This work demonstrates that ML can provide preliminary insight into the chemically meaningful relationships between molecular structure and optical response in DNA–SWCNT nanosensors, despite being trained on modest experimental data sets. By integrating molecular fingerprints, electronic descriptors, and PCA, we identified interpretable structural motifs, such as oxygenated aromatic groups, that are consistently associated with enhanced fluorescence modulation in (GT)6–SWCNT dopamine nanosensors. The models reveal that subtle variations in analyte structure, such as the presence of phenolic hydroxyl groups or polar aromatic functionalities, can have a pronounced effect on the sensor response, highlighting the sensitivity of DNA–SWCNT interactions to molecular polarity and hydrogen bonding. These findings are consistent with intuitive expectations based on catechol chemistry, and PCA offers quantitative confirmation of this relationship. Unexpectedly, although redox properties of analytes are known to influence polymer–SWCNT sensing,? adding gas-phase HOMO and LUMO energies reduced model performance, likely because gas-phase orbital energies poorly capture the solution-phase redox potentials and interfacial charge-transfer processes relevant to sensing.
Beyond structural interpretation, our comparative evaluation of SVR and SVC models provides insight into model design for data-limited nanosensor studies. Regression models achieved moderate predictive power (mean R ^2^ = 0.2–0.4), while classification models attained strong discrimination between strong- and weak-response analytes (F1 ∼ 0.8). The modest R ^2^ values observed for regression are consistent with the sparsity and the limited size of the data set used for model training. These limitations make it difficult for models to learn smooth, continuous structure–response relationships, and they are well-recognized in cheminformatics and materials ML, where small experimental data sets often reduce model stability and resolution. ?,? We also found that small-fold CV models with default hyperparameters often generalized better than tuned models. This behavior is typical with limited data, where hyperparameter optimization can overfit to noise in training splits instead of improving true predictive accuracy. ?,? In such cases, simpler models often provide more reliable external performance than heavily optimized ones. We therefore view the performance of default models not as an inherent methodological advantage but as a consequence of the data set size. Our framework should be viewed as a conservative, exploratory analysis rather than a high-capacity predictive tool. Finally, we note that our R ^2^ values are consistent with those reported in the literature for ML approaches to DNA–SWCNT molecular recognition, underscoring the difficulty of predicting such complex interactions.? While hyperparameter tuning generally reduced transferability in the repeated 5 × 5 cross-validation, the LOO-CV approach showed a different behavior in blind data set tests. In LOO-CV, each training fold contained the maximum amount of data available (62 of the 63 molecules, more than ∼50 molecules in the 5 × 5 cross-validation). With the LOO-CV approach, default and tuned C and ε parameters had similar performance using ECFP4 fingerprints for blind test data set. The differences in the repeated K-fold and LOO-CV show the high sensitivity of models to the amounts of data used in small-data regimes. When folds are small, tuning can overfit to noise, whereas when folds are larger, tuning can refine the model capacity in a more controlled manner. However, even with LOO-CV, the gains are moderate, underscoring that the data set size is the primary limiting factor for regression accuracy. Our classification models appear more stable because the classification task is inherently simpler than the regression task. We note that the current framework is an initial, data-limited step toward analyte-centered modeling and not a substitute for larger data sets or atomistic descriptions of nanosensor–analyte interfaces.
We note that the current ML models are likely limited to making predictions within the chemical space spanned by the training data set. Because the analytes were deliberately chosen to sample the region surrounding dopamine, the predictive validity is restricted to this local neighborhood. This limitation is illustrated by a molecule in the blind test set (analyte EEE), for which there is only one similar example in the training data set (RR) and consistently predicted as an outlier (Figureb–e), or UUU analyte, which is chemically distinct from the other analytes in the training data set, and is sometimes predicted poorly. Achieving broader generalization will require expanding the training data to include chemically diverse analytes so that the learned structure–response relationships cover a wider applicability domain.
The success of ML-based prediction using only analyte descriptors also highlights a useful advance, that the analyte, not only the DNA corona, could carry predictive information about nanosensor performance. Prior efforts have focused primarily on predicting sequence responsiveness for fixed analytes; in contrast, our analyte-centered approach complements these by mapping how variations in molecular chemistry influence a fixed DNA–SWCNT system. Together, sequence-centric and analyte-centric approaches could provide a foundation for the bidirectional design of SWCNT-based sensors.
Looking forward, expanding training data sets through high-throughput measurements? or incorporating explicit molecular interaction descriptors (e.g., docking energies or molecular dynamics features) could further improve predictive performance and interpretability. Coupling ML with generative or active learning frameworks may also enable iterative, in silico exploration of chemical space to identify optimal analyte–SWCNT pairings with minimal experimental screening.
In summary, this study establishes a framework for predictive analyte-driven modeling of DNA–SWCNT optical responses. By demonstrating that molecular structure encodes sufficient information to forecast sensor behavior, it opens the door to the rational, data-informed design of nanosensors tailored for specific biochemical environments or targets. Such approaches can significantly accelerate the discovery pipeline for next-generation nanomaterial-based sensing platforms. Furthermore, future work could integrate molecular information from high-resolution methods such as molecular dynamics simulations with ML models to explicitly incorporate conformational and steric effects in the DNA corona and to examine whether such insights improve predictive performance. Although demonstrated here for ssDNA–SWCNT species, the analyte-centered ML framework can be applied to other sensors, such as SWCNTs with peptide, polymer, or surfactant coatings, or sensors based on different components, provided that sufficiently large experimental data sets of sensor responses to diverse analytes are available and the analyte chemical structures are known.
Methods
Molecular Encoding
The original and blind data sets included 63 and 21 small molecules, respectively, with their ΔF/F exp responses measured for (GT)6–SWCNT species (Figures S1 and S8 and Tables S1 and S8). ΔF/F exp was defined as (F – F 0)/F 0, where F 0 and F are fluorescence values before and after analyte addition, respectively. Since ΔF/F exp values were calculated from the integrated areas under the fluorescence emission spectra (1100–1400 nm), the spectral data were not decomposed into individual chirality contributions and SWCNT handedness was not explicitly considered. To assess peak shifts, we examined spectra for dopamine and several representative compounds (DA, O, RR, T, YY, and Y) and observed only minor changes (0–2 nm) (Figure S2), which were therefore not included in the data sets. Molecules were encoded as SMILES strings and converted into six RDKit fingerprints: RDKit (Daylight-like),? Morgan/ECFP4 (radius 2),? MACCS keys,? Avalon as implemented in RDKit,? AtomPair,? and Topological Torsion.? HOMO and LUMO energies were computed via DFT (Gaussian09, B3LYP/cc-pVTZ) and included as descriptors in some models.
PCA and Chemotype Analysis
PCA was applied to fingerprint matrices to evaluate the chemical variance. For ECFP4 bit vectors, high-weight PC1 coefficients were mapped back to (SMILES arbitrary target specification) SMARTS substructures and grouped into chemotypes. Label confidence scores and frequency thresholds were used to filter results (Tables S2 and S3). Molecular descriptors, such as topological polar surface area, hydrogen bond donors, and oxygen count, were correlated with PC1 using Spearman coefficients.
Machine Learning Models
Two Hundred-Model Ensembles
For each fingerprint-kernel combination, 200 SVR or SVC models were trained with varied random seeds using scikit-learn. Performance distributions were summarized as R ^2^ (regression) or F1 scores (classification).
Cross-Validation
Nested repeated 5 × 5 cross-validation was used for both regression and classification. The outer folds provided unbiased performance estimates, while the inner folds optimized the SVM hyperparameters. For SVR, the grid search varied regularization strength C among values of 0.1, 1.0, and 10.0; insensitive-loss parameter ε among values of 0.01, 0.1, and 0.5; and, for nonlinear kernels, radial basis function width γ among values of “scale”, 0.1, and 1.0. For SVC, the tuning grid explored the same set of C values (0.1–10.0) and γ values (“scale”, 0.1, and 1.0). Default models corresponded to scikit-learn’s built-in SVM settings-RBF kernel with C = 1.0, ε = 0.1, and γ = “scale” for SVR and C = 1.0 and γ = “scale” for SVC. Stratified folds were used for classification to preserve class balance.
In addition to the repeated 5 × 5 cross-validation model described above, we implemented a nested LOO-CV framework to evaluate whether using the entire data set for training, minus one held-out molecule, would improve model generalization given the small sample size (63 analytes). LOO-CV maximizes the amount of data available to the model in each training fold, which is particularly advantageous in chemical sensing applications with small data sets. The LOO-CV outer loop provided unbiased predictions for every molecule, while an inner repeated 5 × 5 CV simultaneously performed hyperparameter tuning for the SVR models. The default SVR parameters for LOO-CV were a linear kernel with C = 1.0 and ε = 0.1. During tuning, we explored a grid of regularization strengths C ∈ {0.01, 0.03, 0.1, 0.3}and insensitive-loss parameters ε ∈ {0.02, 0.05, 0.1}, chosen to bias the model toward moderate regularization? and avoid overfitting in the high-dimensional fingerprint space. This nested LOO-CV strategy therefore complemented the repeated K-fold analysis by enabling every data point to contribute to model training, providing a finer-grained assessment of predictive stability across molecules, and identifying optimal fingerprint–hyperparameter combinations under maximal training data availability.
Evaluation Metrics
Regression models were evaluated using R ^2^, while classification models were assessed using accuracy, precision, recall, and F1 scores.
Additional methodological details are provided in the Supporting Information.
Supplementary Material
The reference list from the paper itself. Each links out to its DOI / PubMed record.
- 1Krasley A. T.Li E.Galeana J. M.Bulumulla C.Beyene A. G.Demirer G. S.Carbon Nanomaterial Fluorescent Probes and Their Biological Applications Chem. Rev.20241243085318510.1021/acs.chemrev.3c 0058138478064 PMC 10979413 · doi ↗ · pubmed ↗
- 2Paviolo C.Ferreira J. S.Lee A.Hunter D.Calaresu I.Nandi S.Groc L.Cognet L.Near-Infrared Carbon Nanotube Tracking Reveals the Nanoscale Extracellular Space around Synapses Nano Lett.202222176849685610.1021/acs.nanolett.1c 0425936038137 PMC 9479209 · doi ↗ · pubmed ↗
- 3Harvey J. D.Jena P. V.Baker H. A.Zerze G. H.Williams R. M.Galassi T. V.Roxbury D.Mittal J.Heller D. A.A Carbon Nanotube Reporter of Micro RNA Hybridization Events in Vivo Nat. Biomed. Eng.201714004110.1038/s 41551-017-004128845337 PMC 5568023 · doi ↗ · pubmed ↗
- 4Saha A.Gifford B. J.He X.Ao G.Zheng M.Kataura H.Htoon H.Kilina S.Tretiak S.Doorn S. K.Narrow-Band Single-Photon Emission through Selective Aryl Functionalization of Zigzag Carbon Nanotubes Nat. Chem.201810111089109510.1038/s 41557-018-0126-430177779 · doi ↗ · pubmed ↗
- 5Godin A. G.Varela J. A.Gao Z.DannéN.Dupuis J. P.Lounis B.Groc L.Cognet L.Single-Nanotube Tracking Reveals the Nanoscale Organization of the Extracellular Space in the Live Brain Nat. Nanotechnol.201712323824310.1038/nnano.2016.24827870840 · doi ↗ · pubmed ↗
- 6Beyene A. G.Alizadehmojarad A. A.Dorlhiac G.Goh N.Streets A. M.Král P.VukovićL.Landry M. P.Ultralarge Modulation of Fluorescence by Neuromodulators in Carbon Nanotubes Functionalized with Self-Assembled Oligonucleotide Rings Nano Lett.201818116995700310.1021/acs.nanolett.8b 0293730350638 PMC 6771428 · doi ↗ · pubmed ↗
- 7Kang S. J.Kocabas C.Ozel T.Shim M.Pimparkar N.Alam M. A.Rotkin S. V.Rogers J. A.High-Performance Electronics Using Dense, Perfectly Aligned Arrays of Single-Walled Carbon Nanotubes Nat. Nanotechnol.20072423023610.1038/nnano.2007.7718654268 · doi ↗ · pubmed ↗
- 8Mun J.Navarro N.Jeong S.Ouassil N.Leem E.Beyene A. G.Landry M. P.Near-Infrared Nanosensors Enable Optical Imaging of Oxytocin with Selectivity over Vasopressin in Acute Mouse Brain Slices Proc. Natl. Acad. Sci. U. S. A.202412126 e 231479512110.1073/pnas.231479512138905241 PMC 11214003 · doi ↗ · pubmed ↗