Homeometric autoregulation in severe aortic stenosis: insights from transcatheter aortic valve replacement
Adam J. Doerr, Matthew Gottbrecht, Nikolaos Kakouros, Matthew W. Parker, Colleen M. Harrington, Gerard P. Aurigemma

TL;DR
This study explores how heart function changes after aortic valve replacement in patients with severe aortic stenosis, revealing unexpected declines in heart muscle strength.
Contribution
The study identifies a novel autoregulatory mechanism linking high afterload and contractility in severe aortic stenosis.
Findings
Contractility declined in the near-term postoperative period following TAVR.
High afterload in severe AS augments contractility, which declines after TAVR.
Heart rate and ventricular volumes remained unchanged post-TAVR.
Abstract
In severe aortic stenosis (AS), relief of afterload excess would be expected to improve left ventricular ejection fraction. However, the response of LVEF to transcatheter aortic valve replacement (TAVR) is variable, with some patients even demonstrating a decline. The mechanisms underlying this phenomenon are incompletely characterized. Accordingly, we investigated changes in systolic function in the near-term postoperative period following TAVR. We studied consecutive patients with severe AS referred for TAVR without identifiable perioperative sources of negative inotropy or ventricular dyssynchrony. Preoperative and postoperative day one echocardiograms were compared with respect to hemodynamics, LV geometry, LVEF, and midwall fractional shortening (FSmw). Contractility was assessed by comparing observed FSmw values to those predicted based on the stress-shortening relation of…
Genes, proteins, chemicals, diseases, species, mutations and cell lines named across the full text — each resolved to its canonical identifier and authoritative record.
Click any figure to enlarge with its caption.
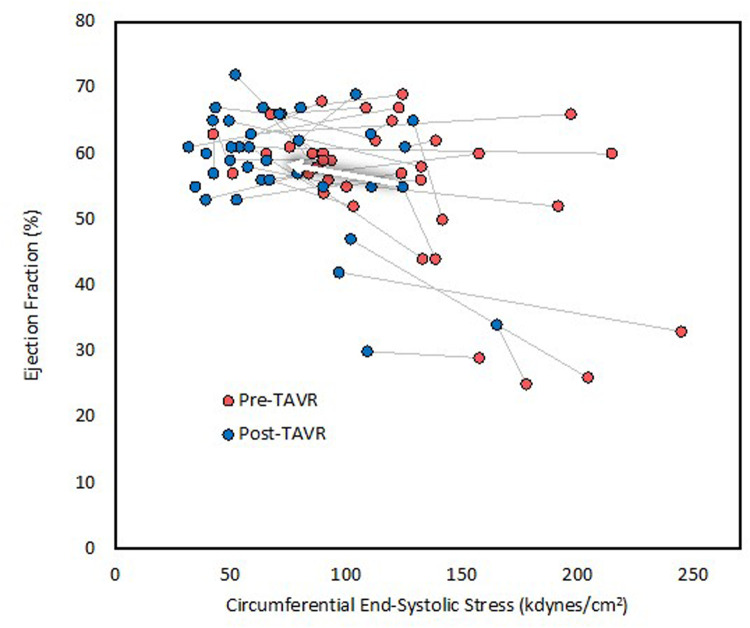 Figure 1
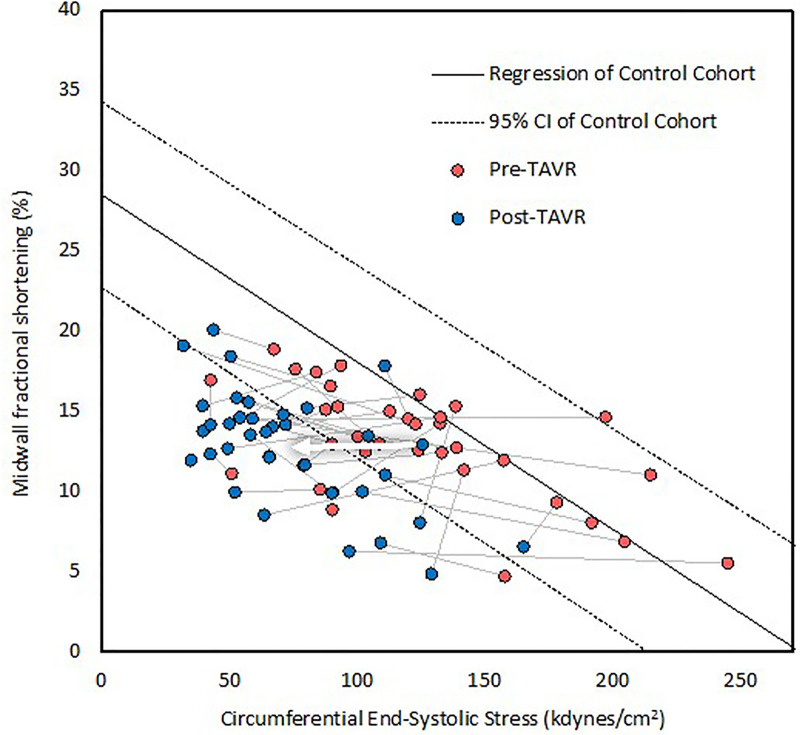 Figure 2
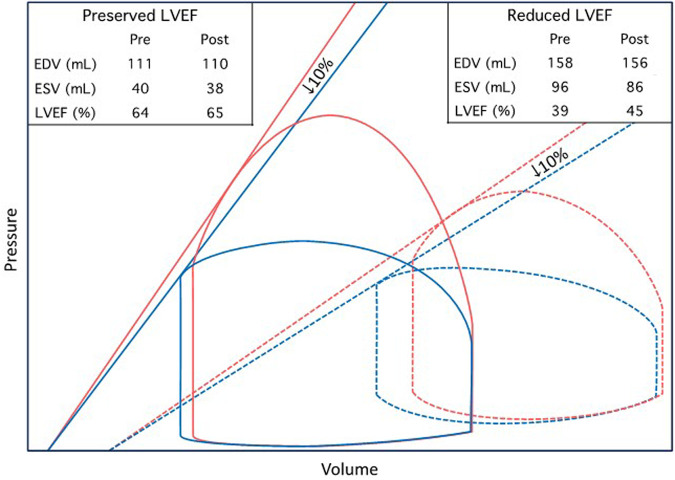 Figure 3
| Characteristic | |
|---|---|
| Age (years) | 77 ± 9 |
| Women | 61% (22) |
| Height (inches) | 65 ± 4 |
| Weight (lbs) | 165 ± 47 |
| BSA (m2) | 1.83 ± 0.29 |
| BMI (kg/m2) | 27.8 ± 7.8 |
| STS score (%) | 3.6 ± 2.3 |
| Severe AS subtype | |
| HG | 75% (27) |
| Classical LFLG | 8% (3) |
| Paradoxical LFLG | 6% (2) |
| NFLG | 11% (4) |
| NYHA class | |
| II–IV | 89% (32) |
| II | 36% (13) |
| III | 44% (16) |
| IV | 8% (3) |
| Hypertension | 94% (34) |
| Diabetes mellitus | 25% (9) |
| Prior MI | 8% (3) |
| Prior PCI | 6% (2) |
| Prior CABG | 6% (2) |
| AF paroxysmal | 9% (3) |
| AF persistent | 31% (11) |
| Conduction defect | 14% (5) |
| Pacemaker pre-TAVR | 11% (4) |
| CVA | 8% (3) |
| TIA | 8% (3) |
| Chronic lung disease | 19% (7) |
| ESRD | 3% (1) |
| Valve type | |
| Balloon-expandable | 92% (33) |
| Self-expanding | 8% (3) |
| Variable | Pre-TAVR | Post-TAVR | % change | |
|---|---|---|---|---|
| SBP (mmHg) | 135 ± 23 | 132 ± 19 | 0.40 | |
| DBP (mmHg) | 72 ± 8 | 58 ± 12 | <0.001 | −19 |
| HR (bpm) | 79 ± 15 | 78 ± 14 | 0.76 | |
| LVIDd (mm) | 45 ± 7 | 43 ± 7 | <0.01 | −4 |
| IVSTd (mm) | 12 ± 2 | 13 ± 2 | 0.14 | |
| PWTd (mm) | 12 ± 2 | 12 ± 2 | 0.93 | |
| LVIDs (mm) | 32 ± 8 | 30 ± 8 | 0.07 | |
| LVMI (g/m2) | 108 ± 33 | 105 ± 27 | 0.35 | |
| EDV (mL) | 127 ± 38 | 122 ± 27 | 0.27 | |
| ESV (mL) | 58 ± 29 | 52 ± 21 | 0.14 | |
| RWT | 0.55 ± 0.14 | 0.58 ± 0.12 | 0.07 | |
| AVA (cm2) | 0.71 ± 0.22 | 1.58 ± 0.52 | <0.001 | 124 |
| AVAi (cm2/m2) | 0.39 ± 0.13 | 0.88 ± 0.29 | <0.001 | 122 |
| Mean AVG (mmHg) | 48 ± 14 | 12 ± 6 | <0.001 | −74 |
| Peak AVG (mmHg) | 78 ± 20 | 20 ± 9 | <0.001 | −74 |
| cESS (kdyn/cm2) | 122 ± 47 | 74 ± 32 | <0.001 | −39 |
| Zva (mmHg/mL/m2) | 5.25 ± 1.84 | 3.89 ± 0.87 | <0.001 | −26 |
| SVi (mL/m2) | 38.10 ± 11.45 | 38.65 ± 8.99 | 0.72 | |
| LVEF (%) | 55 ± 11 | 58 ± 9 | <0.05 | 5 |
| FSmw (%) | 13 ± 3 | 13 ± 4 | 0.76 | |
| FSmw percent predicted (%) | 89 ± 33 | 61 ± 15 | <0.001 | −31 |
| High mean AVG | 94 ± 34 | 63 ± 16 | <0.001 | −33 |
| Low mean AVG | 73 ± 24 | 55 ± 10 | <0.05 | −25 |
| Normal baseline SVi | 90 ± 36 | 58 ± 17 | <0.001 | −36 |
| Low baseline SVi | 87 ± 29 | 66 ± 9 | <0.01 | −24 |
| Preserved baseline LVEF | 88 ± 31 | 65 ± 14 | <0.001 | −26 |
| Reduced baseline LVEF | 90 ± 39 | 52 ± 12 | <0.05 | −42 |
| FSmw ≥2 SD below predicted (%) | 22% (8) | 78% (28) | <0.001 | 250 |
| Study | Subgroup | LVEF (% ± SD) | Time Interval |
| ||
|---|---|---|---|---|---|---|
| Pre-TAVR | Post-TAVR | |||||
| Maes et al., 2019 (TOPAS-TAVI) ( | LVEF <30% | 22 ± 5 | 34 ± 12 | 1 year | 128 | <0.001 |
| Pilgrim et al., 2011 ( | LVEF ≤30% | 25 ± 4 | 34 ± 10 | Discharge | 37 | <0.001 |
| Fraccaro et al., 2012 ( | LVEF <35% | 27.7 ± 6.0 | 35.4 ± 11.0 | Discharge | 46 | <0.0001 |
| O'Sullivan, et al., 2013 ( | LVEF ≤40%, LFLG | 29.0 ± 6 | 38.3 ± 13.2 | 30 days | 20 | <0.0001 |
| O'Sullivan, et al., 2013 ( | LVEF ≤40%, LFHG | 31.8 ± 7 | 50.6 ± 10.0 | 30 days | 31 | <0.0001 |
| Bauer et al., 2013 ( | All | 32 ± 9 | 50 ± 17 | 30 days | 31 | <0.05 |
| Gotzmann et al., 2012 ( | LFLG | 32 ± 6 | 46 ± 11 | 6 months | 15 | <0.01 |
| Van Linden et al., 2011 ( | LVEF ≤40% | 32.5 ± 7.1 | 41.5 ± 10.1 | Discharge | 39 | <0.0001 |
| 53.9 ± 13 | 1 year | <0.0001 | ||||
| Kuneman et al., 2022 ( | LVEF <40% | 33 ± 6 | 43 ± 10 | 1 year | 88 | <0.001 |
| Ewe et al., 2010 ( | LVEF <50% | 37 ± 8 | 46 ± 11 | Discharge | 97 | <0.001 |
| Maes et al., 2019 (TOPAS-TAVI) ( | LVEF 30−40% | 37 ± 7 | 41 ± 12 | 1 year | 165 | <0.001 |
| Elmariah et al., 2013 (PARTNER Cohort A Trial) ( | LVEF <50% | 37.1 ± 9.2 | 48.6 ± 11.3 | 1 year | 108 | <0.0001 |
| Løgstrup et al., 2013 ( | LVEF ≤50% | 39 ± 9.4 | 52 ± 12.5 | 1 year | 74 | <0.0001 |
| Deste et al., 2018 ( | All | 39.3 ± 8.8 | 44.1 ± 10.1 | 30 days | 46 | <0.05 |
| Kuneman et al., 2022 ( | LVEF 40–49% | 45 ± 3 | 52 ± 8 | 1 year | 122 | <0.001 |
| Harrington et al., 2021 ( | LVEF <60% | 45.4 ± 10 | 46.7 ± 9.8 | 1 year | NR | 0.15 |
| Sato et al., 2017 ( | All | 50 ± 14 | 53 ± 13 | 10 days | 209 | <0.001 |
| Popma et al., 2014 (CoreValve Extreme) ( | All | 54.5 ± 14.4 | 57.3 ± 11.6 | 1 year | 330 | NR |
| Pilgrim et al., 2011 ( | LVEF >30% | 56 ± 10 | 57 ± 11 | Discharge | 219 | NR |
| Fraccaro et al., 2012 ( | LVEF ≥35% | 56.5 ± 8.7 | 55.9 ± 9.2 | Discharge | 315 | 0.24 |
| Gotzmann et al., 2012 ( | No LFLG | 57 ± 11 | 56 ± 8 | 6 months | 152 | >0.05 |
| Løgstrup et al., 2013 ( | LVEF >50% | 57.9 ± 5.3 | 60 ± 7.7 | 1 year | 34 | >0.05 |
| Kuneman et al., 2022 ( | LVEF ≥50% | 58 ± 5 | 59 ± 7 | 1 year | 350 | <0.05 |
| Ewe et al., 2010 ( | LVEF ≥50% | 61 ± 7 | 59 ± 11 | Discharge | 50 | >0.05 |
| Harrington et al., 2021 ( | LVEF ≥60% | 65.7 ± 5.5 | 53.5 ± 10.8 | 1 year | NR | <0.01 |
Peer Reviews
No public reviews on file for this paper yet. If you reviewed it on a platform where reviews are public (OpenReview, ICLR, NeurIPS, ICML), you can paste yours below so the community can read it here.
Videos
No videos yet. Explain this paper in a talk, walkthrough, or lecture? Add one.
Taxonomy
TopicsCardiac Valve Diseases and Treatments · Aortic Disease and Treatment Approaches · Cardiovascular Function and Risk Factors
Introduction
In severe aortic stenosis (AS), left ventricular systolic function is maintained through the development of concentric hypertrophy or remodeling (1, 2), wherein the parallel addition of sarcomeres increases wall thickness relative to chamber size (3). This process mitigates the adverse effect of excess end-systolic wall stress caused by high valvular resistance (4). It is generally assumed that reduced LVEF in severe AS without coronary artery disease results from afterload excess (4). However, data from studies employing midwall stress-shortening relations suggest some patients with severe AS also have abnormalities in LV contractility (5). Such reduced contractility appears to result from replacement fibrosis and microvascular dysfunction (6, 7).
Transcatheter aortic valve replacement (TAVR) represents a unique opportunity to study LV mechanics in severe AS due to the immediate drop in afterload and because the confounding effects of thoracotomy and cardioplegia-related myocardial depression are obviated. While pooled results from several large trials suggest an inverse relationship between baseline LVEF and the magnitude of LVEF improvement following TAVR (8–21), recent work has demonstrated a lack of significant improvement or even a decline in LVEF following TAVR in patients with baseline LVEF >60% (22). This occurred despite a decrease in afterload as assessed by both wall stress and valvuloarterial impedance. Barring significant changes in preload, which is thought to only have a modest impact on LVEF at the extremes (23), these findings suggest contractility decline. However, given the 1-year interval between TAVR and repeat echocardiography in that study, it is difficult to discount a reduction in contractility through earlier and faster regression of myocyte hypertrophy than interstitial fibrosis (24, 25). While subsequent work demonstrated similar findings in the immediate postoperative period (26), the use of LVEF, even when indexed to wall stress, fails to account for LV concentric remodeling, which inherently confounds the assessment of contractility (1, 27).
This study aimed to characterize the near-term, isolated effect of TAVR on LV contractility in the absence of confounding effects from loading conditions, geometric abnormalities, and common perioperative sources of negative inotropy encountered in this population.
Methods
Patient selection
This was a single-center retrospective cohort study. Patients were considered for inclusion if they had severe AS as defined by contemporary guidelines (28), underwent TAVR at UMass Memorial Medical Center between 1 January 2021 and 29 September 2021, and had preoperative echocardiograms available for review if performed at another institution. The following exclusion criteria were sequentially applied: previous transcatheter or surgical aortic valve replacement; concomitant non-AS severe valvular disease; myocardial infarction (MI), coronary artery bypass grafting, or percutaneous coronary intervention (PCI) within 8 weeks of TAVR or between pre- and postoperative echocardiograms; unrevascularized hemodynamically significant coronary artery disease (defined as vessel diameter reduction ≥80% or fractional flow reserve <0.8 on coronary angiography); initiation or dose escalation of negative inotropic agents between pre- and postoperative echocardiograms; new conduction abnormality or pacemaker dependence between pre- and postoperative echocardiograms; incomplete clinical data; and inadequate echocardiogram image quality. The UMass Chan Institutional Review Board approved the study and waived the requirement for informed consent due to the retrospective design and minimal potential harm to subjects.
Outcomes
The primary endpoint was a change in LV contractility based on the stress-shortening relation, as described below. The secondary endpoints included changes in LVEF, circumferential end-systolic wall stress (cESS), valvuloarterial impedance (Zva), and mean AV gradient (AVG).
Echocardiography
All patients underwent comprehensive two-dimensional and Doppler echocardiography preoperatively and on postoperative day 1 according to American Society of Echocardiography standards (28). Valvuloarterial impedance was calculated as the sum of systolic blood pressure (SBP) and mean AVG divided by stroke volume indexed to body surface area. Left ventricular end-diastolic and end-systolic volumes (EDV and ESV) and LVEF were measured by the biplane disk summation method.
Two-dimensional measurements of septal thickness, LV internal diameter, and LV posterior wall thickness were obtained at the level of the mitral valve leaflet tips in the parasternal long-axis view at end-diastole and end-systole. Midwall fractional shortening and cESS were derived based on a two-shell model of the LV, assuming constant volumes of each shell throughout the cardiac cycle, as previously described (29, 30). Left ventricular mass was calculated using the Devereux equation (cube method) (31, 32).
Clinical data
Average blood pressure values were derived using readings taken ±2 h from the time of echocardiography to decrease the influence of outliers in afterload calculations. When available, arterial catheter data were used instead of sphygmomanometer measurements. Reported heart rate values were recorded during patients' parasternal long-axis views on echocardiograms. Demographic, anthropomorphic, and comorbidities data were abstracted from the electronic medical record.
Control cohort
A control cohort from a prior study (33) of midwall dynamics, comprised of 30 patients (43% women, mean age 74 ± 6 years) with normal echocardiograms, was used to derive a control stress-shortening relation through linear regression, defined as FSmw = 28.486 − 0.104 × cESS. The 95% confidence interval lower bound equation was FSmw = 22.702 − 0.106 × cESS.
Contractility calculations
Contractility was assessed by comparing observed to predicted FSmw based on the control stress-shortening relation. Abnormal contractility was defined as observed FSmw greater than two standard deviations below predicted.
Statistical analysis
Categorical variables are reported as percentages with absolute values and, when applicable, compared before and after TAVR using McNemar's test. Continuous variables are reported as means with standard deviations and compared before and after TAVR using the paired sample t-test if normally distributed or the Wilcoxon signed-rank test if not normally distributed. Normality was assessed by the Shapiro–Wilk test. P-values < 0.05 were considered statistically significant. The corresponding author had full access to all the data in the study and takes responsibility for its integrity and the data analysis.
Results
Patient characteristics
Among the 100 patients eligible for inclusion, 4 were excluded due to prior surgical or transcatheter aortic valve replacement, 1 due to interval MI, 9 due to interval PCI, 4 due to unrevascularized coronary artery disease, 15 due to new conduction abnormality or pacemaker dependence, 5 due to initiation or uptitration of negative inotropic agents, 1 due to an intraprocedural complication (iatrogenic aorta–RV fistula), 9 due to incomplete clinical data, and 16 due to suboptimal image quality. Therefore, our cohort consists of 36 patients (61% women) with a mean age of 77 ± 9 years and a mean Society of Thoracic Surgeons (STS) mortality risk score of 3.6 ± 2.3%. Additional clinical characteristics are summarized in Table 1. The preoperative rhythm was sinus in 29 patients (81%), atrial fibrillation (AF) in 6 patients (17%), and unclear in 1 patient (3%). There were no missing data for any included patients.
Echocardiographic and hemodynamic changes
The mean length of time between preoperative echocardiogram and TAVR was 92 ± 89 days (range 3–472 days), and the mean length of time between TAVR and postoperative echocardiogram was 22 ± 4 h (range 5–25 h). Echocardiographic and hemodynamic parameters before and after TAVR are summarized in Table 2. SBP remained unchanged at 135 mmHg, whereas diastolic blood pressure decreased significantly from 72 ± 8 to 58 ± 12 mmHg. Aortic valve area increased significantly, whereas the mean and peak AVG decreased significantly. Circumferential ESS decreased significantly from 122 ± 47 to 74 ± 32 kdyn/cm^2^, as well as valvuloarterial impedance from 5.25 ± 1.84 to 3.89 ± 0.87 mmHg/mL/m^2^. End-diastolic volume, end-systolic volume, and stroke volume index remained unchanged, whereas LVEF increased significantly from 55 ± 11% to 58 ± 9% (Figure 1). The percentage of patients with FSmw greater than two standard deviations below predicted increased significantly from 22% (8) to 78% (28) (Figure 2), whereas the average percent predicted FSmw decreased significantly from 89 ± 33% to 61 ± 15%. Similar decreases in average percent predicted FSmw were observed in patients with high (94 ± 34% to 63 ± 16%) vs. low (73 ± 24% to 55 ± 10%) mean AVG, normal (90 ± 36% to 58 ± 17%) vs. low (87 ± 29% to 66 ± 9%) stroke volume index, and preserved (88 ± 31% to 65 ± 14%) vs. reduced (90 ± 39% to 52 ± 12%) LVEF. There was not a strong association between preoperative cESS and the degree of postoperative decline in percent predicted FSmw (R^2^ = 0.58).
Left ventricular ejection fraction before and after TAVR. LVEF increased only marginally despite significant afterload reduction. The arrow indicates average change.
The stress-shortening relationship before and after TAVR. Each patient is represented by a line, with red dots indicating preoperative values and blue dots postoperative values. The dots falling within the 95% CI represent normal contractility. This graph demonstrates that contractility was impaired in many patients at baseline and, on average, declined further following TAVR, as evidenced by horizontal movement crossing the lower bound 95% confidence interval of normal. The arrow indicates average change. CI indicates confidence intervals.
Discussion
In this cohort of 36 medically complex patients with severe AS, LVEF was mildly decreased at baseline and increased only slightly following TAVR despite substantial afterload reduction, pointing to an immediate decline in LV contractility. FSmw corrected for cESS was markedly reduced at baseline and decreased further within 24 h of TAVR, in support of this conclusion. Thus, this contractility decline is evident in the immediate post-TAVR period, long before reverse remodeling can take place. It also occurred in the absence of new ischemic insults, pacemaker-related ventricular dyssynchrony, initiation of negative inotropic agents, and confounding effects of thoracotomy. Heart rate remained unchanged, ruling out the contribution from the Bowditch effect (tachycardia-mediated positive inotropy). Therefore, this contractility decline appears to be related to valvular unloading itself.
Accordingly, we hypothesize that systolic function in severe AS is supported by augmentation of contractility in response to high afterload. A similar phenomenon involving tandem increases in effective arterial elastance and ventricular elastance has been demonstrated in hypertensive heart disease and normal aging (34–36). Multiple mechanisms may mediate the interaction between afterload and contractility, including enhanced sympathetic tone and alterations in myocardial calcium handling. In decompensated severe AS, the classic triad of positional or exertional hypotension (37), endomyocardial ischemia (38, 39), and pulmonary venous congestion (40, 41) is a potent trigger of increased adrenergic tone. Remediation of these processes through aortic valve replacement, in turn, reduces adrenergic tone (42). Additionally, acute afterload elevation (e.g., through aortic cross-clamping) has been shown to induce homeometric autoregulation (i.e., the Anrep effect), wherein increased myocardial stretch leads to an increase in the calcium transient amplitude (43–46). Although in vitro studies investigating this phenomenon in chronic pressure overload states are lacking, the Anrep effect would provide an elegant connection between valvular stenosis and augmented contractility.
Given that afterload is higher in AS patients with reduced LVEF (1, 27), our findings may be hypothesized to suggest positive inotropic autoregulatory mechanisms are more strongly activated in patients with reduced LVEF. Indeed, in our cohort, FSmw declined to a greater extent in patients with baseline reduced LVEF. Yet, prior studies have demonstrated an inverse relationship between baseline LVEF and the magnitude of LVEF improvement following TAVR (summarized in Table 3). Two explanations might resolve this seeming paradox. First, there was no strong correlation in our cohort between baseline wall stress and the magnitude of contractility decline; therefore, contractility augmentation in severe AS may not vary proportionately with afterload and instead occur as an “all or none” phenomenon at a certain afterload threshold. Second, the interaction between afterload and stroke volume is modified by the slope of the end-systolic pressure–volume relation (ESPVR). Patients with reduced LVEF have a higher prevalence and severity of contractile dysfunction and therefore typically experience marked improvement in LVEF with TAVR. Conversely, patients with preserved LVEF have less contractile dysfunction and steeper ESPVR slopes. Under these conditions, the impact of afterload reduction may be outweighed by an associated contractility decline, resulting in modest or no LVEF improvement. This phenomenon is illustrated in Figure 3.
Theoretic pressure–volume diagrams depicting proposed changes in LVEF following TAVR. Two hypothetical patients with normal and abnormal LV systolic function, respectively, are illustrated. In the presence of impaired LV contractility (signified by decreased ESPVR slope), stroke volume is more sensitive to changes in afterload. Accordingly, patients with reduced LVEF experience a significant increase in LVEF following TAVR, driven by a reduction in valvuloarterial impedance, despite a 10% contractility decline. Conversely, patients with preserved baseline LVEF experience minimal or no increase despite substantial afterload reduction. Red and blue lines indicate before and after TAVR, respectively. The solid and dashed lines indicate preserved and reduced baseline LVEF, respectively.
The variability in LVEF response to TAVR reinforces the limitations of endocardial indices in the evaluation of systolic function in the presence of altered LV geometry and loading conditions. Importantly, regardless of the impact on LVEF, withdrawal of these positively inotropic mechanisms likely restores both ventricular efficiency (i.e., the ratio of stroke work to total LV energy expenditure) and contractile reserve (i.e., the ratio of resting to maximal contractility), thereby improving exercise capacity and resistance to acute stressors, such as infection, arrhythmia, and hypovolemia (47, 48). Therefore, unlike long-term postoperative contractility impairment, which reflects poor reverse modeling and predicts poor outcomes following TAVR (49), contractility decline in the immediate term may actually be an expected and even favorable biomarker.
Several limitations of our study must be acknowledged. Our cohort was small, nonrandom, and derived from a single academic medical center, predisposing to sampling error and selection bias. While we excluded patients with clear perioperative confounders of systolic function, it is difficult to definitively rule out a preoperative contractility decline due to progression of AS-associated cardiomyopathy, particularly in patients with long time intervals between preoperative echocardiogram and TAVR. Similarly, given its procedural necessity, we were unable to exclude rapid pacing as a potential confounder of contractility. However, myocardial stunning secondary to extreme tachycardia is typically a transient and subclinical phenomenon, lasting on the order of minutes in the majority of patients (50). Accordingly, rapid pacing alone is unlikely to have caused such a profound decrease in contractility in this cohort. Lastly, Zva decreased to a lesser degree (26%) than did cESS (39%) and mean AVG (74%). Although blood pressure did not increase, this discrepancy may reflect increased arterial load, as has previously been demonstrated following TAVR (51). Therefore, afterload may be slightly underestimated by cESS following TAVR, predisposing to error during the calculation of predicted FSmw.
In summary, systolic function in severe AS seems to be supported by positive inotropic autoregulatory mechanisms. These may include increased adrenergic tone and the Anrep effect. Restoration of contractile reserve through downregulation of these mechanisms represents one of many favorable hemodynamic effects of aortic valve replacement.
The reference list from the paper itself. Each links out to its DOI / PubMed record.
- 1Ito S Pislaru C Miranda W Nkomo V Connolly H Pislaru S Left ventricular contractility and wall stress in patients with aortic stenosis with preserved or reduced ejection fraction. JACC Cardiovasc Imaging. (2020) 13:357–69. 10.1016/j.jcmg.2019.01.00930878438 · doi ↗ · pubmed ↗
- 2Aldrugh S Valle J Parker M Harrington C Aurigemma G. Prevalence of left ventricular hypertrophy caused by systemic hypertension preceding the development of severe aortic stenosis. Am J Cardiol. (2021) 150:89–94. 10.1016/j.amjcard.2021.03.03634052014 · doi ↗ · pubmed ↗
- 3Basso C Michaud K d'Amati G Banner J Lucena J Cunningham K Cardiac hypertrophy at autopsy. Virchows Arch. (2021) 479:79–94. 10.1007/s 00428-021-03038-033740097 PMC 8298245 · doi ↗ · pubmed ↗
- 4Ross J. Afterload mismatch in aortic and mitral valve disease: implications for surgical therapy. J Am Coll Cardiol. (1985) 5:811–26. 10.1016/s 0735-1097(85)80418-63882814 · doi ↗ · pubmed ↗
- 5Ballo P Mondillo S Motto A Faraguti S. Left ventricular midwall mechanics in subjects with aortic stenosis and normal systolic chamber function. J Heart Valve Dis. (2006) 15:639–50.17044369 · pubmed ↗
- 6Bernardo B Weeks K Pretorius L Mc Mullen J. Molecular distinction between physiological and pathological cardiac hypertrophy: experimental findings and therapeutic strategies. Pharmacol Ther. (2010) 128:191–227. 10.1016/j.pharmthera.2010.04.00520438756 · doi ↗ · pubmed ↗
- 7Rajappan K Rimoldi O Dutka D Ariff B Pennell D Sheridan D Mechanisms of coronary microcirculatory dysfunction in patients with aortic stenosis and angiographically normal coronary arteries. Circulation. (2002) 105:470–6. 10.1161/hc 0402.10293111815430 · doi ↗ · pubmed ↗
- 8Maes F Lerakis S Barbosa Ribeiro H Gilard M Cavalcante J Makkar R Outcomes from transcatheter aortic valve replacement in patients with low-flow, low-gradient aortic stenosis and left ventricular ejection fraction less than 30%: a substudy from the TOPAS-TAVI registry. JAMA Cardiol. (2019) 4:64–70. 10.1001/jamacardio.2018.432030566185 PMC 6439680 · doi ↗ · pubmed ↗