Deep learning based optic nerve sheath diameter characterization and structure quantification on transorbital ultrasound images
Miao Yang, Cong Liu, Pingyang Zou, Wu Wang

TL;DR
This paper introduces a deep learning model that improves the accuracy of measuring optic nerve structures in ultrasound images, aiding in the diagnosis of neurological conditions.
Contribution
The novel contribution is a deep neural network with shared/specific feature branches and an uncertainty-aware loss function for robust optic nerve segmentation.
Findings
The model achieved a 73.3% Dice score on optic nerve segmentation.
It outperformed existing methods with an 84.5% AUROC for optic nerve sheath diameter quantification.
The model shows strong potential for clinical applications in neuro-ophthalmology.
Abstract
Optic nerve quantification plays a pivotal role as a biomarker in the non-invasive assessment of elevated intracranial pressure and other neuro-ophthalmic conditions. The manual identification of these optic nerve structures is both resource-intensive and time-consuming. The accuracy of optic nerve segmentation in automated methods directly depends on the quality of the ultrasound images. In instances of sub-optimal image quality, applying deep learning-based methodologies emerges as a more effective approach for precise segmentation. In this work, we propose a deep neural network combining the benefits of shared and specific feature extraction branches as well as the uncertainty-aware loss function. Such an uncertainty-aware loss function could enable the model to learn a robust object structure. Experiments on a multi-center publicly available dataset demonstrate the superior…
Genes, proteins, chemicals, diseases, species, mutations and cell lines named across the full text — each resolved to its canonical identifier and authoritative record.
Click any figure to enlarge with its caption.
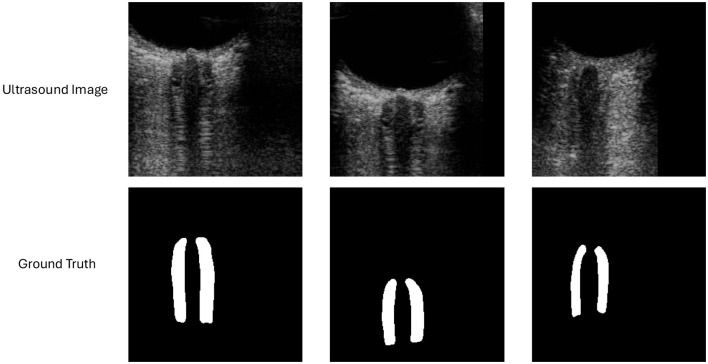 Figure 1
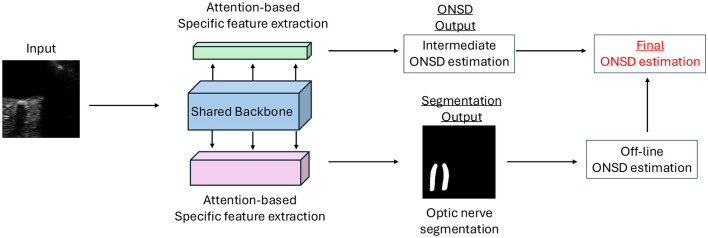 Figure 2
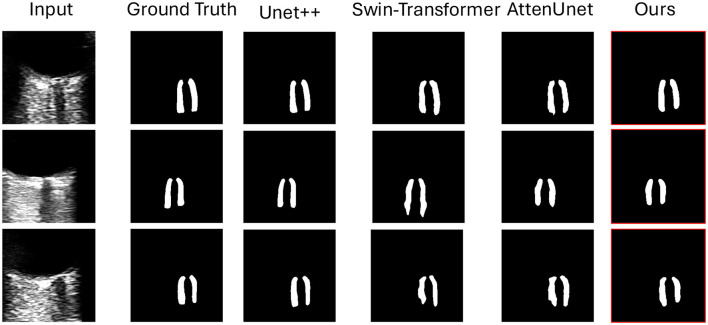 Figure 3
|
|
|
|
|
|
|
|---|---|---|---|---|---|
|
| 26.1 | 92.2 | 96.5 | 72.2 | 83.2 |
|
| 25.2 | 92.1 | 95.3 | 71.2 | 82.1 |
|
| 23.3 | 91.0 | 95.3 | 71.0 | 80.0 |
|
| 23.9 | 90.3 | 95.1 | 69.8 | 81.3 |
|
| 24.1 | 90.8 | 95.4 | 70.4 | 82.5 |
|
|
|
|
|
|
|
|
|
|
|
|
| ||||
|---|---|---|---|---|---|---|---|---|
|
|
|
|
|
|
|
|
| |
|
| 0.30 | 0.42 | 0.62 | 0.63 | 0.67 | 0.65 | 0.10 | 0.022 |
|
| 0.34 | 0.41 | 0.63 | 0.64 | 0.66 | 0.65 | 0.11 | 0.021 |
|
| 0.29 | 0.43 | 0.62 | 0.63 | 0.66 | 0.64 | 0.11 | 0.022 |
|
| 0.31 | 0.42 | 0.65 | 0.64 | 0.65 | 0.64 | 0.12 | 0.023 |
|
| 0.32 | 0.40 | 0.63 | 0.65 | 0.66 | 0.65 | 0.12 | 0.022 |
|
|
|
|
|
|
|
|
|
|
Peer Reviews
No public reviews on file for this paper yet. If you reviewed it on a platform where reviews are public (OpenReview, ICLR, NeurIPS, ICML), you can paste yours below so the community can read it here.
Videos
No videos yet. Explain this paper in a talk, walkthrough, or lecture? Add one.
Taxonomy
TopicsRetinal Imaging and Analysis · Traumatic Brain Injury and Neurovascular Disturbances · Cerebral Venous Sinus Thrombosis
Introduction
1
In recent years, the growing number of surgical patients, together with advancements in surgical techniques and the widespread adoption of minimally invasive procedures, has imposed higher demands on anesthesia and perioperative management. During general anesthesia, factors such as surgical manipulation, carbon dioxide pneumoperitoneum, and specific patient positioning can increase cerebral blood flow, elevate resistance to intracranial venous return, and raise jugular bulb pressure, thereby increasing intracranial pressure (ICP) (1–3). These changes may disrupt the balance between cerebral oxygen supply and demand, thereby increasing the risk of perioperative neurological complications. Cerebral protection is particularly critical in neurosurgery, in surgeries involving elderly patients, during emergency resuscitation, and cardiopulmonary-cerebral resuscitation following cardiac arrest.
Clinically, monitoring ICP in high-risk patients is essential. However, invasive ICP monitoring carries risks such as bleeding, infection, and catheter obstruction, in addition to being technically demanding and costly (4–7). The optic nerve sheath (ONS), an extension of the intracranial dura and arachnoid mater, contains a complex system of trabeculae and septa that compartmentalize the subarachnoid space, allowing cerebrospinal fluid (CSF) to flow gradually (8). Elevated ICP causes CSF to enter the ONS, leading to dilation of the optic nerve sheath diameter (ONSD), which serves as a reliable indicator of raised ICP (9–11). Studies have demonstrated a positive correlation between ultrasonographically measured ONSD and ICP (12–14), establishing it as a practical method for dynamic ICP monitoring (15) and even a potential alternative to CT in diagnosing intracranial hypertension (16). Transorbital ultrasound measurement of ONSD at 3 mm behind the retina (17) offers several advantages, including non-invasiveness, real-time assessment, rapidity, safety, high reproducibility, and bedside applicability (18, 19). This technique has broad clinical utility as an intraoperative ICP monitoring tool, providing clinicians with a novel approach to assess ICP dynamically. Early detection of elevated ICP can guide anesthesia management and perioperative decision-making, improving patient outcomes. Currently, there is no universally established ONSD threshold for intracranial hypertension due to variations across ethnicities and individuals (20, 21). Nevertheless, continuous ONSD monitoring can effectively track fluctuations in ICP. Multiple intraoperative factors, such as prolonged Trendelenburg positioning, carbon dioxide pneumoperitoneum (22–27), blood pressure, arterial carbon dioxide partial pressure, and anesthetic agents (28, 29), may influence ONSD. Anesthesiologists must closely monitor these variables to ensure accurate interpretation. By detecting ONSD changes earlier, proactive interventions can be implemented to mitigate ICP elevation, thereby preventing cerebral edema, ischemia, hypoxia, and perioperative neurological complications such as delayed emergence, postoperative delirium, and postoperative cognitive dysfunction.
Conventional ultrasonographic ONSD measurement requires operator expertise and is subject to inter-observer variability, making standardization a key concern in this field (30, 31). Inconsistent techniques may introduce measurement bias, compromising diagnostic reliability. Deep learning, a machine learning (ML) technique that extracts predictive features from labeled medical imaging datasets, circumvents complex manual processing. With the rapid advancement of artificial intelligence (AI), integrating AI into medical practice enables automated real-time assessments, significantly enhancing clinical workflows. AI-based algorithms (32) can automatically identify and measure ONSD in ultrasound images, precisely localizing its boundaries and calculating its diameter with high accuracy and consistency. Compared to manual measurements, AI reduces operator dependency and human error while improving efficiency (33). Real-time AI-assisted ONSD monitoring facilitates prompt detection of abnormal changes, enabling timely therapeutic adjustments and optimizing anesthesia management. Such an AI-assistant pipeline can reduce perioperative neurological complications, improve patient prognosis, and enhance overall perioperative safety. In this work, we propose a deep-learning-based method to automatically measure the ONSD via accurate optic nerve segmentation in real time. Our proposed method leverages the benefits of multi-scale attentions mechanism, combining the multitask-learning-based neural network framework with uncertainty-aware loss-based learning process. Significant improvement is observed over a multicenter dataset on both ONSD diameter quantification and optic nerve segmentation tasks over the compared state-of-the-art methods as well as the baseline models.
Related work
2
ML offers a promising solution to several challenges associated with manual ultrasonographic ONSD measurement, particularly by reducing reliance on expert operators. When trained on a sufficiently diverse dataset, ML algorithms may also help mitigate the variability in image acquisition and interpretation that is commonly reported in the literature (34).
For example, Pang et al. (35) were the first to apply deep learning, specifically convolutional neural networks (CNNs), to the task of automating ONSD measurement in ultrasound imaging. Their system operated by identifying the eyeball region, then estimating the optic nerve's direction using the centroids of the eye and optic nerve, before calculating ONSD based on segmentation of the hypoechoic zone located behind the eye. Differently, Meiburger et al. (33) use a single model to segment images from a multicenter data set with different US machines. This is the first time that ML algorithm shows the ability of fully automated pipeline in this task that can actually handle diverse imaging modalities and clinical settings. Similarly, Marzola et al. (36) trained a segmentation model that can generate relatively reliable results on segmentation task given region-based segmentation metrics, while the measurement of ONSD is lower than the expected, which may result in unstable diagnosis.
To improve, researchers proposed different methods to get better ONSD measures automatically. For example, Hirzallah et al. (37) trained CNN model to predict the mask between subarachnoid space's outer margins. This is the first time that a ML method can generate reliable performance on automatic ONSD measurement using mask instead of anatomic segmentation or landmark detection, while there is still limitation such as the inability to differentiate finer anatomic features. For example, it is very hard to differentiate the internal and external ONSD. Similarly, Netteland et al. (38) compared automated and manual ONSD measurements in patients with traumatic brain injury (TBI) admitted to a neurocritical care unit. Their method was the first to guide clinicians in correct probe placement during image acquisition. However, their method has suboptimal ON alignment on a subset of images, which may compromise accuracy. One potential solution is to incorporate real-time feedback mechanism for image quality assessment, while this may lead to additional subjective feedback or individual diversity. Differently, Singh et al. (39) created a region-based CNN object detection framework designed to automatically select the optimal frame for measurement by evaluating four factors: detection confidence, assigned class label, and specific criteria related to the window and sheath boundaries. Once the best frame was identified, the algorithm proceeded to locate the optic nerve along with its center and tip. From the ON tip, it generated multiple parabolic curves, ultimately selecting the parabola that exhibited the greatest variation in summed intensity to determine the ONSD measurement.
For ONSD measurement to be truly autonomous, both image acquisition and measurement must be automated. However, a major gap in the literature lies in the limited attention given to automating the acquisition process. Most existing approaches have concentrated on automating the measurement component, while still relying on skilled operators to capture high-quality ultrasound images. Addressing this limitation could involve using machine learning to provide real-time feedback and guidance to novice users during image acquisition (40), or leveraging robotic ultrasound systems to standardize the imaging process (40, 41). Future research should assess how well models perform when ONSD measurements are affected by common imaging artifacts–such as a tilted optic nerve axis, thickened outer bands, acoustic shadowing, and unclear anatomical boundaries. These artifacts can significantly hinder accurate image analysis. Therefore, developing models that either maintain measurement accuracy despite these challenges or can reliably flag suboptimal images as unsuitable for measurement would enhance their clinical utility and real-world applicability.
Differently, in this work, we propose a deep-learning-based automatic method to capture the anatomy structure as well as the quantitative result of ONSD at the same time. Using the proposed multi-scale attention pipeline and uncertainty-aware learning loss, our model can identify different scales of boundary area when low-quality issues occur, such as blurred boundaries. Our experimental results demonstrate the ability of our proposed method, regardless of qualitative or quantitative results. More details can be found in the Experiment section. Notably, our method is novel and different from the existing methods, which can share a similar pipeline with uncertainty estimation and attention mechanism. For example, compared with Meiburger et al. (33), our method can merge the uncertainty into the loss function calculation, where different potentials are considered. Differently, they can only directly estimate the final results while there is no estimation process of the uncertainty. On the other hand, compared with Marzola et al. (36), our model can fully utilize the attention mechanism to guide the model to focus on the region of the interested area, resulting in better segmentation performance.
Material and methods section
3
An example of ultrasound images and masks are shown in Figure 1. An overall model structure is introduced in Figure 2, where there is a shared feature extraction module, a specific feature extraction module, and an uncertainty-aware learning process. Specifically, the output from ON segmentation brunch will be fed into the ONSD direct estimation brunch, as prior knowledge, for reasonable estimation. The final estimation of ONSD will be the one that averaged from both ON brunch (after post-process) and direct ONSD estimation brunch.
Sample ultrasound image for optic nerve segmentation and potential OND/ONSD quantification.
Figure of our proposed model structure. Our model contains three modules, including shared backbone model and attention-based specific feature extraction module for two tasks. The detailed structure of each module is shown in the figure. Notably, the final ONSD estimation is combined from both the direct ONSD estimation from the model and also the post-processed ONSD results after the segmentation performance of the model's output.
Shared feature extraction module
3.1
Instead of relying on a conventional shared backbone to extract general-purpose features for multiple tasks, we adopted an attention-driven, task-adaptive backbone architecture that enhances the discriminative capacity of features for respective tasks, ultimately boosting the performance of the primary task. Notably, this is inspired by Meng et al. (42). The architecture is illustrated in Figure 2, comprising a central backbone and two attention-modulated branches, each tailored for specific tasks. For consistency and fair comparison with the existing methods, our backbone leverages the ResNet50 (43) architecture. However, this choice is flexible; alternative robust backbones have also been explored. To incorporate global contextual dependencies, we devised a Feature Aggregation Block, which hierarchically and iteratively integrates features from deeper layers back into earlier ones. This process involves up-sampling (via bilinear interpolation), concatenation, and convolution to align feature map channels and spatial resolutions. The aggregation process enables the network to capture a rich spectrum of semantic and spatial information spanning multiple levels of abstraction.
Within each of the two specific task branches, the multi-scale attention mechanism is employed to refine task-specific feature learning. Each attention block begins with global average pooling, which summarizes global context across channels, generating an attention tensor to modulate feature emphasis. This is followed by two blocks, each containing a 1 × 1 convolution layer, batch normalization (44), and non-linear activations (ReLU and sigmoid). The attention score is then applied via element-wise multiplication to modulate the output of the shared backbone, effectively filtering out irrelevant features for each task. This design enables the backbone to retain generalizable representations, while the branches learn task-specific features in a unified, end-to-end framework.
Specific feature extraction module
3.2
The attention mechanism in our model is crafted to help the task-specific branches focus on features relevant to their particular tasks. This is achieved by introducing a soft attention mask that modulates the shared features in the network. For each task and each feature channel, a distinct attention mask is applied. Let's denote the shared feature maps at the ℓ^th^ layer as Q^(ℓ)^, and the corresponding attention mask for task t at that layer as . The task-specific feature maps, denoted as , are then obtained by performing an element-wise multiplication:
where ⊙ denotes element-wise multiplication.
In the initial layers, the attention mechanism receives as input only the shared features extracted by the base network. However, for subsequent layers (ℓ≥2), the attention modules incorporate both the shared features U^(ℓ)^ and the task-specific features from the preceding layer, , using a combination of convolutional transformations and concatenations:
Here, F^(ℓ)^, , and represent convolutional blocks equipped with batch normalization and non-linear activation functions. The functions and use 1 × 1 convolution kernels to compute the attention masks specific to each task, while F^(ℓ)^ employs 3 × 3 kernels to refine and aggregate features across channels and spatial dimensions. Downsampling or pooling is applied to align the resolutions of the feature maps where needed.
To ensure that the attention mask outputs are valid for modulating features, we apply a sigmoid activation to , constraining its values between 0 and 1. This design ensures that, at worst, our system performs comparably to a standard shared multi-task model where tasks are split only at the final stage.
Uncertainty-aware loss functions
3.3
Region-based loss functions, such as the Dice loss (45), are widely employed due to their effectiveness in achieving accurate segmentation outcomes. Nevertheless, their performance can be compromised by the complex and noisy background typically present in ultrasound images. This challenge often leads to uncertainty near the boundaries of the region of interest, as noted in et al. (46), potentially resulting in suboptimal segmentation quality and less reliable estimation of the optic nerve diameter sheath characterization. In response, we incorporated the Uncertainty-aware auto learning loss (47, 48), which allows the model to adjust its learning process based on detected uncertainties, improving both resilience and precision by emphasizing confident predictions and reducing the impact of ambiguous ones. By incorporating uncertainty into the loss calculation, the model can dynamically assign weights to different components of the loss function, helping to balance global and local accuracy while mitigating the effects of class imbalance. As a result, the model focuses more on reliable data points and minimizes the influence of potentially noisy or uncertain samples, thereby enhancing robustness. Ultimately, this leads to a noticeable improvement in segmentation performance, as the model becomes better equipped to handle both confident and uncertain predictions effectively. The uncertainty-aware loss Luncertainty is formulated as following:
Here, K denotes the total number of individual loss components, where each Lk represents a specific loss term, such as Dice loss (45), cross entropy loss, mean squared error, or shape-distance loss. The σ_k_ terms are learnable noise parameters via a MLP at the output layer of the model. A higher noise level indicates greater uncertainty in understanding the data, which in turn assigns a higher learning weight to that component. These parameters are optimized during training to minimize the overall loss. The final term in the loss function acts as a regularization mechanism, preventing the noise levels from becoming excessively large. In this work, we incorporate several key loss functions, while additional options can be found in the survey (49):
Mean Squared Error Loss: A pixel-wise loss function that calculates the squared difference between each predicted pixel value and its corresponding ground truth. It ensures pixel-level accuracy and quantifies the model's prediction precision.Dice Coefficient Loss: A region-based loss function focusing on the overlap between the predicted segmentation and the ground truth, promoting accurate delineation of shapes and boundaries in the segmented regions.Cross-Entropy Loss: A distribution-based loss that measures the classification accuracy at the pixel level, helping improve the model's ability to distinguish between different classes.Shape-Distance Loss: A distribution-based loss designed to enhance shape features and improve boundary alignment in segmentation tasks. It encourages the model to focus on the geometric and structural details of the target regions during training.
Notably, the above loss function term will only be used for the segmentation task of optic nerve, and we adopt different losses options (Lregression) for the regression task of ONSD estimation brunch. Thus, the total loss function (Ltotal) can be written as:
where w1 and w2 are the hyper-parameters that control the balanced weights of two loss terms, and we set them to 0.5 each in this work. Also, we adopt mean square error loss for the Lregression loss in this work after empirically validated.
Experiments
3.4
Datasets
3.4.1
For this study, we employed the transorbital sonography (TOS) dataset (36). The dataset consists of 464 B-mode ultrasound images obtained from 110 individual participants. Data collection was performed across four independent medical centers using five different ultrasound machines, introducing a diverse range of imaging conditions and device-specific characteristics. To standardize the input for model development, all images were uniformly resized to 256 × 256 pixels and pre-cropped to focus on the orbital region. Expert manual annotations are provided for each image, delineating both the optic nerve (ON) and the optic nerve sheath (ONS). The multicenter, multi-device nature of the dataset enhances its utility in developing generalizable deep learning models for optic nerve assessment in transorbital ultrasound imaging.
Experimental setting
3.4.2
To enhance the model's generalization ability and mitigate the risk of overfitting, we adopted an online data augmentation approach during training. This involved applying random geometric transformations—including horizontal flips and rotations—each with a 30% probability. The rotation angles were uniformly drawn from the range of −20° to 20°, allowing the model to learn orientation-invariant features and improving its robustness to anatomical variability. We did extensive experiments to tune the various hyperparameters, such as the augmentation policy including cropping, brightness scaling, etc. It turns out that different augmentation strategies did not make a very big difference to the final results. Model optimization was carried out using stochastic gradient descent (SGD) with a momentum term set to 0.9, which served to accelerate convergence and smooth the optimization trajectory. All experimental configurations were trained for 150 epochs. The initial learning rate was set at 5 × 10^−3^ and was progressively reduced using a step-decay policy, with a decay factor of 0.99 applied every 100 iterations to promote stable convergence. A batch size of 24 was used, providing a good trade-off between memory efficiency and gradient estimation stability. All experiments were executed in an end-to-end training manner on a high-performance workstation powered by an NVIDIA GeForce RTX 2080Ti GPU with 11GB of VRAM. For segmentation output, a fixed threshold of 0.5 was applied to the predicted probability maps to obtain binary masks. To ensure fair benchmarking and reproducibility, no post-processing steps or model ensembling strategies were employed throughout the evaluation pipeline. Notably, we performed five-fold experiments to demonstrate the fair and robust model's performance.
Evaluation metrics
3.4.3
The model generates a probability map as its output for segmentation task, assigning each pixel a likelihood of belonging to the vessel class. In our experiments, a threshold of 0.5 was applied to the probability map to generate the final segmentation results. To thoroughly evaluate the performance of the proposed framework during the testing phase, we will compute the following metrics:
SE (sensitivity) = TP / (TP + FN),SP (specificity) = TN / (TN + FP)F1 (F1 score) = (2 × TP) / (2 × TP + FP + FN)95% HD = 95 % Hausdorff DistanceAUROC = Area under the Receiver Operating Characteristic Curve.
In this context, correctly identifying a vessel pixel is termed a true positive (TP), while incorrectly classifying a non-vessel pixel as a vessel is referred to as a false positive (FP). Similarly, accurately recognizing a non-vessel pixel is called a true negative (TN), and failing to detect a vessel pixel is classified as a false negative (FN). The Hausdorff distance measures the greatest distance from a point in one set to the closest point in the other set. It captures the worst-case scenario of mismatch between predicted and ground truth boundaries. And 95% HD considers the distance that 95% of the points are within, effectively discarding the top 5% of outliers. This makes it more robust to extreme outliers, which can occur due to small segmentation errors.
Compared methods
3.4.4
We compared our approach to other classic and state-of-the-art models that have achieved promising performance on different medical image segmentation tasks. All of the experiments are conducted under the same experimental setting. The compared methods are briefly introduced below:
Unet (50): Unet is a convolutional neural network (CNN) architecture built for image segmentation tasks. Its distinctive U-shaped structure consists of an encoder that captures features and a corresponding decoder that reconstructs segmented outputs. Skip connections link matching layers in the encoder and decoder, preserving detailed information and context. This design has proven highly effective, particularly in biomedical image segmentation tasks.Unet++ (51): Unet++ is an enhanced variant of the U-Net model, designed for image segmentation tasks. It introduces nested skip connections and sophisticated feature aggregation pathways, enabling improved integration of multi-scale information and richer contextual understanding. These improvements contribute to more accurate and precise segmentation compared to the original U-Net design.Swin-Transformer (52): Swin-Transformer is a hierarchical vision transformer architecture that processes image patches at multiple scales using shifted windows. This approach enables the model to capture both local and global contextual information more effectively. With its innovative design, Swin-Transformer has achieved strong segmentation results while maintaining computational efficiency.AttenUnet (53): AttenUnet builds upon the classic U-Net model by introducing attention mechanisms that allow the network to concentrate on critical regions within an image during segmentation. These mechanisms help the model refine the outlines of objects and reduce distractions from less relevant details. This approach is especially valuable in tasks like medical image segmentation, where precise boundary definition is crucial.TransUnet (54): TransUNet is designed to enhance medical image segmentation by addressing the challenges faced by the commonly used U-Net architecture. It combines the ability of Transformers to capture global context with U-Net's strength in accurately locating features. The transformer component processes patches extracted from CNN feature maps to understand the broader context, and the decoder then integrates this information with high-resolution feature maps, resulting in more precise segmentation.Swin-Unet (55): Swin-Unet is a Unet-like pure transformer for medical image segmentation. The tokenised image patches are fed into the transformer-based U-shaped encoder-decoder architecture with skip-connections for local-global semantic feature learning. Their method can benefit from both the strength of Unet and Swin-Transformer for sufficient feature extraction and local-global context information aggregation.
Results
4
Optic nerve segmentation performance
4.1
Figure 3 illustrates qualitative comparison with other compared methods on the test dataset. Table 1 shows the quantitative performance of Ours and other methods on four different datasets, respectively.
Qualitative results of the optic nerve segmentation. We compare our model with Unet++ (51), Swin-Transformer (52), AttenUnet (53). Our method can produce more accurate segmentation results than the other methods compared with the ground truth.
In detail, Ours achieved 21.2 (95%)HD on optic nerve segmentation, which outperformed Unet (50) by 18.8 %, outperformed Swin-Transformer (52) by 9 % and outperformed TransUnet (54) by 12 %. Ours achieved 84.5 % AUROC on optic nerve segmentation, which outperformed Unet (50) by 1.6 %, outperformed Swin-Transformer (52) by 5.6 % and outperformed TransUnet (54) by 2.4 %. Additionally, Ours achieved 73.3 % Dice on optic nerve segmentation, which outperformed Unet (50) by 1.5 %, outperformed Swin-Transformer (52) by 3.2 % and outperformed TransUnet (54) by 4.1 %.
Notably, Ours adopted ResNet50 (43) as the backbone to extract the features from the input image, while some of the compared methods use Transformer-based architecture. Even though Transformer-based methods usually can obtain a better performance due to their superior ability of extracting feature, Ours benefits from the special designed module structure, thus can give a better performance.
Figure 3 shows the qualitative comparison between ours and other compared methods. It demonstrated that our proposed methods can segment the optic nerve boundary more accurately. This is important for optic nerve segmentation tasks and ONSD quantification with more accurate diameter calculation.
OND and ONSD estimation performance
4.2
To determine whether the enhancements in segmentation quality contribute to improved clinical measurement accuracy, we assessed both the optic nerve diameter (OND) and the optic nerve sheath diameter (ONSD). These measurements were derived using the standardized MATLAB tool accompanying the dataset. Consistent with previous methodologies (36), we extracted the diameters automatically from the predicted segmentation masks and benchmarked them against manually annotated ground truths.
Table 2 summarizes the quantitative findings. Ours achieved a mean absolute error (MAE) of 0.26 mm for OND and 0.41 mm for ONSD. Compared to Marzola et al. (36), our method shows a significant improvement in OND accuracy while maintaining comparable performance for ONSD. Our method's performance on intraclass correlation coefficients (ICC) were robust for both estimation measurements (OND: 0.67, ONSD: 0.66), indicating strong consistency aligning with clinical expert assessments.
Both OND and ONSD are considered clinically relevant biomarkers, especially for detecting raised intracranial pressure (56). Our results confirm that the proposed uncertainty-aware architecture enhances segmentation quality and supports accurate, automated quantification of both anatomical structures from transorbital ultrasound images.
Discussion
5
Even though our model achieved superior performance over other methods in the test dataset, there are some limitations about the proposed methods and experimental design in the work. Firstly, the limited number of data makes the whole framework less generalizable and lacks a demonstration of robustness. Secondly, only one center of the dataset is used for this study, while in the real world, different scenes result in different image quality and conditions. Thus it is unknown if the model can handle the domain difference issue. Thirdly, the efficiency and inference speed are not addressed in this work, which could be important for a specific surgical task.
As for the future work, we will conduct validation experiments on more centers' datasets and more number of data cases included for more robust model's development.
Conclusion
6
We have proposed a novel and comprehensive framework for optic nerve segmentation and optic nerve sheath diameter quantification. It takes advantage of task-specific attention branches to aggregate the information while maintaining the accuracy of the boundary segmentation with the benefits of uncertainty-aware loss functions. Our experiments on multi-center large-scale dataset have demonstrated that our framework can simultaneously conduct accurate segmentation and potential optic nerve sheath diameter quantification performance.
The reference list from the paper itself. Each links out to its DOI / PubMed record.
- 1Halverson A Barrett W Iglesias A Lee W Garber S Sackier J. Decreased cerebrospinal fluid absorption during abdominal insufflation. Surg Endosc. (1999) 13:797–800. doi: 10.1007/s 00464990110210430688 · doi ↗ · pubmed ↗
- 2Lovell AT Marshall AC Elwell CE Smith M Goldstone JC. Changes in cerebral blood volume with changes in position in awake and anesthetized subjects. Anesth Analg. (2000) 90:372–6. doi: 10.1213/00000539-200002000-0002510648324 · doi ↗ · pubmed ↗
- 3Petersen LG Petersen JCG Andresen M Secher NH Juhler M. Postural influence on intracranial and cerebral perfusion pressure in ambulatory neurosurgical patients. Am J Physiol-Regul Integr Comp Physiol. (2016) 310:R 100–4. doi: 10.1152/ajpregu.00302.201526468260 · doi ↗ · pubmed ↗
- 4Tavakoli S Peitz G Ares W Hafeez S Grandhi R. Complications of invasive intracranial pressure monitoring devices in neurocritical care. Neurosurg Focus. (2017) 43:E 6. doi: 10.3171/2017.8.FOCUS 1745029088962 · doi ↗ · pubmed ↗
- 5Chatzi M Karvouniaris M Makris D Tsimitrea E Gatos C Tasiou A . Bundle of measures for external cerebral ventricular drainage-associated ventriculitis. Crit Care Med. (2014) 42:66–73. doi: 10.1097/CCM.0b 013e 31829 a 70a 523982025 · doi ↗ · pubmed ↗
- 6Chesnut RM Temkin N Carney N Dikmen S Rondina C Videtta W . A trial of intracranial-pressure monitoring in traumatic brain injury. N Engl J Med. (2012) 367:2471–81. doi: 10.1056/NEJ Moa 120736323234472 PMC 3565432 · doi ↗ · pubmed ↗
- 7Le Roux P Menon DK Citerio G Vespa P Bader MK Brophy GM . Consensus summary statement of the international multidisciplinary consensus conference on multimodality monitoring in neurocritical care: a statement for healthcare professionals from the Neurocritical Care Society and the European Society of Intensive Care Medicine. Neurocrit Care. (2014) 21:1–26. doi: 10.1007/s 12028-014-0041-525208678 PMC 10596301 · doi ↗ · pubmed ↗
- 8Killer H Laeng H Flammer J Groscurth P. Architecture of arachnoid trabeculae, pillars, and septa in the subarachnoid space of the human optic nerve: anatomy and clinical considerations. Br J Ophthalmol. (2003) 87:777–81. doi: 10.1136/bjo.87.6.77712770980 PMC 1771732 · doi ↗ · pubmed ↗